Effects of Some Weather Parameters on Oil Palm Production in the Peninsular Malaysia
←
→
Page content transcription
If your browser does not render page correctly, please read the page content below
Preprints (www.preprints.org) | NOT PEER-REVIEWED | Posted: 17 June 2021                              doi:10.20944/preprints202106.0456.v1

          Article

          Effects of Some Weather Parameters on Oil Palm Production in
          the Peninsular Malaysia
          Abubakar Ahmed 1,*, Mohd Yusoff Bin Ishak 2, Mohd Kamal Uddin 3, Mohd Yusoff Abd Samad 4, Suleiman
          Mukhtar 4 and Samir Shehu Danhassan 5

                                           1Faculty of Forestry and Environment, Universiti Putra Malaysia, 43400 Serdang, Selangor, Malaysia,

                                          Email: abubakar8550483@gmail.com
                                           2Faculty of Forestry and Environment, Universiti Putra Malaysia, 43400 Serdang, Selangor, Malaysia, Email:

                                          m_yusoff@upm.edu.my
                                          3Faculty   of Agriculture University Putra Malaysia, 43400 Serdang, Selangor, Malaysia, Email:
                                          myusoffas@upm.edu.my
                                          4Faculty   of Agriculture University Putra Malaysia, 43400 Serdang, Selangor, Malaysia, Email:
                                          mkuddin@upm.edu.my
                                          5Department   of Geography, Federal University Gashua, Nigeria, Email: smukhtar27.sm@gmail.com
                                          6Department       of      Geography,       Jodhpur       National       University,      India,     Email:
                                          samirshehudanhassan@gmail.com

                                       * Correspondence: e-mail: abubakar8550483@gmail.com; Tel.: +601120755790

                                        Abstract: The effect of some weather parameters (rainfall and temperature) on the production of
                                        oil palm in Peninsular Malaysia was investigated. Data were analysed using the Statistical Package
                                        for Social Sciences (SPSS 20.0 version), with descriptive statistics, time series analysis, and multiple
                                        linear regression (MLR) carried out. SPSS and Microsoft Excel 2010 were used to analyse the results.
                                        The MLR model determined the strength of the relationship between oil palm yield (dependent
                                        variable) and the changing variables of temperature and rainfall (independent variables). The
                                        regression output returned three components; regression coefficients, regression statistics and
                                        ANOVA. The findings of the study revealed medium to high rainfall variability at the rate of 0.0008.
                                        This implies that rainfall is increasing over time with variations in its amount and intensity. As
                                        rainfall increases oil palm FFB production is predicted to increase at a slow rate of 0.0009. The
                                        estimation of average annual temperature indicated an increase of 5.6℃ at the rate of 0.0357℃ per
                                        year with a temperature maximum of 32.01℃ and minimum of 25.45℃. The result also revealed
                                        an increase in oil palm yield at the rate of 0.2581 per year with a mean value of 176247.6. Overall,
                                        there is a significant difference in the impact of rainfall and temperature on oil palm yield. This
                                        signifies that rainfall has a significant impact on oil palm yield (FFB) compared to temperature.

                                       Keywords: Rainfall; Temperature; oil palm Malaysia

                                       1. Introduction
                                                 Elaeis guineensis or oil palm is the most widely used palm oil species,
                                          originating from West Africa [1,2,3,4,5]. It was first introduced to South-east Asia when
                                          planted at the Bogor Botanical Garden, Indonesia, in 1848 [3] and first planted in
                                          Malaysia as an ornamental plant in 1871 [6]. The first commercial plantation was in
                                          1917 at Tennamaram estate in Selangor, Malaysia [4]. The crop is characterised by its
                                          high output turnover, being easy and simple to establish, and is a low cost and highly
                                          efficient oil crop [1,7]. Oil palm is now widely cultivated in various tropical countries
                                          covering more than 18.1 million hectares in over 43 countries [1]. Indonesia and
                                          Malaysia are the major players in oil palm cultivation and produce around 85% of the
                                          global palm oil [1,8]. Among the major countries in oil palm production are Indonesia,

            © 2021 by the author(s). Distributed under a Creative Commons CC BY license.
Preprints (www.preprints.org) | NOT PEER-REVIEWED | Posted: 17 June 2021 doi:10.20944/preprints202106.0456.v1
2 of 17
Malaysia, Nigeria, Democratic Republic of the Congo, the Ivory Coast, Brazil, Colombia,
Costa Rica, and Ecuador [1,2]. Oil palm thrives in humid climates where rain usually
falls at nights and the days brighter with abundant sunshine of minimum 16 or 17 MJ
m−1 d−, with rainfall amounting to 2000 mm spread equally over the course of the year
[9,10]. For maximum fresh fruit bunch production, a maximum temperature range of
29–33℃ and a minimum temperature range of 22–24℃ is required [2,11]. Relative
humidity should be greater than 85% [10]. Oil palm thrives in a variety of soil
conditions, with pH 4–8 and abundant moisture [5]. Oil palm does not thrive well in a
competing environment with other plants and areas where there is constant flooding;
the plant requires open spaces [2,5]. Oil palm cultivation is vulnerable to the effect of
some weather parameters especially temperature and rainfall [12].
The distribution of rainfall affects the growth and development of palm trees,
which in turn affects palm oil production. Excessive rainfall also harms the fresh fruit
bunch (FFB), reduces the plantation road/path quality, stifles harvest activity, and
causes flooding [4]. The yield of oil palm is constrained by the duration of the yearly
dry season, so countries that have consistent high rainfall all year round, such as parts
of Southeast Asia, have particularly high yields [12]. Soil moisture availability which is
determined by the amount of rainfall received and irrigation in some cases is by far the
most crucial component in determining the FFB yield of oil palm. Scarcity of moisture
in oil palm plantation leads to retarded growth, decline in yield output and tendency
of fire incidences, causing mass destruction of the palm trees, polluting and degrading
the air quality [12,13,14].
As the impact of climate change is predicted to continue, the danger of floods
and droughts is also expected to significantly rise in the 21st century especially in
Southeast Asia. Similarly, the impacts of El-Nino and La-Nina will pose risks to oil palm
cultivation in Malaysia [15]. Drought in Southeast Asia reduces the production capacity
of palm oil by 10–30% [16]. Drought frequency and severity in Southeast Asia may
increase over the next few decades [17,18,19]. Oil palm is vulnerable to lack of rain [1].
Higher temperatures would also lead to a rise in drought conditions, resulting in a
devastating loss of FFB yield. Because soil water is lost more quickly as temperatures
rise, the effects of dry spells become much more severe [12]. An unfavourable climatic
condition such as drought can lessen moisture supply, resulting in water deficiencies
which affect FFB formation [20]. Water shortage as a result of drought can reduce
the productive capacity of oil palms by decreasing the quantity of the fruits formed as
a result of male and female flowering ratios [21,22]. According to past research, a
moisture deficit of 100 mm in a year can reduce yield output by 8–10% in the year after
the drought and 3–4% in the subsequent years [22,23]. Similarly, [24] observed that a
100 mm moisture shortage in an oil palm plantation could affect the formation of FFB
in the flowering stages causing a 1–10% yield loss during floral initiation, sex
determination and floral abortion. Optimum temperatures and heavy rains are
favourable for palm oil production whereas floods and extended periods of drought
are unfavourable in most cases.
Heavy rainfall as a result of a La-Nina event affects or delays the harvesting
activities of FFB, causing waterlogging, rotten FFB and degrading the quality of CPO.
A mean temperature of ≥ 27.83°C in the 8 months prior to harvesting has been reported
to result in a declining FFB yield [16,25]. Variations between 0.6–1.4°C in the
temperature range and a 15% variation in rainfall resulted in an increase in profits for
palm oil to a maximum of USD2,453 annually, whereas income earned reduced to
USD1,181 in a year, with a 32% rainfall variation and moderate temperature variation.
Malaysia and other oil palm producing nations will be subjected to rising
climate ambiguities in the long term [26,27]. Climate change projections indicate thatPreprints (www.preprints.org) | NOT PEER-REVIEWED | Posted: 17 June 2021 doi:10.20944/preprints202106.0456.v1
3 of 17
the cultivation of oil palm will be hugely affected by climate change, with significant
effects for the economy of Malaysia, as well as the palm oil industries. A change in
climate status from highly suitable climate to merely suitable climate is projected for
Indonesia and Malaysia by 2070 to 2100 [26]. Equally, there will be a more noticeable
significant decrease in climatic suitability for oil palm cultivation in the Peninsular
Malaysia. A marginal decrease is projected to occur between 2030–2070 and dramatic
decrease in 2100 [26,27].
The variations in rainfall over the course of a year in Malaysia is usually
influenced heavily by the interannual variation of tropical Pacific sea-surface
temperature (SST) anomalies, especially the El-Nino/Southern Oscillation (ENSO) [10].
The El-Nino-Southern Oscillation is a coupled ocean-atmosphere interaction
phenomenon that happens in the Pacific Ocean around the equator and is among the
most visible drivers of seasonal to interannual global and regional variabilities in
climate [28,29,30]. The climatic characteristics of the environment have a large influence
on oil palm growth and yield. Extreme weather events such as El Nino or La Nina have
no direct or immediate impact on oil palm. Instead, they exert their influence on the
trees during the initial stages of development, such as frond production, sex ratio, floral
abortion scale, the degree of survival of flowers after anthesis, and the weight of fruit
bunches [30,31]. Therefore, understanding the impact of rainfall and temperature
variability on oil palm production in the Malaysian palm oil industry is critical for
designing innovative cultivation practices and ensuring global food security. First, the
study will describe the interannual variations and fluctuations in the FFB yield. and the
influence of weather variables (rainfall and temperature) on oil palm cultivation.
2. Materials and Methods
The study area
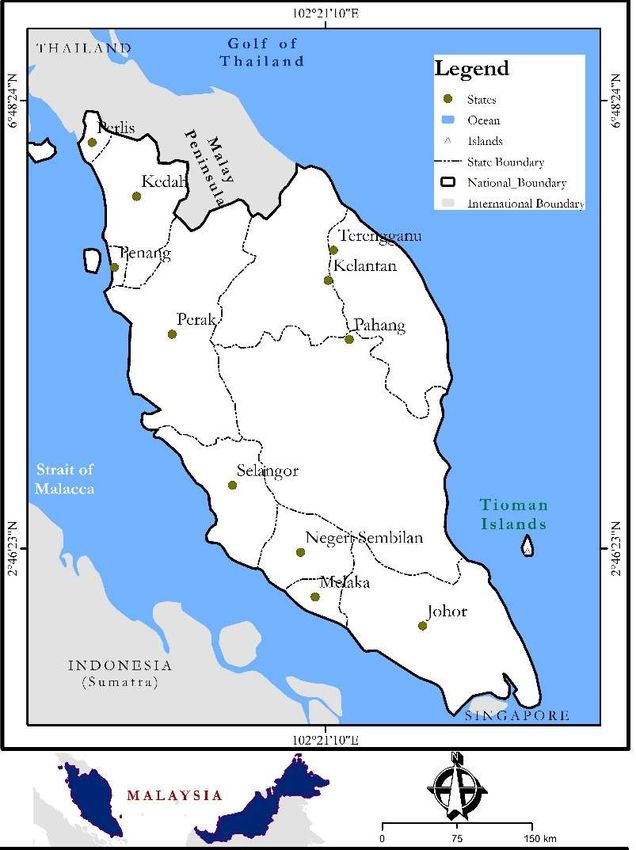
Peninsular Malaysia is the region of Malaysia that includes the Malay Peninsula
and its surrounding islands and geographically located 3.9743° N, 102.4381° E of the
Greenwich Meridian. Its total area is 132,265 km2. Peninsular Malaysia shares borders
with Thailand in the northeast and Singapore to the south, and is flanked by the Strait
of Malacca in the west and South China Sea in the east. Peninsular Malaysia experiences
high temperatures and humidity, as well as heavy rainfall all through the year. The
weather and climate of Peninsular Malaysia is usually controlled by the northeast and
southwest monsoons. The peninsula’s climate is characterised by four seasons; the
northeast monsoon usually from the months of November–March, the initial inter-
monsoonal season usually between March–May, the southwest monsoon usually
starting from May to October, as well as the second inter-monsoonal period starting
in October and ending in November.Preprints (www.preprints.org) | NOT PEER-REVIEWED | Posted: 17 June 2021 doi:10.20944/preprints202106.0456.v1
4 of 17
Figure 1. Peninsular Malaysia.
Methods
Secondary data was used for the purpose of this study. Data on oil palm yield
in Malaysia between 1975–2020 was obtained from the Malaysian Palm Oil Board
(MPOB). Climate historical data, particularly average annual temperature and rainfall
were also downloaded from the climate-knowledge portal of the World Bank, National
Hydraulic Research Institute of Malaysia (NAHRIM) and National Oceanic &
Atmospheric Administration (NOAA) in April, 2021. The oil palm yield, rainfall and
temperature data were transformed to a common base (log 10) using Minitab software.
This was done because the yield of crops is measured in tonnes per hectare (hg/ha) and
rainfall in millimetres (mm) whereas temperature is in degree Celsius. The analysis of
data used the Statistical Package for Social Sciences (SPSS 20.0 version) specifically
using descriptive statistics, time series analysis and multiple linear regression (MLR).
Graphs were produced with Microsoft Excel 2010 to summarise the results.
The MLR was used to gauge the relationship strength between oil palm yields
(dependent variable), normally signified by ‘Y’ and other changing variables
(temperature and rainfall) referred to as independent variables (Equation 1) as used by
[32] and [33]. The regression output returns three components: regression coefficients,
regression statistics and ANOVA tables. The regression coefficients give information
about the coefficients in the MLR Model. They include (1) estimates found using the
least-squares method; (2) the standard deviation of the least-squares estimates; (3) the
t-statistic for the null hypothesis that the coefficient is equal to zero, versus the
alternative hypothesis that it is different from zero; (4) the P-value for the t-test; as well
as (5) the lower and upper 95% that define the confidence interval for the coefficients.
Meanwhile, the regression statistics table shows the coefficient of multiple
determination (R2) which is defined in terms of sums of squares (Equation 2), and
shows how strong the correlation is held between the independent and the dependent
variables. R2 will be large (thus, its value is near 1); and vice versa when the regressionPreprints (www.preprints.org) | NOT PEER-REVIEWED | Posted: 17 June 2021 doi:10.20944/preprints202106.0456.v1
5 of 17
equation fits the data well. The estimate’s standard error measures the variability of
predictions in a regression. The quantity R or linear correlation coefficient, measures
the strength and direction of relationship between the variables. The ANOVA table
evaluates the regression equation by assessing the statistical significance of the
regression sum of square.
Thus, trend lines were drawn to show the rainfall, temperature and oil palm
yield patterns in the area of study. Linear trend line equations were fitted to show the
magnitude of change in these variables
Yi =β0 +β1X1+β2 X 2.....u ………..…..................... Equation 1
Where Y = Dependent variable (oil palm yield)
X1 and X2 = independent variables (temperature and rainfall)
β0, β1 and β2 = Regression parameters
u = Standard error
R2 = r2Y, Ŷ ……………………………………….. Equation 2
Where: R2 = coefficient of multiple correlation
Ŷ = predicted value of the dependent variable
Y = dependent variable raw score
rY, Ŷ = correlation between Y, Ŷ
3. Results and Discussion
Statistical Characteristics of Rainfall, Temperature and Oil Palm Yield in Peninsular
Malaysia
The results of the statistical analysis of annual rainfall, temperature and yield of
oil palm in Peninsular Malaysia between the periods of 1991–2019 clearly shows that
an annual mean rainfall of 243.7 mm with a standard deviation of 54.5, minimum of
156.3 mm, and a maximum of 311.04 mm were recorded having a range of 286.8. This
depicts a high difference in the highest and lowest amount of rainfall in the area. In
addition, it shows that the changes in rainfall was at the rate of 0.0153 (Table 1). For
optimum yield, oil palm requires about 1,500 mm–2000 mm of rainfall per year
corresponding to around 167 mm/month with an absence of dry season [9, 10, 11,12,
30].
Table 1. Variation in Rainfall, Temperature and Oil Palm Yield
Mean rainfall Mean Temp. (yearly) Value (oil Palm Yield)
Mean 243.6817 26.1169 176247.6
Standard Error 10.12254 0.233749 2908.715
Median 258.1558 25.78 175629
Standard Deviation 54.51154 1.258778 15663.91
Sample Variance 2971.508 1.584522 2.45E+08
Range 286.8823 6.56 60974
Minimum 156.30 25.45 142425
Maximum 311.0423 32.01 203399
Sum 7066.769 757.39 5111180
Count 29 29 29
Confidence Level 20.73508 0.478814 5958.232
(95.0%)
Source: Author’s Analysis (2021)
The estimation of average annual temperature in Peninsular Malaysia for the
period 1991–2019 indicates an increase of 5.6℃ at the rate of 0.0357℃ per year with a
temperature maximum of 32.01℃ and minimum of 25.45℃. However, the mean
minimum temperature shows to be 26.11℃ with standard deviation of 1.26. The resultsPreprints (www.preprints.org) | NOT PEER-REVIEWED | Posted: 17 June 2021 doi:10.20944/preprints202106.0456.v1
6 of 17
also reveal an increase of oil palm yield in the study area at the rate of 0.2581 per year
with a mean value of 176247.6 recorded (Table 1). The average maximum temperature
ranges from 29 to 33℃ and a minimum temperature of 22 to 240°C promotes maximum
FFB production [2,10,11,30]. The plant requires constant sunlight of at least 5 hours in
a day for an optimum yield [10,12,30].
Rainfall and temperature trend in Peninsular Malaysia.
Rainfall trend
The rainfall trend in Peninsular Malaysia shows a strong variability. For
example, 1992 and 2019 recorded the lowest rainfall of 209.18 mm and 156.3 mm,
respectively, while 2008 recorded the highest amount of rainfall at 320 mm. The Y value
stands at 0.0008. This implies that rainfall in the study area was increasing over time
with variations in its amount and perhaps intensity. This indicates an irregular pattern
within the period of the study. A trend of increased rainfall over Peninsular Malaysia
favours optimum oil palm FFB production [11,12,30,34,35]. However, as the global
climate is changing and getting warmer resulting in irregular and uncertain rainfall
patterns, storm surges frequency, and prolonged droughts in some places around the
globe [36].
Mean rainfall y = -0.084x + 420.19
350 R² = 0.0008
300
250
Rainfall in (mm)
200
150
100
50
0
1980 1990 2000 2010 2020 2030 2040
Time (Year)
Figure 2. Annual Mean Rainfall of Peninsular Malaysia 1991–2035. Source: Author’s analysis
The study observed an irregular increase in rainfall in terms of intensity and
temporal distribution in the study area. Noticeably, there was an increase in rainfall
between 2013 and 2017 and a decrease between 2017 and 2019 (Figure 2). This concurs
with the study of [37], which demonstrated that, besides the northern region of the
south-west zone, all regions in Peninsular Malaysia have a significant uptrend with at
least a 90% level of confidence in January. It has been noted that the northeast monsoon
(NEM) brings overwhelming rain to Peninsular Malaysia in comparison with the
southwest monsoon (SWM). The southwest and western coastal areas experience a
greater range of variation in rainfall under the NEM, and to a lesser degree during the
SWM.
Other studies in West Malaysia found increasing trends in annual rainfall as well as the
intensity of rainy days at various meteorological stations during the NEM, leading to
an increased pattern in annual rainfall [37,38,39,40]. Studies by [41] and [42] have
shown that as the earth’s surface warms, moisture evaporates from the surfaces such
as oceans, lakes and soils. Climatic models also tend to agree that when precipitation
does occur, it will become more intense almost everywhere.Preprints (www.preprints.org) | NOT PEER-REVIEWED | Posted: 17 June 2021 doi:10.20944/preprints202106.0456.v1
7 of 17
In addition, the figure 2 above reveals that rainfall in Peninsular Malaysia from
2020 to 2035 is predicted to show an increasingly irregular pattern. This is in conformity
with previous studies [37,39,40,41,42,43,44,45,46,47,48,49,50,51,52].
35 y = 0.0166x - 7.2312
R² = 0.0357
30
25
Temperature (0C)
Temperature
20 trend
Temperature trend
15
10
5
0
1980 1990 2000 2010 2020 2030 2040
Years
Figure 3. Annual Mean Temperature for Peninsular Malaysia 1991–2035. Source: Author’s analysis
Figure 3 shows the mean annual temperature for Peninsular Malaysia from
1991 to 2035. The figure shows that the maximum mean temperature recorded was in
2017 at 32.01℃ while the lowest mean temperature recorded was in 2008 at 25.45℃.
The study area experienced a sharp decrease in annual average temperatures from 1991
to 1997. In 1998, the annual average temperature rose to 26.24℃ and further dropped
to 25.6℃ and increasingly continued fluctuating. Generally, the daily average
temperature in the study area shows an increasing trend with a positive Y value of
0.0357 (Figure 3). Similarly, several studies have confirmed the trend of rising
temperatures in Malaysia [39,40].
This is a clear indication that temperature (minimum, maximum and average) is
on the increase in Peninsular Malaysia. When temperature rises by 1–4℃ oil palm
production is expected to decline by 10–40% in Malaysia [35]. The general temperature
increase in the study area affirms the assertion of the [53] that temperature is expected
to increase over time as a result of ozone depletion, arising from anthropogenic
activities, which increases the concentration of greenhouses gases (GHGs) in the
environment. The study is in conformity with the findings of [54] which claimed that
the mean surface temperature of the Earth rose by around 0.6°C ± 0.2°C during the 21st
century. The authors went on to say that it is warmer today than at any other time in
the last 1000 years all over the world. Weather extremes are becoming more common
around the world and are far more probable to continue in the future. Temperatures
are deemed to be extreme due to climate change and the rising trend would be
maintained sporadically as discovered in this study area.Preprints (www.preprints.org) | NOT PEER-REVIEWED | Posted: 17 June 2021 doi:10.20944/preprints202106.0456.v1
8 of 17
y = -0.0037x + 25.959
Yield tonne/hectare R² = 0.0012
25
20
Tonnes/ (ha)
15
10
5
0
1970 1975 1980 1985 1990 1995 2000 2005 2010 2015 2020 2025
Time (Years)
Figure 4. Trend of Oil Palm Yield in Peninsular Malaysia from 1975 to 2020. Source: Author’s anal-
ysis
The yield of oil palm fluctuated from 1975 to 1983. Yield in 1983 was about 17.45
tonnes per hectare and sharply increased to 21.80 and 22.15 in 1984 and 1986,
respectively, before drastically declining to 17.10 tonnes per hectare in 1987. The lowest
yields of oil palm recorded in the study area were in 1998 and 2016, while the highest
were recorded in 1993 and 2008 (Figure 4). The decline of FFB in 1998 and 2016 was the
result of a strong El-Nino. When El-Nino develops in the Pacific Ocean, rainfall in
Peninsular Malaysia decreases while air temperature rises, causing palm trees to
experience high levels of water stress. Because of this, the annual production of FFB is
less than in a normal year, as a result of water stress during the southwest monsoon
having a significant effect on annual FFB yields [10]. La-Nina, in contrast, creates a
favourable setting for palm trees and higher FFB production by lowering the risk of
water stress [10,55]. Generally, the trend in oil palm yield in the study area is increasing
with a positive Y value of 0.2581 (Figure 4).
The Relationship between Rainfall, Temperature and Oil Palm Yield
Multiple regression model
Table 2. The relationship between rainfall, temperature and oil palm yield
Regression Statistics
Multiple R 0.381065
R Square 0.14521
Adjusted R Square 0.079457
Standard Error 15028.72
Observations 29
Source: Author’s Computation, 2021
Table 2 indicate that there is a significant association between the weather
element (rainfall and temperature) and oil palm yield in Peninsular Malaysia. This is
shown with an R-value of 0.381, which is greater than the significant level of 0.05.
However, it has a R-square value of 0.145 that depicts the level of relationship. ThisPreprints (www.preprints.org) | NOT PEER-REVIEWED | Posted: 17 June 2021 doi:10.20944/preprints202106.0456.v1
9 of 17
simply means that among the factors that affect oil palm yield, rainfall and temperature
accounts for 14%. Other climatic elements, topographic and sociocultural practices
account for the remaining 86% percentage. These may include relative humidity, wind,
sunshine, soil fertility and gradient, nature of tillage and fertiliser application, among
others. This agrees with the study of [56] in Peninsular Malaysia which confirmed that
rainfall at 18 months before harvesting showed a significant relationship with oil palm
yield. This is because high rainfall is related to the development of female inflorescence
and results in bumper harvests of FFB. Moisture stress is known to cause fewer female
flowers, which also reduces FFB formation.
Multiple Regression Line Fit Plot
Mean Temp. (yearly) Line Fit Plot
250000
Value (oil Palm Yield)
200000
150000 Value (oil Palm Yield)
100000
50000 Predicted Value (oil Palm
0 Yield)
0 10 20 30 40
Mean Temp. (yearly)
Figure 5. Average annual temperature-line fit plot. Source: Author’s computation 2021
The relationship between temperature and oil palm yield indicates that as the
temperature increases within a certain limit, the oil palm yield is predicted to increase
(Figure 5). This seems to be due to the fact that the temperature requirements for oil
palm are straightforward. The best temperatures are those with the fewest fluctuations.
Growth is halted below 18°C. The ideal daily temperature is 27–28°C, with average
monthly values ranging from 30–32°C to 21–24°C. The average minimum temperature
during the coolest month should be greater than 18°C. Growth of seedlings is halted at
temperatures below 15°C, although temperatures between 28–32℃ favour stem growth,
FFB ripening, flower development, frond development and enhance the rate of
metabolic activities [20,57]. Oil palm produces the highest yields in areas with a
maximum average temperature of 29–33°C and a minimum average temperature of 22–
24°C [30].Preprints (www.preprints.org) | NOT PEER-REVIEWED | Posted: 17 June 2021 doi:10.20944/preprints202106.0456.v1
10 of 17
Mean Rainfall Line Fit Plot
300000 R² = 0.0009
Value (oil Palm Yield)
Value (oil Palm Yield)
200000
100000 Predicted Value (oil
Palm Yield)
0
0 100 200 300 400 Linear (Value (oil Palm
Yield))
Mean rainfall
Figure 6. Average Annual Rainfall (mm) Line Fit Plot. Source: Author’s computation (2021).
The relationship of oil palm yields as predicted in the model shows that as
rainfall increases, the oil palm yield will increase but at a slow rate of 0.0009 (Figure 6).
This is due to the fact that oil palm needs a rainfall of 150 mm per month, and a dry
season of not more than 2–3 months. On average, 1,800–2,500 mm of annual rainfall is
considered ideal for oil palm production in Malaysia. Annual rainfall exceeding 2,500
mm is deemed unfavourable because it disrupts solar radiation and affects the rate of
photosynthesis in the palm trees. It has been observed that 2,000 mm of rain per year
produces high FFB yields in western Malaysia.
Test of Goodness of Fit of the Data
Table 3. Analysis of Variance
Df SS MS F Significance F
Regression 2 9.98E+08 4.99E 2.208422 0.130068
Residual 26 5.87E+09 2.26E
Total 28 6.87E+09
Source: Author’s computation (2021).
The analysis of variance was employed to test the statistical significance of
rainfall and temperature as indicators for oil palm yield. There is a significant variation
in the effect of the independent variables (rainfall and temperature) on the dependent
variable (oil palm yield). This means one of the independent variables has a stronger
relationship than the other. This was validated by the F-statistics (2.21) being greater
than the p-value (0.13) (Table 3).
Regression coefficients
The regression coefficient shows the relationship in the multiple regression
model between each independent variable (rainfall and temperature) and dependent
variable (oil palm yield).
Table 5. Regression Coefficients
Coefficients Standard Error t Stat P-value Lower 95% Upper 95%
Intercept 37399.24 66548.02 0.561989 0.578937 -99392.2 174190.7
Mean rainfall 41.18689 54.3635 0.75762 0.455491 -70.5589 152.9327
Mean Temp.
(yearly) 4932.127 2354.218 2.095017 0.046059 92.96203 9771.292
Source: Author’s computation (2021)Preprints (www.preprints.org) | NOT PEER-REVIEWED | Posted: 17 June 2021 doi:10.20944/preprints202106.0456.v1
11 of 17
Table 5 shows that mean rainfall has a relationship with oil palm yield with an R-
value of 41.1. This is statistically significant as the p-value (0.455) is higher than 0.05
(significant level). This is not the case for mean temperature, which has an R-value of
4932.13 and a p-value (0.046) that is less than the 0.05 significant level. This simply
means that rainfall has a positive correlation with oil palm yield while temperature has
no relationship.
3,000,000 25
Planted Area Yield tonne/hectare
Production Area (ha)
2,500,000
20
Yield tonne/hectare
2,000,000
15
1,500,000
10
1,000,000
500,000 5
0 0
1975
1977
1979
1981
1983
1985
1987
1989
1991
1993
1995
1997
1999
2001
2003
2005
2007
2009
2011
2013
2015
2017
2019
Years
Figure 7. Production area and oil palm yield. Trend of oil palm production and its area
Since 1960, land area cultivated with oil palm has grown rapidly. In Peninsular
Malaysia for instance, 568,561 hectares (ha) were cultivated in 1975. In 1985, 1,292,399
ha of palm trees had been planted, and this figure had risen to 2,362,057 ha in 2007. Oil
palm has grown to be the leading agricultural commodity in the country. As of 2019,
the total planted area was 2,769,003 hectares and slightly declined to 2,700,004 hectares
which is attributed to the Covid-19 pandemic (MPOB, 2019) (Figure 7). Cultivation of
oil palm vital to Malaysia’s economic health, being the second largest exporter of palm
oil globally [4,5,11,16,27,35,58,59]. The palm oil sector employs a huge workforce, with
a combined employee number of 1.16 million individuals in Malaysia, accounting for
40.45% of agricultural employment [35].
In 1975, a yield of 17.95 tonnes per hectare was recorded in Peninsular Malaysia. The
trend of FFB per hectare continues to fluctuate as a result of climatic variability and
management practices. The highest yields were recorded in 1984, 1985 and 1986 (Figure
7). However, 15.98 and 15.91 tonnes per hectare were recorded in 1998 and 2016,
respectively. These were the result of a strong El-Nino which caused water stress and
rising temperatures, thereby a decline in FFB yield. Similarly, yields of 17.16 and 17.17
tonnes per hectare were recorded in 2018 and 2019. This is attributed to the decline in
rainfall where 213.71 mm and 156.3 mm of rainfall were recorded in 2018 and 2019,
respectively.Preprints (www.preprints.org) | NOT PEER-REVIEWED | Posted: 17 June 2021 doi:10.20944/preprints202106.0456.v1
12 of 17
25 Yield tonne/hectare 5
Crude palm oil_tonne/hectare 4.5
20 4
Yield (FFB) t/ha
Crude Palm Oil (t/ha)
3.5
15 3
2.5
10 2
1.5
5 1
0.5
0 0
1975
1977
1979
1981
1983
1985
1987
1989
1991
1993
1995
1997
1999
2001
2003
2005
2007
2009
2011
2013
2015
2017
2019
Time (Years)
Figure 8. Trend of FFB and Crude Palm Oil Production in Peninsular Malaysia.
The production of crude palm oil (CPO) depends on the quality and quantity of
FFB along with industrial processes. For instance, 1984 and 1986 recorded the highest
FFB yields at 21.80 and 22.15 tonnes per hectare, respectively. Similarly, CPO
production was highest in 1984 and 1986 with 4.25 and 4.41 tonnes per hectare,
respectively (Figure 8). The effect of 1998’s El-Nino resulted in a decline in FFB yield
which also influenced CPO production negatively. FFB production stood at 15.98
tonnes per hectare and CPO production was 3.03 tonnes per hectare in 1998. However,
both FFB and CPO production declined to 15.91 tonnes per hectare and 3.21 tonnes per
hectare in 2016 (figure 8). This was caused by a strong El-Nino that occurred in
2015/2016. El Nino events in the Pacific Ocean can cause decreased rainfall and
increased air temperatures across Malaysia. These changes have the potential to cause
severe water stress to the palm trees. In Peninsular Malaysia, CPO production has a
distinct annual rhythm, with minimal output usually around January to the month of
March and maximum production occurring around the month of August and
November. The rhythm is thought to be influenced by photoperiodic responses within
a phytomere and is also driven by variations in the environmental factors caused
mainly by El-Nino-Southern Oscillation (ENSO) [20]. The decline in CPO production
in 2018 was the result of lower quantity of processed FFB. The decline was by 3.2% to
97.80 million tonnes as a result of the lower FFB productivity i.e. decreased by 4.1% to
17.16 tonnes per ha in Malaysia as opposed to 17.89 tonnes per ha in 2017. Low demand
from palm oil importing countries, especially Vietnam, Egypt, and the EU, diminished
palm oil consumption in 2018 by 0.07 million tonnes, or 0.4 percent, to 16.49 million
tonnes, down from 16.56 million tonnes in 2017 [60].
Malaysia accounts for over 25.8% of global palm oil production and is responsible
for 34.3% of the global export of palm oil [61]. Malaysia is now the number two
producer of palm oil globally, having been surpassed by Indonesia in 2006. Since 1985,
palm oil has surpassed soyabean oil to become the second most consumed oil in the
world. Malaysia had a 51% share of global production in 1999, but that had dropped to
38% in 2011 [61].
4. CONCLUSION
Oil palm production is affected by some elements of weather and climate
especially temperature and rainfall. This study shows a significant increasing trend
in rainfall, temperature and oil palm yield in Malaysia from 1991 to 2020 at a 95%
confidence level. This finding is in line with the findings by other researchers. The
study also shows that rainfall and temperature have a significant relationship with
oil palm yield though at a very low rate of 14%. Future research will most likelyPreprints (www.preprints.org) | NOT PEER-REVIEWED | Posted: 17 June 2021 doi:10.20944/preprints202106.0456.v1
13 of 17
include the delineation of climatic regions using statistical analysis of Malaysia's
monthly gridded data set using rainfall variability and temperature indices. It will
be useful to further explore the relationship between oil palm yield and other
climatic and cultural factors aside from rainfall and temperature. This will give the
oil palm farmers insight into the agricultural practices suitable for oil palm
production.
Declaration
Ethics approval and consent to participate
This study neither involved human/animal participation, experiment, nor human
data/tissue.
Consent for publication
This study did not involve children or individual details, but 100% data usage.
Data availability statement
All data generated or analysed during the study are included in the published article(s)
cited within the text and acknowledged in the reference section.
Competing interest
All authors declare no competing interest.
Funding
The study was funded by the Tertiary Education Trust Fund, Nigeria (TETFUND).
Contribution of authors
Ahmed Abubakar is the corresponding author. He contributed in the sourcing of
relevant literature, as well as synthesis, organisation, and drafting of the manuscript.
Dr Mohd Yusoff Ishak, Assoc. Md Kamal Uddin and Assoc. Prof. Mohd Yusoff Abd
Samad critically reviewed the manuscript with addition and subtraction where
necessary within the manuscript.
Mr. Suleiman Mukhtar and Samir Shehu Danhassan contributed in referencing
formatting and similarity index checking.
Acknowledgment
I wish to acknowledge Tertiary Education Trust Fund (TETFUND) for sponsoring this
review research. I am indebted to Dr Mohd Yussof Ishak and Prof Abdullah Ahmad
Makmom for their critical review towards this work.
References
1. Dislich, C.; Keyel, A.C.; Salecker, J.; Kisel, Y.; Meyer, K.M.; Auliya, M.; Barnes, A.D.; Corre, M.D.; Darras, K.; Faust, H.; Hess, B.;
Klasen, S.; Knohl, A.; Kreft, H.; Meijide, A.; Nurdiansyah, F.; Otten, F.; Pe, G.; Steinebach, S., … Wiegand, K. A review of the
ecosystem functions in oil palm plantations, using forests as a reference system. Biol. Rev 2017, 49, 1539–1569,
https://doi.org/10.1111/brv.12295
2. Corley, R.H.V.;Tinker, P.B. The Oil Palm, 4th Ed.; Corley, R.H.V.; Tinker, P.B.; Eds.; Wiley-Blackwell, Hoboken, New Jersey
USA, 2003, pp. 1-562.
3. Nambiappan, B.; Ismail, A.; Hashim, N.; Ismail, N.; Shahari, D.N.; Idris, N.A.N.; Omar, N.; Salleh, K.M.; Hassan, N.A.M.;
Kushairi, A. Malaysia: 100 years of resilient palm oil economic performance. J. Oil Palm Res. 2018, 30, 13–25.
https://doi.org/10.21894/jopr.2018.0014
4. Ahmed, A.; Mohd, Y.B.I.; Abdullah, A.M. Oil palm in the face of climate change: A review of recommendations. IOP Conference
Series: Earth and Environmental Science, 2021 646, 1-10. https://doi.org/10.1088/1755-1315/646/1/012065
5. Paterson, R.R.M.; Sariah, M.; Lima, N. How will climate change affect oil palm fungal diseases? Crop Prot. 2013, 46, 113–120.
https:// doi.org/10.1016/j.cropro.2012.12.023Preprints (www.preprints.org) | NOT PEER-REVIEWED | Posted: 17 June 2021 doi:10.20944/preprints202106.0456.v1
14 of 17
6. Basiron, Y.; Weng, C.K. The oil palm and its sustainability. J. Oil Palm Res. 2004. 16, 1-10
7. Wahid, M.B.; Abdullah, S.N.A.; Henson, I.E. New directions for a diverse planet. Proceedings of the 4th International Crop
Science Congress, Brisbane, Australia. 26 Sep – 1 Oct 2004 Crop Science Society of America, Fitchburg, USA, 2004.
8. MPOB. Malaysian oil palm statistics 2019. 39th Ed.; Malaysian Palm Oil Board. Kajang, Selangor, Malaysia, 2019, pp. 2-205.
9. Basiron, Y. Palm oil production through sustainable plantations. Eur J Lipid Sci Technol. 2007, 109, 289–295.
https://doi.org/10.1002/ejlt.200600223
10. Oettli, P.; Behera, S.K.; Yamagata, T. Climate Based Predictability of Oil Palm Tree Yield in Malaysia. Sci. Rep. 2018, 8, 1–13.
https://doi.org/10.1038/s41598-018-20298-0
11. Zainal, Z.; Shamsudin, M.N.; Mohamed, Z.A.; Adam, S.U. Economic Impact of Climate Change on the Malaysian Palm Oil
Production. Trends Appl Sci Res, 2012 7, 872–880.
12. Fleiss, S.; Hill, J.K.; Mcclean, C.; Lucey, J.M.; Reynolds, G. Potential Impacts of Climate Change on Oil Palm Cultivation: A
science-for-policy. 2017, pp. 1-16. http://www.sensorproject.net/wp-content/uploads/2018/01/Climate-change-report-
FINAL.pdf. Accessed on 12/05/2021.
13. Bakoumé, C.; Shahbudin, N.; Yacob, S.; Siang, C.S.; Thambi, M.N. Improved method for estimating soil moisture deficit in oil
palm (Elaeis guineensis Jacq.) areas with limited climatic data, J. Agr. Sci. 2013, 5, 57–65, https://doi.org/10.5539/jas.v5n8p57.
14. Noojipady, P.; Morton, D.C.; Schroeder, W.; Carlson, K.M.; Huang, C.; Gibbs, H.K.; Burns, D.; Walker, N.F.; Prince, S.D. Man-
aging fire risk during drought: the influence of certification and El 14 Potential impacts of climate change on oil palm cultivation
Niño on fire-driven forest conversion for oil palm in Southeast Asia. Earth Syst. Dyn. 2017, 8, 1-23.
15. Christensen, J.H.; Krishna, K.; E. Aldrian, S.I.; Cavalcanti, I.F.A.; Castro, M.; Dong, W.; Goswami, P.; Hall, A.; Kanyanga, J.K.;
Kitoh, A.; Kossin, J.; Lau, N.C.; Renwick, J.; Stephenson, D.B.; Xie, S.P.; Zhou, T. Climate Phenomena and their Relevance for
Future Regional Climate Change. In: Climate Change: The Physical Science Basis. Contribution of Working Group I to the Fifth
Assessment Report of the Intergovernmental Panel on Climate Change Ed.; Stocker, T.F.; Qin, D.; Plattner, G.K.; Tignor, M.;
Allen, S.K.; Boschung, J.; Nauels, A.; Xia, Y.; Bex, V.; Midgley, P.M. 2013 Cambridge University Press, Cambridge, United King-
dom and New York, NY, USA. pp. 20-43
16. Paterson, R.R.M.; Lima, N. Climate change affecting oil palm agronomy, and oil palm cultivation increasing climate change,
require amelioration. Ecol. Evol, 2018, 8, 452–461. https://doi.org/10.1002/ece3.3610
17. Wen, P.P.; Sidik, M.J. Impacts of rainfall, temperature and recent El Niños on fisheries and agricultural products in the West
Coast of Sabah [2000-2010]. Borneo Sci. 2011, 28, 75-85
18. Li, Y.; Ye, W.; Wang, M.; Yan, X. Climate change and drought: a risk assessment of cropyield impacts. Clim. Res. 2009, 39, 31-46.
19. Chotamonsak, C.; Salathé, E.P.; Kreasuwan, J.; Chantara, S.; Siriwitayakorn, K. Projected climate change over Southeast Asia
simulated using a WRF regional climate model. Atmos. Sci. Lett, 2011, 12, 213-219
20. Tani et al. Small temperature variations are a key regulator of reproductive growth and assimilate storage in oil palm (Elaeis
guineensis), Sci. Rep. 2020, 10, 650. https://www.doi.org/10.1038/s41598-019-57170-8
21. Corley, R.H.V.; Rao, V.; Palat, T.; Praiwan, T. Breeding for drought tolerance in oil palm. J. Oil Palm Res. 2018, 30, 26-35.
https://www.doi.org/10.21894/jopr.2017.00011
22. Suharyanti, N.A., Mizuno, K., Sodri, A. The effect of water deficit on inflorescence period at palm oil productivity on peatland.
The 1st JESSD Symposium: International Symposium of Earth, Energy, Environmental Science and Sustainable Development,
Indonesia, 28 to 30 September, 2020, 17, Avenue du Hoggar, France, 2020
23. Caliman, J.P., Southworth, A. Effect of drought and haze on the performance of oil palm, International Oil Palm Conference,
Bali, Indonesia, 23-25 September 1998, PT Smart Corporation, Indonesia, 1998. pp. 1-20.
24. Corley, R.H.V. & Tinker, P.B.H. The Oil Palm. 5th Ed.; Corley, R.H.V.; Tinker, P.B.; Eds.; Wiley-Blackwell, Hoboken, New Jersey
USA, 2015, pp. 1-674Preprints (www.preprints.org) | NOT PEER-REVIEWED | Posted: 17 June 2021 doi:10.20944/preprints202106.0456.v1
15 of 17
25. Shanmuganathan, S.; Narayanan, A.; Mohamed, M.; Ibrahim, R; Khalid, H. A hybrid approach to modelling the climate
change effects on Malaysia’s oil palm yield at the regional scale. Adv Intell Syst Comput 2014, 287, 335–346.
26. Paterson, R.R.M.; Kumar, L.; Taylor, S.; Lima, N. Future climate effects on suitability for growth of oil palms in Malaysia and
Indonesia. Sci. Rep. 2015, 5, 1–11. https://doi.org/10.1038/srep14457
27. Paterson, R.R.M.; Kumar, L.; Shabani, F.; Lima, N. World climate suitability projections to 2050 and 2100 for growing oil palm.
J. Agric. Sci. 2017, 155, 659–702. https://doi.org/10.1017/S0021859616000605
28. Naylor, R.; Walter, P.F.; Daniel, R.; Wada, N. Using El-Nino/Southern Oscillation Climate Data to Predict Rice Production in
Indonesia. Clim. Change. 2001, 50, 255-265.
29. Wolter, K.; Timlin, M.S. El Niño/Southern Oscillation behaviour since 1871 as diagnosed in an extended multivariate ENSO
index (MEI.ext), Int. J. Climatol., 2011 31, 1074–1087, https://doi.org/10.1002/joc.2336.
30. Kamil, N.N.; Omar, S.F. Climate change variability and its impacts on the oil palm industry. Oil Palm Indust. Econ. J. 2016, 16,
18-30
31. Verheye W. Growth and production of oil palm. In: Verheye WH, editor. Land use, land cover and soil sciences. Oxford, UK:
UNESCO-EOLSS Publishers; 2010, 1-24
32. Ozor, N.; Umunakwe, P.C.; Ani, A.O.; Nnadi, F.N. Perceived Impacts of Climate Change Among Rural Farmers in Imo State,
Nigeria: Afr. J. Agric. Res. 2015, 10, 1756-1764.
33. Garba, J.I.; Sawa, B.A.; Shariason, A.A. Awareness of and Adaptation Strategies to Climate Changes Tudun Wada Local Gov-
ernment Area of Kano State; Zaria Geog. 2018, 23, 13 – 21
34. Shanmuganathan, S.; Narayanan, A. Modelling the climate change effects on Malaysia's oil palm yield. 2012 IEEE Symposium
on E-Learning, E-Management and E-Services, 2012, 1-6.
35. Sarkar, M.S.K.; Begum, R.A.; Pereira, J.J. Impacts of climate change on oil palm production in Malaysia. Environ. Sci. Pollut. Res.
2020, 27, 9760–9770. https://doi.org/10.1007/s11356-020-07601-1
36. UNISDR. Annual report. United Nations Office for Disaster Risk Reduction (UNISDR) 9-11 Rue de Varembé, 1202 Geneva,
Switzerland, 2015. pp. 3-10
37. Wong, C L.; Liew, J.; Yusop, Z.; Ismail, T.; Venneker, R.; Uhlenbrook, S. Rainfall characteristics and regionalization in peninsular
malaysia based on a high resolution gridded data set. Water, 2016, 8, 1-16. https://doi.org/10.3390/w8110500
38. Suhaila, J.; Sayang, M.D.; Wan Zawiah, W.Z.; Abdul Aziz, J. Trends in Peninsular Malaysia rainfall data during the Southwest
Monsoon and northeast monsoon seasons: 1975–2004. Sains Malays. 2010, 39, 533–542
39. Wong, C. Yusop, Z.; Ismail, T. Trend of Daily Rainfall and Temperature in Peninsular Malaysia Based on Gridded Data Set.
Int. J. GEOMATE. 2018, 14, 65-72
40. Tang, K.H.D. Climate change in Malaysia: Trends, contributors, impacts, mitigation and adaptations. Sci. Total Environ. 2019,
650, 1858–1871. https://doi.org/10.1016/j.scitotenv.2018.09.316
41. Zeke, H. Climate Modelling. Explainer: What climate models tell us about future rainfall? Available online: https://www.car-
bonbrief.org/explainer-what-climate-models-tell-us-about-future-rainfall. (Accessed on 27/04/2021).
42. Climate Central. Pouring it on: How Climate Change Intensifies Heavy Rain Events. Available on: https://www.climatecen-
tral.org/news/report-pouring-it-on-climate-change-intensifies-heavy-rain-events#:~:text=Human%2Dcaused%20cli-
mate%20change%20intensifies,hold%204%25%20more%20water%20vapor. (Accessed on 27/04/2021).Preprints (www.preprints.org) | NOT PEER-REVIEWED | Posted: 17 June 2021 doi:10.20944/preprints202106.0456.v1
16 of 17
43. Tukimat, N.N.; Harun, S. Technical note the Projection of Future Rainfall Change Over Kedah, Malaysia with the Statistical
Downscaling Model. Malay. J. Civil Engine. 2011, 23, 67-79. DOI:10.11113/MJCE.V23N2.269
44. Tangang, F. T. et al. Climate Change and Variability over Malaysia: Gaps in Science and Research Information. Sains Malays.
2012, 41, 1355–1366.
45. Mayowa, O.O.; Pour, S.H.; Shahid, S.; Mohsenipour, M.; Harun, S.B.; Heryansyah, A.; Ismail, T. Trends in rainfall and rainfall-
related extremes in the east coast of peninsular Malaysia. J. Earth Syst. Sci. 2015, 124, 1609–1622. https://doi.org/10.1007/s12040-
015-0639-9
46. Loh, J.L.; Tangang, F.; Juneng, L. et al.. Projected rainfall and temperature changes over Malaysia at the end of the 21st century
based on PRECIS modelling system. Asia-Pacific J Atmos Sci. 2016, 52, 191–208. https://doi.org/10.1007/s13143-016-0019-7
47. Syafrina, A.H.; Zalina, M.D.; Juneng, L. Historical trend of hourly extreme rainfall in peninsular Malaysia. Theor. Appl. Climatol.
2015, 120: 259-285. DOI: 10.1007/s00704-014-1145-8
48. Hassan, M.A.; Ahmad Farid, M.A.; Shirai, Y.; Ariffin, H.; Othman, M. R.; Samsudin, M.H.; Hasan, M. Y. Oil Palm Biomass
Biorefinery for Sustainable Production of Renewable Materials. Biotechnol. J. 2019, 14, 1800394.
https://doi.org/10.1002/biot.201800394
49. Khan, N.; Pour, S.H.; Shahid, S.; Ismail, T.; Ahmed, K.; Chung, E.S.; Nawaz, N.; Wang, X. Spatial distribution of secular trends
in rainfall indices of Peninsular Malaysia in the presence of long-term persistence. Meteorol. Appl. 2019, 26, 655–670.
https://doi.org/10.1002/met.1792
50. Sa’adi, Z.; Shahid, S.; Ismail, T.; Chung, E.S.; Wang, X. J. Trends analysis of rainfall and rainfall extremes in Sarawak, Malaysia
using modified Mann–Kendall test. Meteorol. Atmospheric Phys. 2019, 131, 263–277. https://doi.org/10.1007/s00703-017-0564-3
51. Ridwan, W. M., Sapitang, M., Aziz, A., Kushiar, K. F., Ahmed, A. N., & El-Shafie, A. Rainfall forecasting model using machine
learning methods: Case study Terengganu, Malaysia. Ain Shams Eng. J. 2020, 12, 1651-1663.
https://doi.org/10.1016/j.asej.2020.09.011
52. Saimi, F. M.; Hamzah, F. M.; Toriman, M.; E.; Jaafar, O.; Tajudin, H. Trend and linearity analysis of meteorological parameters
in peninsular Malaysia. Sustainability. 2020, 12, 1–19. https://doi.org/10.3390/su12229533
53. IPCC. Climate Change 2007: The Physical Science Basis. Contribution of Working Group I to the Fourth Assessment Report of
the Intergovernmental Panel on Climate Change [Solomon, S.; Qin, D.; Manning, M.; Chen, Z.; Marquis, M.; Averyt, K.B.; Tignor
M.; Miller, H. Ed.; Cambridge University Press, Cambridge, United Kingdom and New York, NY, USA, 2007. pp. 1-996
54. Easterling, W.E.; Crosson, P.R.; Roseberg, N.J.; Mckenney M.S.; Katz, L.A.; Lemon, K.M. Agricultural impacts of and responses
to climate change in the Missouri-Iowa-Nebraska-Kansas (MINK) region. Clim. Change. 1993, 24, 23–61, 24.
55. Chizari, A.; Zainalabidin, M.; Mad Nasir, S.; Kelly, W.; Kai, S. et al. The Effects of Climate Change Phenomena on Cocoa Pro-
duction in Malaysia. Int. j. environ. 2017, 2, 2599-2604
56. Rizal M.A.R.; Tsan, F.Y. Rainfall impact on oil palm production in Malaysia. J. Appl. Hortic. 2008, 18, 12 – 19
57. Legros, S.; Mialet-Serra, I.; Caliman, J.P.; Siregar, F.A.; Clément-Vidal, A.; Dingkuhn, M. Phenology and growth adjustments of
oil palm (Elaeis guineensis) to photoperiod and climate variability. Ann. Bot., 2009, 104, 1171–1182.
https://doi.org/10.1093/aob/mcp214
58. Paterson, R.R.M. Oil palm survival under climate change in Malaysia with future basal stem rot assessments. For. Pathol. 2020
50, 1–8. https://doi.org/10.1111/efp.12641
59. Paterson, R.R.M. Future scenarios for oil palm mortality and infection by Phytophthora palmivora in Colombia, Ecuador and
Brazil, extrapolated to Malaysia and Indonesia. Phytoparasitica, 2020a 48, 513–523. https://doi.org/10.1007/s12600-020-00815-6Preprints (www.preprints.org) | NOT PEER-REVIEWED | Posted: 17 June 2021 doi:10.20944/preprints202106.0456.v1
17 of 17
60. Kushairi, A.; Loh, S.K.; Azman, I.; Hishamuddin, E.; Ong-Abdullah, M.; Izuddin, Z.B.M.N.; … Parveez, G.K.A. Oil palm eco-
nomic performance in Malaysia and R&D progress in 2017. J. Oil Palm Res. 2018, 30, 163–195.
https://doi.org/10.21894/jopr.2018.0030
61. MPOC. Malaysia palm oil industry. Available online: http://mpoc.org.my/malaysian-palm-oil-indus-
try/#:~:text=In%202020%2C%20Malaysia%20accounted%20for,fats%20in%20the%20same%20year. (Accessed on 04/05/2021)You can also read


