Reptile species richness associated to ecological and historical variables in Iran - DORA 4RI
←
→
Page content transcription
If your browser does not render page correctly, please read the page content below
www.nature.com/scientificreports
OPEN Reptile species richness associated
to ecological and historical
variables in Iran
Anooshe Kafash1,2,3, Sohrab Ashrafi1,4*, Masoud Yousefi1,4, Eskandar Rastegar‑Pouyani5,
Mahdi Rajabizadeh6, Faraham Ahmadzadeh7, Marc Grünig2,3 & Loïc Pellissier2,3
Spatial gradients of species richness can be shaped by the interplay between historical and ecological
factors. They might interact in particularly complex ways in heterogeneous mountainous landscapes
with strong climatic and geological contrasts. We mapped the distribution of 171 lizard species to
investigate species richness patterns for all species (171), diurnal species (101), and nocturnal species
(70) separately. We related species richness with the historical (past climate change, mountain
uplifting) and ecological variables (climate, topography and vegetation). We found that assemblages
in the Western Zagros Mountains, north eastern and north western parts of Central Iranian Plateau
have the highest number of lizard species. Among the investigated variables, annual mean
temperature explained the largest variance for all species (10%) and nocturnal species (31%). For
diurnal species, temperature change velocity shows strongest explained variance in observed richness
pattern (26%). Together, our results reveal that areas with annual temperature of 15–20 °C, which
receive 400–600 mm precipitation and experienced moderate level of climate change since the Last
Glacial Maximum (LGM) have highest number of species. Documented patterns of our study provide a
baseline for understanding the potential effect of ongoing climate change on lizard diversity in Iran.
Exploring historical and current drivers of species richness can inform on how those gradients might be reshaped
in the f uture1–3. Present environmental variables including climate, habitat heterogeneity, productivity represent
important drivers of species distribution and d iversity4–7. Diversity of present assemblages is not always in equi-
librium with current climate. Thus, past climate changes may better reflect species richness2 or global endemism
than current c limate8,9. Beyond the Quaternary, mountain uplifting might also be associated to the formation of
biodiversity gradients, shaping an association between habitat heterogeneity and species r ichness10,11. Together,
it appears there is no single driver of species distribution across broad geographical range and species distribu-
tional patterns are shaped by the interplay between different historical and ecological f actors2,3,11–13. The interplay
between contemporary and historical variables in shaping biodiversity might vary between ecosystems types,
biogeographic regions and taxonomic g roups2,3,11,13.
With ca. 10,970 known species, reptiles are a highly diverse group of vertebrates14, but they are generally less
studied compared to other vertebrate groups such as birds and mammals5,15,16. Reptiles are characterized by low
dispersal ability and narrow ecological n iches17. Thus, they are suitable biological models to assess the role of
historical factors in shaping spatial distribution of b iodiversity18,19. Global coarse scale distribution maps indi-
cate that reptile richness is highest in pantropical including Central America, South America, south of Africa,
Southeast Asia and A ustralia20. But some regions are less known than others, and lack high resolution distribu-
tion information. However, lizard richness is somehow different from reptile as their numbers are found to be
maximum in both tropical and arid regions and reach a peak in A ustralia20. In particular, the highest proportions
of threatened and Data Deficient21 reptiles are occurring in tropical areas20. Agriculture, biological resource use
and urban development are the most important threats to reptile worldwide20.
Climate and topography are introduced as the most important contemporary determinants of reptile rich-
ness at global and regional scales22–25. In fact, reptile richness is highest in areas which characterized with high
1
Department of Environmental Sciences, Faculty of Natural Resources, University of Tehran, Karaj, Iran. 2Institute
of Terrestrial Ecosystems, ETH Zurich, Zurich, Switzerland. 3Swiss Federal Institute for Forest, Snow and Landscape
Research (WSL), Birmensdorf, Switzerland. 4Ecology and Conservation Research Group (ECRG), Department of
Environmental Sciences, Faculty of Natural Resources, University of Tehran, Karaj, Iran. 5Department of Biology,
Faculty of Science, Hakim Sabzevari University, Sabzevar, Iran. 6Department of Computer Science, Tarbiat
Modares University, Tehran, Iran. 7Department of Biodiversity and Ecosystem Management, Environmental
Sciences Research Institute, Shahid Beheshti University, Tehran, Iran. *email: sohrab.ashrafi@ut.ac.ir
Scientific Reports | (2020) 10:18167 | https://doi.org/10.1038/s41598-020-74867-3 1
Vol.:(0123456789)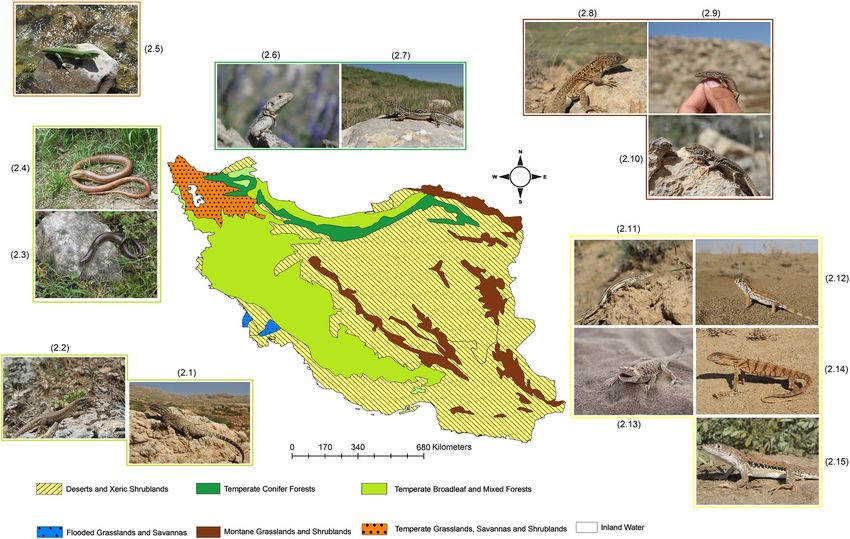
www.nature.com/scientificreports/
temperature and high topographic heterogeneity22–25. But the variables associated with the richness of reptile
at regional scale in subtropical and desert areas were less investigated. While, reptiles have previously been the
targets of richness m apping22,26–28, the influence of historical processes on their richness in southwest Asia was
rarely quantified29–31. Among the historical factors, the influence of Quaternary climatic oscillations and moun-
tains uplifting was observed on individual species, using genetic data and species distribution m odelling32–37.
Iran is one of the biologically diverse countries in southwest Asia38, it is home to ca. 241 reptile species, of
which ca. 71 are endemic to the c ountry39. The country is a suitable place to test the effects of historical events on
distribution of biodiversity. Iran’s current topography was shaped by uplifting of the different mountain ranges,
which facilitated species diversification by providing new unoccupied niches34,35,37,40. The country also experi-
enced several glacial p eriods41, which influenced reptile distribution36,42,43. Despite the fact that natural history
studies have been initiated over 300 years ago in I ran38, the distribution and ecology of many species occupying
that region remain poorly k nown38,44,45. Recent discoveries of novel lizards and snakes in Iran suggest that the
biodiversity of Iran is still poorly explored and should receive further a ttention46,47. Distributions of some species
like Heremites vittatus, Saara loricate and Phrynocephalus scutellatus were mapped using species distribution
modeling45,48,49. Based on these studies, climate was the most important determinant of reptile distribution
in Iran. Climate was also identified as a most influential variable in shaping reptile richness in the country30.
However, there is a knowledge gap in the ecology and distribution of lizard species in Iran44,45,49. In this study,
we mapped the species distribution of all lizards in Iran and quantified reptile richness. We associated species
richness to ecological drivers of reptile distributions in Iran30, but considered in addition Quaternary climatic
oscillations and mountains uplifting events. We had the following expectations:
1. The age of mountain uplifting have shaped topography as well as Quaternary glaciation should be associated
to the present diversity of lizard species in Iran.
2. Among the ecological factors climatic variables are more influential in shaping lizard richness patterns.
3. Because nocturnal and diurnal species have different natural history, their richness is expected to be shaped
by different historical and ecological variables.
Results
Species richness patterns. The 171 lizard species belonged to ten families and 47 genera. Family Gek-
konidae and genus Eremias were most divers family and genus in Iran with 51 and 20 species respectively. Of
171 recognized lizard species in Iran 101 species (59.06%) were diurnal, 70 species nocturnal (40.93%) and 62
species endemic (36.25%).
The mapping of the distribution of 171 lizard species showed that Western Zagros Mountains with 37 spe-
cies, north western parts of Central Iranian Plateau with 30 species and north eastern parts with 28 species have
the highest lizard richness in Iran (Fig. 1a). In contrast, northern parts of the country, Kopet-Dagh Mountains
and Elburz Mountains with 2–14 species have relatively lower number of species. For diurnal species, Zagros
Mountains with 22 species, north eastern and north western parts of Central Iranian Plateau with 23 species show
the highest number of species (Fig. 1b). Nocturnal species hotspots occur in Western Zagros Mountains with 17
species, north of Persian Gulf and Oman Sea with 13 species, while we found that central parts of Iran with 1–6
species, Kopet-Dagh Mountains and Elburz Mountains with 0–4 species have much lower number of nocturnal
species across the country (Fig. 1c). Results showed that hotspots of all lizards contain 37 species, diurnal lizard
23 and nocturnal lizards 17 species. Lut Desert contains lowest number of species for the three groups.
Drivers of lizard richness in Iran. We found that all historical and ecological variables are significantly
correlated with lizard richness (Table 1). We determined which variable explained highest proportion of vari-
ance among ecological and historical variable. Results showed that annual mean temperature explained largest
variance for all species (10%) and nocturnal species (31%). For diurnal species, velocity of temperature shows
strongest effect in explaining variance in observed richness pattern (26%). The distribution of lizard richness has
a positive relationship with annual mean temperature and the number of species increases with higher mean
temperatures for the three groups (all species, diurnal and nocturnal). Topographic heterogeneity is positively
correlated with lizard species richness but NDVI was negatively correlated with richness for the three groups.
Richness is negatively correlated with precipitation for the three groups. Temperature change velocity is posi-
tively associated with higher number of species for all lizards, diurnal and nocturnal lizards and maximum num-
ber of species occur in areas with moderate level of temperature change velocity.
Discussion
We mapped the richness of all recognized lizard species in Iran, using distribution data of 171 lizard species and
documented pronounced gradients of species richness, which were different between nocturnal and diurnal
species. The Western Zagros Mountains, north eastern and north western parts of Central Iranian Plateau have
the highest number of species, with a peak specifically in the Zagros Mountains.
Climatic variables were identified as the important drivers of reptile distribution around the g lobe5,22. Our
results supported previous effects of climate and showed that temperature was the best explaining variable for
richness of all and nocturnal species, while temperature change velocity explained highest fraction of variation
in diurnal species richness. Hosseinzadeh, et al.30 also showed that temperature is the most important predictor
of reptile distribution in Iran. A positive association was frequently reported for reptile richness and temperature
around the world50. Body temperature, which is the most important ecophysiological variable affecting the per-
formance of reptiles, is regulated by ambient energy input51. Annual mean temperature is an indicator of ambient
energy input52 and it is often used as a measure of environmental energy53. Thus, areas with higher temperature
Scientific Reports | (2020) 10:18167 | https://doi.org/10.1038/s41598-020-74867-3 2
Vol:.(1234567890)
www.nature.com/scientificreports/
Figure 1. Richness map of all (a) diurnal (b) and nocturnal (c) lizards in Iran. All species richness range from
0 to 37, diurnal from 0 to 23 and nocturnal from 0 to 17. Maps were generated using QGIS 3.4.1 (https://www.
qgis.org).
and consequently higher ambient energy can support more species52,53. This is why a positive association was
found between lizard richness and temperature in all three groups. In agreement with our expectations, noc-
turnal and diurnal lizard richness was shaped by different contemporary and historical variables. Moreover, we
found that areas which receive less precipitation have more lizard species, while in other group of reptiles, such
Scientific Reports | (2020) 10:18167 | https://doi.org/10.1038/s41598-020-74867-3 3
Vol.:(0123456789)www.nature.com/scientificreports/
Group Predictor Slope (linear) z value AIC D2 Predictor Slope (quadratic) z value AIC D2
All species
Intercept 2.21E+00 75.74*** Intercept 2.796446 585.197***
Temperature 1.34E−03 27.795*** 18,740 0.0494 Temperature − 8.5712 − 18.493*** 16,830 0.1055
Temperature velocity 1.24E−03 8.614*** 18,760 0.0457 Precipitation − 2.14503 − 7.236*** 18,370 0.0253
Precipitation − 1.59E−03 − 14.073*** 18,910 0.0224 Temperature velocity − 1.7505 − 3.887*** 18,630 0.0654
Topo-heterogeneity 5.71E−03 1.961* 18,940 0.0177 NDVI − 0.98842 − 3.883*** 18,700 0.0559
Precipitation velocity 4.67E−04 5.635*** 19,050 0.0014 Precipitation velocity 0.174253 0.581 18,830 0.0355
NDVI − 1.22E+00 − 21.612*** 19,060 0.0002 Topo-heterogeneity 0.958962 3.633*** 18,880 0.0274
Geo 5.40E−10 1.931 19,060 0 Geo 2.833519 9.111*** 19,060 0
Full model – – 17,680 0.213 Full model – – 16,830 0.3437
Diurnal
Intercept 2.36E+00 71.152*** Intercept 2.409271 444.02***
Temperature velocity 2.01E−03 16.463*** 18,060 0.1243 Temperature velocity − 9.40342 − 16.718*** 17,220 0.2685
Temperature 1.11E−03 21.284*** 18,080 0.1079 NDVI − 0.30654 − 0.612 17,750 0.1715
Precipitation velocity 1.36E−03 14.359*** 18,300 0.0704 Temperature − 3.00657 − 8.113*** 18,020 0.122
Precipitation − 1.37E−03 − 7.857*** 18,400 0.0526 Precipitation velocity − 0.21334 − 0.573 18,220 0.0846
NDVI − 8.31E−01 − 13.794*** 18,460 0.041 Precipitation − 1.23191 − 4.006*** 18,320 0.0656
Topo-heterogeneity 3.58E−02 10.995*** 18,630 0.0092 Topo-heterogeneity − 0.40011 − 1.257 18,630 0.009
Geo 1.04E−09 3.25** 18,680 0 Geo 3.325387 8.851*** 18,680 0.0009
Full model – – 17,240 0.2658 Full model 16,600 0.5221
Nocturnal
Intercept − 9.98E−02 − 1.919*** Intercept 1.42242 137.94***
Temperature 8.63E−03 45.972*** 16,750 0.292 Temperature − 7.34695 − 11.508*** 16,530 0.3135
NDVI − 3.13E+00 − 25.14*** 18,830 0.0845 Precipitation velocity − 16.5552 − 20.062*** 17,910 0.1759
Topo-heterogeneity 7.43E−02 15.469*** 19,440 0.0245 NDVI − 11.7424 − 10.3*** 18,680 0.1
Precipitation velocity − 1.99E−03 − 12.669*** 19,550 0.013 Topo-heterogeneity − 0.04915 − 0.104 19,370 0.0314
Geo 3.38E−09 7.673*** 19,640 0.004 Temperature velocity − 2.05889 − 4.303*** 19,610 0.0072
Precipitation − 2.06E−03 − 24.405*** 19,670 0.0011 Geo 0.45501 0.803 19,620 0.0067
Temperature velocity 1.57E−03 5.727*** 19,670 0.0016 Precipitation − 5.05909 − 5.223*** 19,660 0.0023
Full model – – 14,930 0.4726 Full model – – 13,590 0.6062
Table 1. Results of generalized linear model with quasi-Poisson distribution. The table shows linear and
quadratic estimates, associated z‐ values with p‐values (asterisks), the Akaike information criterion values
(AIC) and explained deviance (D2) of variables. The AIC values and the explained deviance were estimated
for each predictor separately and in combination for full model. The most important variables for all lizards,
diurnal lizards and nocturnal lizards were indicated in bold. Significance codes: 0 ‘***’ 0.001 ‘**’ 0.01 ‘*’ 0.05.
as turtles, richness may show the opposite response and increase with precipitation54,55. Nocturnal lizards are
richest in the tropics and deserts, and their richness decreases with l atitude56. Nocturnal lizards, especially those
of the families Gekkonidae, Sphaerodactylidae and Phyllodactylidae are more divers in the south of Iran than the
rest of the country38,39. Annual mean temperature is increased toward southern Iran, that could be linked to the
increased diversity of nocturnal lizards. In warm environments, the hot days increases the cost of diurnal activity,
whereas nocturnal activity provides a shelter from these extreme conditions, for e.g. feeding and reproduction.
Quaternary climatic change was associated with distribution biodiversity in high latitude57. Our results show
that past climate change also played important role in shaping biodiversity distribution in lower latitude as well.
During the ice ages, mountains of Iran were covered by snow and ice line and snow line was much lower than
what we see today41. So reptiles of Iran have undergone several cycles of range expansion–contraction due to the
climate fluctuations which in turn shaped their current distribution36,42,43. We found that temperature change
velocity was the most important variable in explaining variation in diurnal species richness and the second most
important predictor of all lizard richness. Past climate change was not important in shaping nocturnal species
richness because their richness reach a peak at south of I ran38,39 which was not influenced by past climatic
changes41.
Our results agree with previous studies, which have shown that past climate is a major determinant of reptile
richness13,31. For example, Araújo, et al.13 showed that past climate played an important role in shaping large-scale
species richness patterns of reptiles and amphibians across Europe. In another study Ficetola et al. 31 quantified
the importance of past climate on reptiles of the Western Palearctic. In both studies, reptile richness and end-
emism were highest in areas with high climate stability, low climate change velocity. Our findings showed that
lizard richness was positively associated with temperature change velocity, areas with moderate climate change
velocity were correlated with maximum number of species. Our finding is in line with previous studies which
highlighted the role of Quaternary climatic oscillations on Iran’s biodiversity using genetic data and species
distribution modeling34,42,43. Zagros Mountains which contain highest number of species was a refugium for
Scientific Reports | (2020) 10:18167 | https://doi.org/10.1038/s41598-020-74867-3 4
Vol:.(1234567890)www.nature.com/scientificreports/
several taxonomic groups during past climatic oscillations including reptiles34,42,43,58, amphibians59,60 birds61,62,
and mammals63–65.
As pointed by Wines and Graham66, there might be strong correlation between species richness and some
environmental variables but environmental variables (in our case temperature) cannot change the number
of species in particular r egion66. Species richness pattern linked to processes like speciation, dispersal and
extinction66,67. Zagros uplifting caused speciation by splitting populations of species and by providing unoccupied
niches for species of the genus Eremias, Mesalina, Timon and Sarra32,35,38,68. Climatic changes also strongly influ-
enced lizard distribution pattern and played important role in their isolations and dispersal in Zagros region34,69.
There are some sky island species which remained in climatic refugia in Zagros Mountains like Iranolacerta
brandtii and Iranolacerta zagrosica during past climatic oscillations34. In addition, Zagros acted as dispersal bar-
rier and known as dispersal corridor for different species of l izards38,69,70. According to our knowledge, there is
not any specific driver of extinction of lizard in the area. Thus, among the three main processes which are linked
to species richness in each region, speciation and dispersal due to Zagros uplifting and past climatic fluctuations,
are the main drivers of lizard richness patterns (high richness in Zagros region).
In this study, Zagros Mountains were identified as hotspot of lizard richness in Iran. This region was also iden-
tified as hotspot of biodiversity for mammals and plants in the country7,71. Our analyses indicate that the Zagros
Mountains are a region of moderate climate stability and high topographic heterogeneity, providing a high
diversity of climatic niches. Furthermore, the Zagros Mountains are located in the Irano-Anatolian biodiversity
hotspot72, showing that there are local hotspots of biodiversity nested within regional biodiversity h otspots7.
Zagros Mountains were also identified as an endemism area for reptiles of the Western Palearctic31. Beside
reptiles, there are some high prioritized species for conservation such as the Luristan newt (Neurergus kaiseri),
which was ranked as 45th among the world’s 100 top priority amphibian species73. This combination of high
diversity and endemism makes Zagros Mountains a most valuable target for conservation of biodiversity in Iran.
Conclusion
Altogether, our results suggest that lizard richness can be explained by current and past climate in Iran. There
are studies which quantified the role of ecological factors on reptile richness in southwest Asia (for instance29–31),
while historical drivers of reptile richness remain poorly u nderstood31. For better understanding the drivers of
current species distribution, we need to look at past and investigate the role of historical factors on species distri-
bution. This study took in to account both historical and ecological factors effects on the distribution patterns of
171 lizard species in Iran. Our findings support the fact that there is no single driver for biodiversity distribution
and there is always a set of ecological and historical factors shaping species r ichness3,11,12,74. Since lizard richness
is strongly associated with climate we speculate that lizard diversity and distribution will be affected by future
climatic changes. Documented patterns of our study provide a baseline for understanding the potential effect of
ongoing climate change on lizards in Iran.
Methods
Study area. Iran covers 164.8 million hectares, located in the Palearctic region at the crossroads of three
biogeographic realms; Afrotropic, Palearctic and Indomalaya. Iran hosts over ca. 8000 plant s pecies75,76 and more
than 1214 vertebrate species of which many are endemic to the c ountry38,39,71,77. The elevation ranges from − 26
to 5770 m and a large fraction of the country has an elevation above 1200 m. Iran’s current topography (Fig. 2)
was shaped mainly via tectonic activities of Arabia–Eurasia continent collision78. This collision generated in
around early Miocene, approximately 19 Mya79,80 and the last mass tectonic event in this zone occurred in late
Miocene and the beginning of the Pliocene, 5 Mya, when progressive anticlockwise rotation of the Arabian
Peninsula associated with the formation of the Red Sea and Gulf of A den81. The collision of Arabia – Eurasia
continents resulted in multi stage uplift of the Zagros Mountains, as well as the uplift of the whole plateau. The
Elburz Mountains in northern Iran are stretching from west to east at the southern coast of the Caspian Sea and
form the northern border of the Iranian Plateau. They are more than 1000 km long and the width varies from 30
to 130 km in different parts. The northern slopes of Elburz Mountains are covered by Hyrcanian forests. Kopet
Dagh Mountains is a large mountain range (about 650 kms along) which is located in the northeast of Iran
between Iran and Turkmenistan, stretching from near the Caspian Sea to the Harirud River. Zagros Mountains
form the western and south-western borders of the Iranian Plateau, covering 1500 km from Lake Van in Turkish
Kurdistan to south-eastern Iran. Iran has two well-known deserts, the Kavir Desert and the Lut Desert which are
among the hottest areas in the world, located in Iran’s central plateau. The Quaternary has been a period of global
climate oscillation and several Quaternary climatic changes occurred in Iran, also on the dry Iranian h ighlands82.
The most recent glaciation, termed the Riss-Würm, reached its maximum about 18,000–21,000 years ago, and
subsequently replaced by Holocene Climatic Optimum (HGO), 9000–5000 years ago83,84. During this period, in
northern and western Iran climate changed between dry and cold climatic conditions during the glaciation and
moist and warm conditions during the interglacials82–84.
Distribution points. Distribution records of all 171 recognised lizard species of Iran (see Appendix S1 for
annotated checklist of lizards of Iran) were collected from multiple sources; (1) through opportunistic observa-
tions and long term own and other colleagues fieldworks from 2009 to 2020 (Using random field surveys different
habitat types within the county were investigated (See Appendix S2 Figs. S1–S36 for examples habitats surveyed
during fieldworks and observed lizard species in each habitat)), (2) published papers and books (see Appendix
S3) and (3) from the Global Biodiversity Information Facility (GBIF: https://www.gbif.org/). Observed lizards
were identified following Anderson38, Rastegar-Pouyani et al.39 and Narabadi et al.85. In total, we collected 8620
distribution points from these sources. Since our distribution records come from multiple sources, we carefully
Scientific Reports | (2020) 10:18167 | https://doi.org/10.1038/s41598-020-74867-3 5
Vol.:(0123456789)www.nature.com/scientificreports/
Figure 2. A topographic overview of Iran with its major geomorphological features. Map was generated using
QGIS 3.4.1 (https://www.qgis.org).
Units Variable (abbreviation) and references
Degrees celsius Annual mean temperature (temperature)106
Millimeters Annual precipitation (precipitation)106
Meters Topographic heterogeneity (topo-heterogeneity)89
– Normalized Difference Vegetation Index (NDVI)107
Degrees celsius Temperature change velocity (temperature velocity)108
Millimeters Precipitation change velocity (precipitation velocity)108
Million years Mountain uplifting age (Geo) 78,98–102
Table 2. List of ecological and historical predictors used to explore drivers of lizard richness.
checked distribution data, removing duplicate records and distribution records lacking geographic coordinates.
Reliability of all 171 lizard species’ distribution records was examined by mapping each species records sepa-
rately in DIVA-GIS 7.586. We also thinned distribution records of each species to 1 km reduce clustering. Finally,
we used 6245 species presence records.
Environmental variables. We selected seven variables (Table 2) related to climate: topography, the nor-
malized difference vegetation index (NDVI), climate change velocity and geology which we expected to be
important in shaping distribution of reptiles22–24,30,32–35,3845,48,49,87. To quantify climate effect on reptile distribu-
tion, we used temperature and annual precipitation13. Current climate data was downloaded from WorldClim
(www.worldclim.org). We quantified topographic heterogeneity by measuring the standard deviation of eleva-
tion values in area grid cells of 1 km from a 90 m resolution88. Elevation layer obtained from the Shuttle Radar
Topography Mission (SRTM) elevation m odel89. The climate change velocity was calculated following Sandel
9
et al. . We used temperate and precipitation data of current climatic conditions (1970–2000) and Last Glacial
Maximum (LGM; 21,000 years before present) to calculate climate change velocity as the rate of climate change
in time divided by the local climate change in space. Climate change velocity is a measurement for long-time
climate variability9,90 and it shows the direction and rate at which organisms must have moved to maintain a
Scientific Reports | (2020) 10:18167 | https://doi.org/10.1038/s41598-020-74867-3 6
Vol:.(1234567890)www.nature.com/scientificreports/
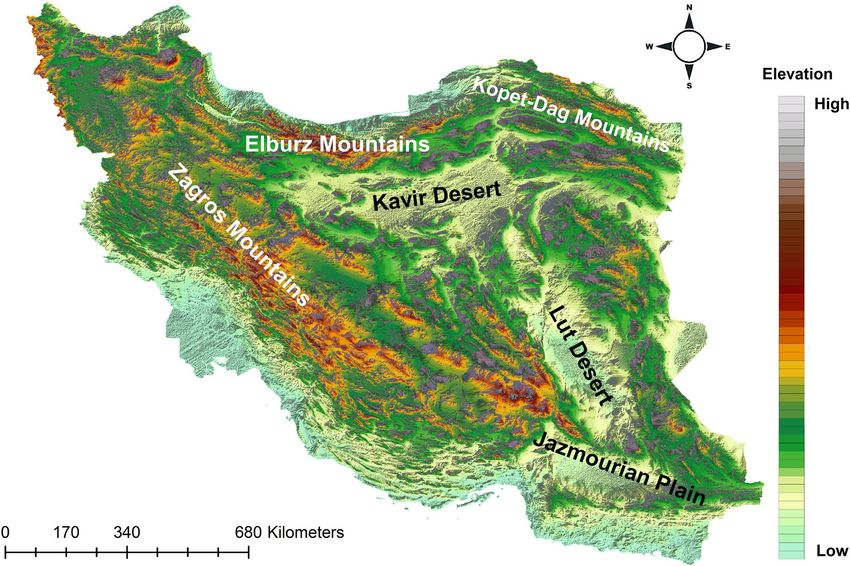
Figure 3. Iran’s terrestrial b
iomes110, together with representative lizards species occur in Temperate Broadleaf
and Mixed Forests: 2.1 Paralaudakia microlepis, 2.2 Timon kurdistanicus, 2.3 Anguis colchica, 2.4 Pseudopus
apodus; Temperate Grasslands, Savannahs, and Shrublands: 2.5 Lacerta media; Temperate Conifer Forests: 2.6
Paralaudakia caucasia, 2.7 Eremias papenfussi; Montane grasslands and shrublands: 2.8 Eremias kopetdaghica,
2.9 Darevskia kopetdaghica, 2.10 Eremias isfahanica; Deserts and Xeric Shrublands: 2.11 Eremias fasciata, 2.12
Teratoscincus scincus, 2.13 Phrynocephalus mystaceus, 2.14 Varanus griseus 2.15 Eremias persica. Map was
generated using QGIS 3.4.1 (https://www.qgis.org).
given climate under climate change9,91. In previous research, climate change velocity was identified to be strongly
associated with species richness and endemism at regional and global s cales9,90,92. LGM data were obtained from
CCSM4 and MIROC 3.2 (averaged values) downloaded from WorldClim (www.worldclim.org). Temperature
and precipitation change velocity were calculated in R 3.393 environment using the packages r aster94, gdistance95
matrixStats96 and S DMTools97. To explore the possible role of mountains uplifting on lizard richness we assem-
bled information on uplift age of each major mountain range based on the available literatures78,98–102, then
combined this information in a raster layer containing uplift age of the various mountain ranges in Iran. The
layer with uplifting age of mountain ranges was created using QGIS 3.4.1103.To avoid collinearity among vari-
ables a variance inflation factor ( VIF104) was calculated for the variables using the ‘vifstep’ function in the ‘usdm’
package105 in R 3.393 environment and results showed that collinearity among variables is low (VIF values: annual
mean temperature = 1.356, annual mean precipitation = 3.86, topographic heterogeneity = 1.614, NDVI = 3.041,
temperature change velocity = 1.185, precipitation change velocity = 1.153, mountains uplifting = 1.056).
Species richness mapping. We followed the method applied by Pellissier et al.11 and Albouy et al.109 to
map species ranges and then multiply them to create lizard richness in Iran. This method uses species occurrence
records, border of biomes (Fig. 3) of the study area and a climatic layer (here we used annual mean temperature
an important factor in shaping reptile distribution) to create species range maps. We separated Iran into six
biomes based on the World Wildlife Fund (WWF) Terrestrial Ecoregions including the following; Temperate
Broadleaf and Mixed Forests, Temperate Grasslands, Savannahs and Shrublands, Temperate Conifer Forests,
Montane grasslands and shrublands, and Deserts and Xeric S hrublands110. This approach goes through several
steps to map species distribution; first, we created a convex hull polygon around all the observations within
one bioregion. If there is only one observation in a bioregion, it will create a buffer around it of 50 km. Then to
remove potential outliers, we quantified the 2.5th and 97.5th temperature values from the occurrence, where a
species is found. We removed areas that are outside those temperature conditions. Together, we created range
maps of all 171 lizard species, and we stacked the species distribution maps into species richness using raster
package94 in R e nvironment93 to create three richness maps; all lizards, diurnal lizards and nocturnal lizards.
Scientific Reports | (2020) 10:18167 | https://doi.org/10.1038/s41598-020-74867-3 7
Vol.:(0123456789)www.nature.com/scientificreports/
Statistical analyses. We fitted a generalized linear model (GLM) with quasi-Poisson distribution in order
to explore the relationship between reptile richness (number of species in each raster pixel) and the different
historical and ecological factors. We estimated the Akaike information criterion values (AIC) and computed
the explained deviance for each predictor separately and in combination for full model using the ‘ecospat.adj.
D2.glm’ function in the R‐package ‘ecospat’111. Nocturnal and diurnal species have different natural and evolu-
tionary history and their distribution patterns are different in I ran38,44. For example, most of the nocturnal spe-
cies are occur in south of Iran which characterized with high temperature and more stable climate since LGM68.
Thus, nocturnal and diurnal lizard distribution is most likely affected by different ecological and historical vari-
ables. So, we did the analysis for all lizard, diurnal and nocturnal separately to test whether there are different
drivers for diurnal and nocturnal species. Analyses were carried out in R 3.393.
Data availability
All data needed to evaluate the conclusions in the paper are present in the paper and/or the Supplementary
Materials, or the references cited here within.
Received: 15 June 2020; Accepted: 7 October 2020
References
1. Thuiller, W. et al. Predicting global change impacts on plant species’ distributions: future challenges. Perspect. Plant Ecol. Evol.
Syst. 9, 137–152 (2008).
2. Pellissier, L. et al. Quaternary coral reef refugia preserved fish diversity. Science 344, 1016–1019 (2014).
3. Antonelli, A. et al. Geological and climatic influences on mountain biodiversity. Nat. Geosci. 11, 718–725 (2018).
4. Kerr, J. T. & Packer, L. Habitat heterogeneity as a determinant of mammal species richness in high-energy regions. Nature 385,
252–254 (1997).
5. McCain, C. M. Global analysis of reptile elevational diversity. Glob. Ecol. Biogeogr. 19, 541–553 (2010).
6. Hortal, J. et al. Species richness can decrease with altitude but not with habitat diversity. PNAS 110, E2149–E2150 (2013).
7. Noroozi, J. et al. Hotspots within a global biodiversity hotspot - areas of endemism are associated with high mountain ranges.
Sci. Rep. 8, 10345 (2018).
8. Jansson, R. Global patterns in endemism explained by past climatic change. Proc. R. Soc. B 270, 583–590 (2003).
9. Sandel, B. et al. The influence of late quaternary climate-change velocity on species endemism. Science 334, 660–664 (2011).
10. Craw, D. et al. Rapid biological speciation driven by tectonic evolution in New Zealand. Nat. Geosci. 9, 140 (2016).
11. Pellissier, L., Heine, C., Rosauer, D. F. & Albouy, C. Are global hotspots of endemic richness shaped by plate tectonics?. Biol. J.
Linn. Soc. 123, 247–261 (2017).
12. Graham, C. H., Smith, T. B. & Languy, M. Current and historical factors influencing patterns of species richness and turnover
of birds in the Gulf of Guinea highlands. J. Biogeogr. 32, 1371–1384 (2005).
13. Araújo, M. B. et al. Quaternary climate changes explain diversity among reptiles and amphibians. Ecography 31, 8–15 (2008).
14. Uetz, P. Freed, P. & Hošek J. The Reptile Database. https://www.reptile-database.org (accessed Aug 6, 2019] (2019).
15. Rodriguez, M. A., Belmontes, J. A. & Hawkins, B. A. Energy, water and large-scale patterns of reptile and amphibian species
richness in Europe. Acta Oecol. 28, 65–70 (2005).
16. Guedes, T. B. et al. Patterns, biases and prospects in the distribution and diversity of Neotropical snakes. Glob. Ecol. Biogeogr.
27, 14–21 (2017).
17. Pough, H. et al. Herpetology (Prentice Hall, Upper Saddle River, 2001).
18. Doan, T. M. A south-to-north biogeographic hypothesis for Andean speciation: evidence from the lizard genus Proctoporus
(Reptilia, Gymnophthalmidae). J. Biogeogr. 30, 361–374 (2003).
19. Agarwal, I., Bauer, A. M., Jackman, T. R. & Karanth, K. P. Insights into Himalayan biogeography from geckos: a molecular
phylogeny of Cyrtodactylus (Squamata: Gekkonidae). Mol. Phylogenet. Evol. 80, 145–155 (2014).
20. Böhm, M. et al. The conservation status of the world’s reptiles. Biol. Conserv. 157, 372–385 (2013).
21. IUCN. The IUCN Red List of Threatened Species. Version 2019.3. https://www.iucnredlist.org. (2019).
22. Powney, G. D., Grenyer, R., Orme, C. D., Owens, I. P. & Meiri, S. Hot, dry and different: Australian lizard richness is unlike that
of mammals, amphibians and birds. Glob. Ecol. Biogeogr. 19, 386–396 (2010).
23. Qian, H. Environment–richness relationships for mammals, birds, reptiles, and amphibians at global and regional scales. Ecol.
Res. 25, 629–637 (2010).
24. Coops, N. C., Rickbeil, G. J. M., Bolton, D. K., Andrew, M. E. & Brouwers, N. C. (2018), Disentangling vegetation and climate
as drivers of Australian vertebrate richness. Ecography 41, 1147–1160 (2018).
25. Skeels, A., Esquerré, D. & Cardillo, M. Alternative pathways to diversity across ecologically distinct lizard radiations. Glob. Ecol.
Biogeogr. 29, 454–469 (2020).
26. Soares, C. & Brito, J. C. Environmental correlates for species richness among amphibians and reptiles in a climate transition
area. Biodivers. Conserv. 16, 1087 (2007).
27. Tallowin, O., Allison, A., Algar, A. C., Kraus, F. & Meiri, S. Papua New Guinea terrestrial-vertebrate richness: elevation matters
most for all except reptiles. J. Biogeogr. 44, 1734–1744 (2017).
28. Kissling, D. W., Blach-Overgaard, A., Zwaan, R. E. & Wagner, P. Historical colonization and dispersal limitation supplement
climate and topography in shaping species richness of African lizards (Reptilia: Agaminae). Sci. Rep. 6, 34014 (2016).
29. Ficetola, G. F., Bonardi, A., Sindaco, R. & Padoa-Schioppa, E. Estimating patterns of reptile biodiversity in remote regions. J.
Biogeogr. 40, 1202–1211 (2013).
30. Hosseinzadeh, M., Aliabadian, M., Rastegar-Pouyani, E. & Rastegar-Pouyani, N. The roles of environmental factors on reptile
richness in Iran. Amphib. Reptil. 35, 215–225 (2014).
31. Ficetola, G. F., Falaschi, M., Bonardi, A., Padoa-Schioppa, E. & Sindaco, R. Biogeographical structure and endemism pattern in
reptiles of the Western Palearctic. Prog. Phys. Geogr. 42, 220–236 (2018).
32. Rastegar-Pouyani, E., Rastegar-Pouyani, N., Kazemi-Noureini, S., Joger, U. & Wink, M. Molecular phylogeny of the Eremias
persica complex of the Iranian plateau (Reptilia: Lacertidae), based on mtDNA sequences. Zool. J. Linn. Soc. 158, 641–660 (2010).
33. Rastegar-Pouyani, E., Kazemi-Noureini, S., Rastegar-Pouyani, N., Joger, U. & Wink, M. Molecular phylogeny and intraspecific
differentiation of the Eremias velox complex of the Iranian Plateau and Central Asia (Sauria, Lacertidae). J. Zool. Syst. Evol. 50,
220–229 (2012).
34. Ahmadzadeh, F. et al. Inferring the effects of past climate fluctuations on the distribution pattern of Iranolacerta (Reptilia,
Lacertidae): Evidence from mitochondrial DNA and species distribution models. Zool. Anz. 252, 141–148 (2013).
Scientific Reports | (2020) 10:18167 | https://doi.org/10.1038/s41598-020-74867-3 8
Vol:.(1234567890)www.nature.com/scientificreports/
35. Ahmadzadeh, F., Carretero, M. A., Harris, D. J., Perera, A. & Böhme, W. A molecular phylogeny of the eastern group of ocellated
lizard genus Timon (Sauria: Lacertidae) based on mitochondrial and nuclear DNA sequences. Amphib. Reptil. 33, 1–10 (2012).
36. Macey, J. R. Testing hypotheses for vicariant separation in the agamid lizard Laudakia caucasia from mountain ranges of the
Northern Iranian plateau. Mol. Phylogenet. Evol. 14, 479–483 (2000).
37. Rajabizadeh, M. et al. Alpine-Himalayan orogeny drove correlated morphological, molecular, and ecological diversification in
the Persian dwarf snake (Squamata: Serpentes: Eirenis persicus). Zool. J. Linn. Soc. 176, 878–913 (2016).
38. Anderson, S. C. The Lizards of Iran (Society for the Study of Amphibians and Reptiles, Oxford, 1999).
39. Eskandarzadeh, N. et al. Annotated checklist of the endemic Tetrapoda species of Iran. Zoosystema 40, 507–537 (2018).
40. Saberi-Pirooz, R. et al. Dispersal beyond geographic barriers: a contribution to the phylogeny and demographic history of
Pristurus rupestris Blanford, 1874 (Squamata: Sphaerodactylidae) from southern Iran. Zoology 134, 8–15 (2019).
41. Ahmadi, H. & Feiznia, S. Quaternary Formations (Aeoretical and Applied Principles in Natural Resources) (University of Tehran
Press, Tehran, 2006).
42. Stümpel, N., Rajabizadeh, M., Avcı, A., Wüster, W. & Joger, U. Phylogeny and diversification of mountain vipers (Montivipera,
Nilson etal. 2013) triggered by multiple Plio-Pleistocene refugia and high-mountain topography in the Near and Middle East.
Mol. Phylogenet. Evol. 101, 336–351 (2016).
43. Yousefi, M. et al. Upward altitudinal shifts in habitat suitability of mountain vipers since the Last Glacial Maximum. PLoS ONE
10, e0138087 (2015).
44. Rastegar-Pouyani, N., Rastegar-Pouyani, E. & Jawaheri, M. Field Guide to the Reptiles of Iran (Razi University Press, Kermanshah,
2007).
45. Kafash, A., Kaboli, M., Köhler, G., Yousefi, M. & Asadi, A. Ensemble distribution modeling of the Mesopotamian spiny-tailed
lizard, Saara loricate (Blanford, 1874), in Iran: an insight into the impact of climate change. Turk. J. Zool. 40, 262–271 (2016).
46. Faizi, H. et al. A new species of Eumeces Wiegmann 1834 (Sauria: Scincidae) from Iran. Zootaxa 4320, 289–304 (2017).
47. Torki, F. Description of a new species of Lytorhynchus (Squamata: Colubridae) from Iran. Zool. Middle East. 63, 109–116 (2017).
48. Fattahi, R. et al. Modelling the potential distribution of the Bridled Skink, Trachylepis vittata (Olivier, 1804), in the Middle East.
Zool. Middle East 60, 208–216 (2014).
49. Kafash, A. et al. Phrynocephalus scutellatus (Olivier, 1807) in Iranian Plateau: The degree of niche overlap depends on the phy-
logenetic distance. Zool. Middle East. 64, 47–54 (2018).
50. Rodríguez, M. Á., Belmontes, J. A. & Hawkins, B. A. Energy, water and large-scale patterns of reptile and amphibian species
richness in Europe. Acta Oecol. 28, 65–70 (2005).
51. Angilletta, M. J., Niewiarowski, P. H. & Navas, C. A. The evolution of thermal physiology in ectotherms. J. Therm. Biol. 27,
249–268 (2002).
52. Currie, D. J. Energy and large-scale patterns of animal and plant-species richness. Am Nat. 137, 27–49 (1991).
53. Whittaker, R. J., Nogues-Bravo, D. & Araujo, M. B. Geographical gradients of species richness: a test of the water-energy con-
jecture of Hawkins et al. (2003) using European data for five taxa. Glob. Ecol. Biogeogr. 16, 76–89 (2007).
54. Iverson, J. B. Species richness maps of the freshwater and terrestrial turtles of the world. Smithsonian Herpet. Inform. Serv. 88,
1–18 (1992).
55. Schall, J. J. & Pianka, E. R. Geographical trends in number of species. Science 201, 679–686 (1978).
56. Vidan, E. et al. The Eurasian hot nightlife: environmental forces associated with nocturnality in lizards. Glob. Ecol. Biogeogr. 26,
1316–1325 (2017).
57. Hewitt, G. M. Genetic consequences of climatic oscillations in the Quaternary. Philos. Trans. R. Soc. Lond. B 359, 183–195 (2004).
58. Rajabizadeh, M. et al. Geographic variation, distribution and habitat of Natrix tessellata in Iran. Mertensiella 18, 414–429 (2011).
59. Veith, M., Schmidtler, J. F., Kosuch, J., Baran, I. & Seitz, A. Palaeoclimatic changes explain Anatolian mountain frog evolution:
a test for alternating vicariance and dispersal events. Mol. Ecol. 12, 185–199 (2003).
60. Farasat, H., Akmali, V. & Sharifi, M. Population Genetic Structure of the Endangered Kaiser’s Mountain Newt, Neurergus kaiseri
(Amphibia: Salamandridae). PLoS ONE 11, e0149596 (2016).
61. Perktaş, U., Barrowclough, G. F. & Groth, J. G. Phylogeography and species limits in the green woodpecker complex (Aves:
Picidae): multiple Pleistocene refugia and range expansion across Europe and the Near East. Biol. J. Linn. Soc. 104, 710–723
(2011).
62. Perktas, U. & Quintero, E. A wide geographical survey of mitochondrial DNA variation in the great spotted woodpecker complex,
Dendrocopos major (Aves: Picidae). Biol. J. Linn. Soc. 108, 173–188 (2013).
63. Haddadian-Shad, H., Darvish, J., Rastegar-Pouyani, E. & Mahmoudi, A. Subspecies differentiation of the house mouse Mus
musculus Linnaeus, 1758 in the center and east of the Iranian plateau and Afghanistan. Mammalia 81, 1–22 (2016).
64. Dianat, M., Darvish, J., Cornette, R., Aliabadian, M. & Nicolas, V. Evolutionary history of the Persian Jird, Meriones persicus,
based on genetics, species distribution modelling and morphometric data. J. Zool. Syst. Evol. 55, 29–45 (2016).
65. Ashrafzadeha, M. R., Rezaei, H. R., Khalilipourc, O. & Kuszad, S. Genetic relationships of wild boars highlight the importance
of Southern Iran in forming a comprehensive picture of the species’ phylogeography. Mamm. Biol. 92, 21–29 (2018).
66. Wiens, J. J. & Graham, C. H. Niche conservatism: integrating evolution, ecology, and conservation biology. Annu. Rev. Ecol.
Evol. Syst. 36, 519–539 (2005).
67. Wiens, J. J. & Donoghue, M. J. Historical biogeography, ecology, and species richness. Trends Ecol. Evol. 19, 639–644 (2004).
68. Ahmadzadeh, F. et al. The evolutionary history of two lizards (Squamata: Lacertidae) is linked to the geological development
of Iran. Zool. Anz. 270, 49–56 (2017).
69. Nilson, G., Rastegar-Pouyani, N., Rastegar-Pouyani, E. & Andrén, C. Lacertas of South and Central Zagros Mountains, Iran,
with descriptions of two new taxa. Russ J. Herpetol. 10, 11–24 (2003).
70. Šmíd, J. & Frynta, D. Genetic variability of Mesalina watsonana (Reptilia: Lacertidae) on the Iranian plateau and its phylogenetic
and biogeographic affinities as inferred from mtDNA sequences. Acta. Herpetol. 7, 139–153 (2012).
71. Yusefi, G. H., Faizolahi, K., Darvish, J., Safi, K. & Brito, J. C. The species diversity, distribution, and conservation status of the
terrestrial mammals of Iran. J. Mammal. 100, 55–71 (2019).
72. Myers, N., Mittermeier, R. A., Mittermeier, C. G., da Fonseca, G. A. B. & Kent, J. Biodiversity hotspots for conservation priorities.
Nature 403, 853–858 (2000).
73. Isaac, N. J. B., Redding, D. W., Meredith, H. M. & Safi, K. Phylogenetically-Informed Priorities for Amphibian Conservation.
PLoS ONE 7, e43912 (2012).
74. Hagen, O. et al. Mountain building, climate cooling and the richness of cold-adapted plants in the Northern Hemisphere. J.
Biogeogr. 46, 1792–1807 (2019).
75. Noroozi, J., Moser, D. & Essl, F. Diversity, distribution, ecology and description rates of alpine endemic plant species from Iranian
mountains. Alp. Bot. 126, 1–9 (2016).
76. Noroozi, J., Akhani, H. & Breckle, S. W. Biodiversity and phytogeography of the alpine flora of Iran. Biodivers. Conserv. 17,
493–521 (2008).
77. Ahmadzadeh, F. et al. Cryptic speciation patterns in Iranian rock lizards uncovered by Integrative Taxonomy. PLoS ONE 8,
e80563 (2013).
78. Darvishzadeh, A. Geology of Iran (Amirkabir Publication, Tehran, 2003).
Scientific Reports | (2020) 10:18167 | https://doi.org/10.1038/s41598-020-74867-3 9
Vol.:(0123456789)www.nature.com/scientificreports/
79. Rögl, F. Mediterranean and Paratethys. Facts and hypotheses of an Oligocene to Miocene paleogeography (short overview).
Geol. Carpath. 50, 339–349 (1999).
80. Okay, A. I., Zattin, M. & Cavazza, W. Apatite fission-track data for the Miocene Arabia-Eurasia collision. Geology 38, 35–38
(2010).
81. Girdler, R. W. The evolution of the Gulf of Aden and Red Sea in space and time. Deep-Sea Res. 316, 747–762 (1984).
82. Kehl, M. Quaternary climate change in Iran—the state of knowledge. Erdkunde 63, 1–17 (2009).
83. Ehlers, J. & Gibbard, P. L. Quaternary Glaciations Extent and Chronology: Part I: Europe (Elsevier, Amsterdam, 2004).
84. Kaufman, D. S. et al. Holocene thermal maximum in the western Arctic (0–180 W). Quat. Sci. Rev. 23, 529–560 (2004).
85. Nasrabadi, R., Rastegar-Pouyani, N., Rastegar-Pouyani, E. & Gharzi, A. A revised key to the lizards of Iran (Reptilia: Squamata:
Lacertilia). Zootaxa 4227, 431–443 (2017).
86. Hijmans, R.J., Guarino, L. & Mathur, P. “DIVA-GIS.” https://www.diva-gis.org/documentation (2012).
87. Kafash, A., Ashrafi, S., Ohler, A. & Schmidt, B. R. Environmental predictors for the distribution of the Caspian Green Lizard,
Lacerta strigata Eichwald, 1831 along elevational gradients of the Elburz Mountains in northern Iran. Turk. J. Zool. 43, 106–113
(2019).
88. Descombes, P., Leprieur, F., Albouy, C., Heine, C. & Pellissier, L. Spatial imprints of plate tectonics on extant richness of terrestrial
vertebrates. J. Biogeogr. 44, 1185–1197 (2017).
89. Jarvis, A., Reuter, H. I., Nelson, A. & Guevara, E. Hole-Filled SRTM for the Globe Version 4. Available from the CGIAR-CSI SRTM
90m Database. https://srtm.csi.cgiar.org (2008).
90. Loarie, S. R. et al. The velocity of climate change. Nature 462, 1052–1055 (2009).
91. Grünig, M., Beerli, N., Ballesteros-Mejia, L., Kitching, I. J. & Beck, J. How climatic variability is linked to the spatial distribution
of range sizes: Seasonality versus climate change velocity in sphingid moths. J. Biogeogr. 44, 2441–2450 (2017).
92. Soultan, A., Wikelski, M. & Safi, K. Classifying biogeographic realms of the endemic fauna in the Afro-Arabian region. Ecol
Evol. 10, 8669–8680 (2020).
93. R Core Team. R: A Language and Environment for Statistical Computing (R Foundation for Statistical Computing, Vienna, Austria,
2016).
94. Hijmans, R.J. raster: Geographic Data Analysis and Modeling. R package version 3.3-7 (2020).
95. van Etten, J. R package gdistance: Distances and routes on geographical grids. J. Stat. Softw. 76, 1–21 (2017).
96. Bengtsson, H. matrixStats: Functions That Apply to Rows and Columns of Matrices (and to Vectors). R package version 0.56.0.
(2020).
97. VanDerWal, J. et al. SDMTools: Species Distribution Modelling Tools: Tools for Processing Data Associated with Species Distribution
Modelling Exercises. R package ver. 1.1‐221.1. (2019).
98. Alavi, M. Tectonics of the Zagros orogenic belt of Iran: New data and interpretations. Tectonophysics 229, 211–238 (1994).
99. Agard, P., Omrani, J., Jolivet, L. & Mouthereau, F. Convergence history across Zagros (Iran): constraints from collisional an
earlier deformation. Int. J. Earth Sci. 94, 401–419 (2005).
100. Monthereau, F. Timing of uplift in the Zagros belt/Iranian plateau and accommodation of late Cenozoic Arabia-Eurasia con-
vergence. Geol. Mag. 148, 726–738 (2011).
101. Rezaeian, M., Carter, A., Hovius, N. & Allen, M. B. Cenozoic exhumation history of the Alborz Mountains, Iran: new constraints
from low-temperature chronometry. Tectonics 31, TC004 (2012).
102. Madanipour, S., Ehlers, T. A., Yassaghi, A. & Enkelmann, E. Accelerated middle Miocene exhumation of the Talesh Mountains
constrained by U-Th/He thermochronometry: evidence for the Arabia-Eurasia collision in the NW Iranian Plateau. Tectonics
36, 1538–1561 (2017).
103. QGIS Development Team. QGIS Geographic Information System (version 3.4.1). Software (2018).
104. Quinn, G. P. & Keough, M. J. Experimental Designs and Data Analysis for Biologists (Cambridge University Press, Cambridge,
2002).
105. Naimi, B. Uncertainty Analysis for Species Distribution Models. R package version 1.1-15 (2015).
106. Fick, S. E. & Hijmans, R. J. Worldclim 2: New 1-km spatial resolution climate surfaces for global land areas. Int. J. Climatol. 37,
4302–4315 (2017).
107. Broxton, P. D., Zeng, X., Scheftic, W. & Troch, P. A. A MODIS-based global 1-km maximum green vegetation fraction dataset.
J. Appl. Meteorol. Clim. 53, 1996–2004 (2014).
108. Hijmans, R. J., Cameron, S. E., Parra, J. L., Jones, P. G. & Jarvis, A. Very high resolution interpolated climate surfaces for global
land areas. Int. J. Climatol. 25, 1965–1978 (2005).
109. Albouy, C. et al. The marine fish food web is globally connected. Nat. Ecol. Evol. 3, 1153–1161 (2019).
110. Olson, D. et al. Terrestrial ecoregions of the world: a new map of life on Earth: a new global map of terrestrial ecoregions provides
an innovative tool for conserving biodiversity. Bioscience 51, 933–938 (2001).
111. Di Cola, V. et al. ecospat: an R package to support spatial analyses and modeling of species niches and distributions. Ecography
40, 774–787 (2017).
Acknowledgements
We would like to thank Ali Khani, Farhad Ataei, Mehdi Yousefi and Mohammad Ebrahim Kafash for their help
during fieldwork. We thank Fabian Fopp for his help in producing the richness maps. This research was sup-
ported by the Iranian National Science Foundation (project number: 96000492), Ministry of Science Research
and Technology of Iran.
Author contributions
A.K. and L.P conceived and designed the research; A.K. and M.Y. collected the data; A.K. analyzed the data
with the help of M.G.; A.K wrote the original draft; all authors contributed to the writing and reviewing the
manuscript.
Competing interests
The authors declare no competing interests.
Additional information
Supplementary information is available for this paper at https://doi.org/10.1038/s41598-020-74867-3.
Correspondence and requests for materials should be addressed to S.A.
Reprints and permissions information is available at www.nature.com/reprints.
Scientific Reports | (2020) 10:18167 | https://doi.org/10.1038/s41598-020-74867-3 10
Vol:.(1234567890)www.nature.com/scientificreports/
Publisher’s note Springer Nature remains neutral with regard to jurisdictional claims in published maps and
institutional affiliations.
Open Access This article is licensed under a Creative Commons Attribution 4.0 International
License, which permits use, sharing, adaptation, distribution and reproduction in any medium or
format, as long as you give appropriate credit to the original author(s) and the source, provide a link to the
Creative Commons licence, and indicate if changes were made. The images or other third party material in this
article are included in the article’s Creative Commons licence, unless indicated otherwise in a credit line to the
material. If material is not included in the article’s Creative Commons licence and your intended use is not
permitted by statutory regulation or exceeds the permitted use, you will need to obtain permission directly from
the copyright holder. To view a copy of this licence, visit http://creativecommons.org/licenses/by/4.0/.
© The Author(s) 2020
Scientific Reports | (2020) 10:18167 | https://doi.org/10.1038/s41598-020-74867-3 11
Vol.:(0123456789)You can also read