884 Evaluation of ECMWF forecasts, including the 2021 upgrade
←
→
Page content transcription
If your browser does not render page correctly, please read the page content below
Technical
 Memo

 884
 al Memo Technical Memo Technical Memo Technical Memo Tech
 Evaluation
 ical Memo Technical ofMemo
 ECMWF Technical Memo Technical Memo Te
 hnicalforecasts,
 Memo Technical Memo Technical
 including the Memo Technical Memo T
 chnical Memo Technical Memo Technical Memo Technical Memo
 2021 upgrade
Technical Memo Technical Memo Technical Memo Technical Mem
 Technical Memo Technical Memo Technical Memo Technical Me
mo Technical Memo Technical Memo Technical Memo Technical M
 mo Technical Memo Technical Memo Technical Memo Technical
Memo Technical Memo Technical Memo Technical Memo Technic
 Memo Technical
 T. Haiden, Memo
 M. Janousek, Technical Memo Technical Memo Techn
 F. Vitart,
 Z. Ben Bouallegue, L. Ferranti, F. Prates, and
 al Memo Technical
 D. Richardson Memo
 (Forecast Technical Memo Technical Memo Tech
 Department)
 ical Memo
 SeptemberTechnical
 2021 Memo Technical Memo Technical Memo Tec
hnical Memo Technical Memo Technical Memo Technical Memo T
 chnical Memo Technical Memo Technical Memo Technical Memo
 echnical Memo Technical Memo Technical Memo Technical Mem
 Technical Memo Technical Memo Technical Memo Technical Me
 o Technical Memo Technical Memo Technical Memo Technical M
 mo Technical Memo Technical Memo Technical Memo Technical
Memo Technical Memo Technical Memo Technical Memo Technica
 Memo Technical Memo Technical Memo Technical Memo Techni
 al Memo Technical Memo Technical Memo Technical Memo Tech
 cal Memo Technical Memo Technical Memo Technical Memo Tec
 nical Memo Technical Memo Technical Memo Technical Memo T
 chnical Memo Technical Memo Technical Memo Technical Memo
Series: ECMWF Technical Memoranda

A full list of ECMWF Publications can be found on our website under:
http://www.ecmwf.int/en/publications

Contact: library@ecmwf.int

© Copyright 2021

European Centre for Medium-Range Weather Forecasts, Shinfield Park, Reading, RG2 9AX, UK

Literary and scientific copyrights belong to ECMWF and are reserved in all countries. The content of this
document is available for use under a Creative Commons Attribution 4.0 International Public License.
See the terms at https://creativecommons.org/licenses/by/4.0/.

The information within this publication is given in good faith and considered to be true, but ECMWF
accepts no liability for error or omission or for loss or damage arising from its use.
Evaluation of ECMWF forecasts

1 Introduction
The most recent change to the ECMWF forecasting system (IFS Cycle 47r2, on 11 May 2021) is
summarised in section 2. The description of changes and meteorological impacts from this upgrade
largely follows the ECMWF Newsletter article of Rodwell et al. (2021). Verification results of the
ECMWF medium-range upper-air forecasts are presented in section 3, including, where available, a
comparison of ECMWF’s forecast performance with that of other global forecasting centres. Section 4
presents the verification of ECMWF forecasts of weather parameters and ocean waves, while severe
weather is addressed in section 5. Finally, section 6 discusses the performance of monthly and seasonal
forecast products.
As in previous reports a wide range of verification results is included and, to aid comparison from year
to year, the set of additional verification scores shown here is consistent with that of previous years
(ECMWF Tech. Memos. 346, 414, 432, 463, 501, 504, 547, 578, 606, 635, 654, 688, 710, 765, 792,
817, 831, 853, 880). A few new plots have been included to highlight additional aspects of ECMWF’s
forecast performance. A short technical note describing the scores used in this report is given at the end
of this document.
Verification pages are regularly updated, and accessible at the following address:
www.ecmwf.int/en/forecasts/charts
by choosing ‘Verification’ under the following headers
 • ‘Medium Range’ (medium-range and ocean waves)
 • ‘Extended Range’ (monthly)
 • ‘Long Range’ (seasonal)

2 Changes to the ECMWF forecasting system
On 11 May 2021, ECMWF implemented a substantial upgrade of its Integrated Forecasting System
(IFS). IFS Cycle 47r2 includes changes to the forecast model, but not to the data assimilation system.
The upgrade is neutral for the medium-range deterministic high-resolution (HRES) forecast but brings
benefits to the medium- and extended-range ensemble forecasts (ENS).

2.1 Model changes
Previous versions of the IFS have used ‘double precision’, where each number is stored using 64 bits of
memory. This is often more accurate than required when we consider observational errors and model
approximations. Single precision, in which each number is stored with 32 bits of memory, offers the
prospect of freeing up memory and, importantly, increasing processing speeds. This allows
computational savings to be made which can be used to achieve skill improvements. Faster core
processing of single-precision data permits a 50% increase in ENS model levels from 91 to 137. Even
with this increase in levels, data transferred between the memory on each node is reduced because it is
now in single precision.

Technical Memorandum No.884 1
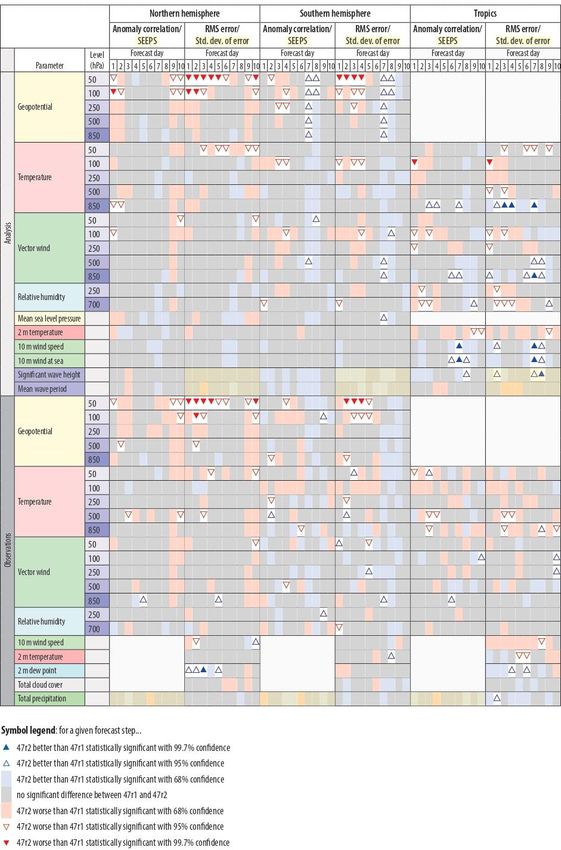
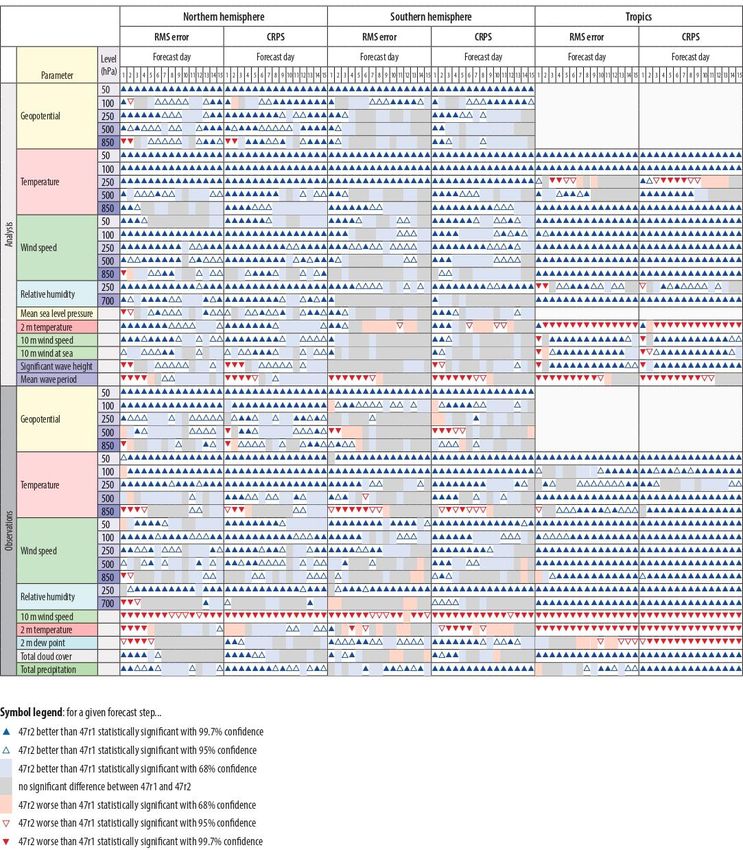
Evaluation of ECMWF forecasts

Double precision is still used throughout the data assimilation process, and some calculations in the
forecast do still require double precision. The most expensive of those, such as the calculation of the
associated Legendre polynomials and the finite-element integral operators of the vertical discretisation,
are only done once and are not repeated during time-stepping. Hence, there is minimal impact on
computational efficiency. Further detailed experimentation helped us to identify a few other calculations
in parts of dynamics and physics and the stochastic physics perturbations that need to be secured with
double precision. However, those also represent a very small part of the total computational load.
The change to 137 levels brings ECMWF one step closer to a more seamless ensemble data assimilation
and forecasting system. The need for vertical interpolation when generating ensemble initial conditions
is now greatly reduced as the ensemble of data assimilations (EDA) is already run with 137 levels. The
consistency with the HRES vertical resolution should also aid the evaluation process of future cycles.
Technical changes to the ensemble include the calculation of singular vector perturbations with 137
levels.

2.2 Meteorological impact of the new cycle
Figure 1 and Figure 2 show score changes and their statistical significance for the high-resolution
forecast (HRES) and the ensemble forecast (ENS), respectively. HRES is run at TCo1279 resolution
(corresponding to a horizontal grid spacing of about 9 km) and ENS at TCo639 (corresponding to a
horizontal grid spacing of about 18 km).
The goal for the implementation of single precision was neutrality in HRES scores, together with major
computational cost savings. Neutrality would be demonstrated in an HRES scorecard with
approximately a third of the boxes being grey, a third red and a third blue, and with little more than 5%
of the red and blue boxes being statistically significant at the 5% significance level (indicated by
triangles). As can be seen in Figure 1, this has largely been achieved. A possible exception is a
degradation (typically less than 1%) in stratospheric extratropical geopotential height scores.
The increase in vertical resolution from 91 to 137 levels has been introduced to all ENS forecasts in the
medium to the extended range. The ENS scorecard is shown in Figure 2. The change leads to statistically
significant improvements to many ENS scores of about 0.5–2% throughout most of the free atmosphere.
Stratospheric temperature scores are greatly improved, typically by 5–20%. This is, among other things,
due to a weaker growth of temperature biases because the ENS can better resolve gravity waves in the
vertical. The mean cooling difference below 600 hPa acts to decrease the warm bias around 850 hPa. It
improves tropical medium-range scores at that level by over 6%. It does also slightly increase the
tropical near-surface cool bias, and this is reflected in the 2-metre temperature scores, which are
degraded by up to 1% by day 14. Ten-metre wind scores are also slightly degraded by 0.1–0.3%.
Tropical cyclones show reduced intensity errors. This is largely associated with reduced bias. There is
a mean reduction of about 2 hPa in central pressure in the medium range, increased spread, and improved
reliability as measured by the spread-error agreement. The cycle is neutral in terms of track errors.
The impact of IFS single precision on extended-range forecast biases and scores is neutral, confirming
that IFS single precision can be used to reduce the cost of extended-range forecasts without any
significant trade-offs in forecast quality. The increase to 137 vertical levels significantly improves the
mean state of the upper-atmosphere in extended-range reforecasts by reducing the magnitude of cold

2 Technical Memorandum No.884
Evaluation of ECMWF forecasts

bias in the upper troposphere/lower stratosphere. Furthermore, the increased vertical resolution increases
the amplitude of the Madden–Julian Oscillation (MJO), which is a key source of sub-seasonal
predictability. Out to the extended range, the amplitude of the MJO is better sustained: the amplitude
loss by day 15 is now about 15% rather than the previous value of about 20%. There is also an increase
in MJO spread, improved reliability and better scores (Figure 3). These improvements to the MJO are
largely driven by improvements to the tropical zonal winds at 200 hPa.

3 Verification of upper-air medium-range forecasts
3.1 ECMWF scores
Figure 4 shows the evolution of the skill of the high-resolution forecast of 500 hPa height over Europe
and the extratropical northern and southern hemispheres since 1981. Each point on the curves shows the
forecast range at which the monthly mean (blue lines) or 12-month mean centred on that month (red
line) of the anomaly correlation (ACC) between forecast and verifying analysis falls below 80%. In both
extratropical hemispheres, in 2020-21 the score has surpassed all previous 12-month values. This is
mainly due to improvements from model cycle 46r1, which was implemented in June 2019 (Sleigh et
al., 2019), and, to a lesser degree, due to model cycle 47r1, which was implemented in June 2020
(Haiden et al., 2021). In Europe, the score exhibits larger interannual variations, as expected, but when
averaged over the most recent 2-yr period, it also has reached the highest level seen so far.
A complementary measure of performance is the root mean square (RMS) error of the forecast. Figure
5 shows RMS errors for both extratropical hemispheres of the six-day forecast and the persistence
forecast. In both hemispheres, the 12-month running mean RMS error of the six-day forecast has reached
its lowest values relative to the RMS error of persistence. In the southern hemisphere, also the absolute
level of RMS error is the lowest seen so far.
Figure 6 shows the time series of the average RMS difference between four- and three-day (blue) and
six- and five-day (red) forecasts from consecutive days of 500 hPa forecasts over Europe and the
northern extratropics. This illustrates the inconsistency between successive 12 UTC forecasts for the
same verification time. Values have slightly increased in both hemispheres after a minimum in 2019.
The magnitude of the increase is such that it may still be due to interannual variability as seen in previous
years. Further monitoring will show if the trend persists.
The quality of ECMWF forecasts in the upper atmosphere in the northern hemisphere extratropics is
shown through time series of temperature and vector wind scores at 50 hPa in Figure 7. The RMSE is
close to its lowest values for both parameters. Comparison with other centres in terms of 100 hPa
temperature scores (Figure 8, top panel) show that ECMWF has increased its lead in recent years.
Stratospheric scores for some parameters improved substantially due to changes made in cycles 46r1
and 47r1 by reducing long-standing biases in the stratosphere (Sleigh et al., 2020). The centre panel in
Figure 8 shows that HRES stratospheric geopotential scores have improved markedly in 2019 and 2020.
The bottom panel in Figure 8 shows that in the upper stratosphere also the anomaly correlation
improved.
The trend in ENS performance is illustrated in Figure 9, which shows the evolution of the continuous
ranked probability skill score (CRPSS) for 850 hPa temperature over Europe and the northern

Technical Memorandum No.884 3
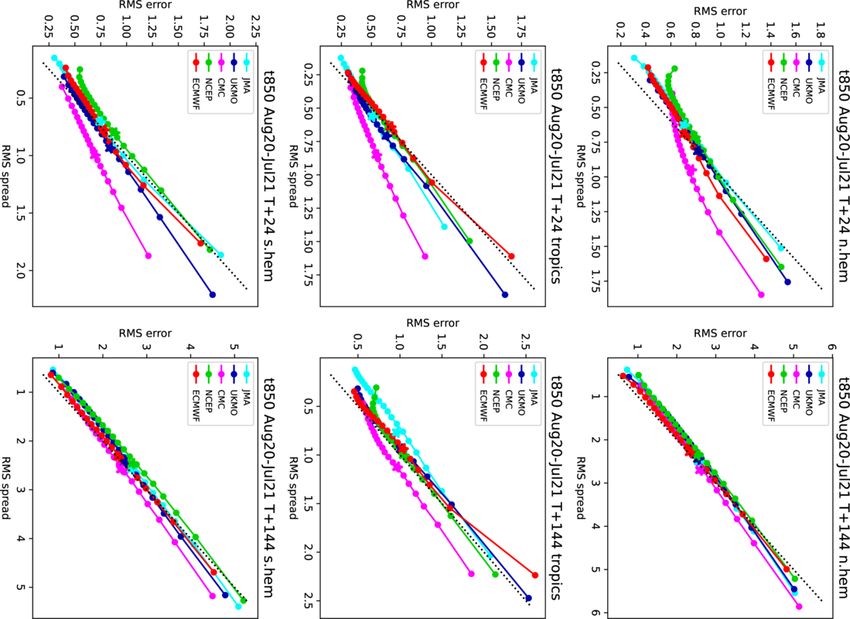
Evaluation of ECMWF forecasts

hemisphere. Both in Europe and the northern extratropics, the 12-month running mean of this score has
reached new record levels. In the northern extratropics, also the 3-month values have reached a new
high in the winter 2020-21. It is worth noting that the winter maxima are the main drivers of interannual
variability, while the summer minima give a good indication of the longer-term trend. Starting in 2019,
the extratropical summer minima are generally at a higher level than before.
In a well-tuned ensemble system, the RMS error of the ensemble mean forecast should, on average,
match the ensemble standard deviation (spread). The ensemble spread and ensemble-mean error over
the extratropical northern hemisphere for last winter, as well as the difference between ensemble spread
and ensemble-mean error for the last three winters, are shown in Figure 10. Both for 500 hPa
geopotential height and 850 hPa temperature, forecasts show a good overall match between spread and
error. For 500 hPa geopotential, the match between spread and error in DJF 2021 is better than in
previous years but this could be due to interannual variability.
A good match between spatially and temporally averaged spread and error is necessary but not sufficient
for a well-calibrated ensemble. It should also be able to capture day-to-day changes in predictability, as
well as their geographical variations. This can be assessed using spread-reliability diagrams. Forecast
values of spread over a given region and time period are binned into equally populated spread categories,
and for each bin the average error is determined. In a well-calibrated ensemble, the resulting line is close
to the diagonal. Figure 11 and Figure 12 show spread-reliability plots for 500 hPa geopotential and 850
hPa temperature for different global models. Spread reliability generally improves with lead time. At
day 1 (left panels), forecasts are only moderately skilful in ‘predicting’ the average error, resulting in
curves that deviate significantly from the diagonal, while at day 6 (right panels) most models are
capturing spatio-temporal variations in error rather well. Overall, ECMWF performs best, with its spread
reliability closest to the diagonal. The stars in the plots mark the average values, corresponding to Figure
10, and ideally should lie on the diagonal, and as close to the lower left corner as possible. In this regard
ECMWF performs best among the global models with the exception of 850 hPa temperature at day 1,
where the Japan Meteorological Agency (JMA) forecast has the lowest error (although ECMWF has
slightly better overall match between error and spread).
To create a benchmark for the ENS, the CRPS is also computed for a ‘dressed’ ERA5 forecast. This
allows to better distinguish the effects of IFS developments from those of atmospheric variability and
produces a more robust measure of ENS skill. The dressing uses the mean error and standard deviation
of the previous 30 days to generate a Gaussian distribution around ERA5. Figure 13 shows the evolution
of CRPS skill of the ENS relative to the ERA5 reference for some upper-air parameters. Both at forecast
days 5 (upper panel) and 10 (lower panel), the effect of 46r1 in 2019 is clearly visible, leading to a
forecast performance which is at its highest level so far. In 2020-21, values remained roughly at the
same level, with some variability superimposed.
The forecast performance in the tropics, as measured by RMS vector errors of the wind forecast with
respect to the analysis, is shown in Figure 14. Both the 200 hPa and 850 hPa errors have reached, or are
close to, their lowest values. Scores for wind speed in the tropics are generally sensitive to inter-annual
variations of tropical circulation systems such as the Madden-Julian oscillation, or the number of tropical
cyclones.

4 Technical Memorandum No.884
Evaluation of ECMWF forecasts

3.2 WMO scores - comparison with other centres
The model inter-comparison plots shown in this section are based on the regular exchange of scores
between WMO designated global data-processing and forecasting system (GDPFS) centres under WMO
Commission for Observation, Infrastructure and Information Systems (Infrastructure Commission)
auspices, following agreed standards of verification.
Figure 15 shows time series of such scores for 500 hPa geopotential height in the northern and southern
hemisphere extratropics. Over the period shown, errors have decreased for all models, while ECMWF
continues to maintain its lead.
WMO-exchanged scores also include verification against radiosondes. Figure 16 (Europe), and Figure
17 (northern hemisphere extratropics) show 500 hPa geopotential height and 850 hPa wind forecast
errors averaged over the past 12 months. While ECMWF does not lead at all forecast ranges, overall it
has the best performance in the medium-range when verified against observations.
The WMO model intercomparison for the tropics is summarised in Figure 18 (verification against
analyses) and Figure 19 (verification against observations), which show vector wind errors for 250 hPa
and 850 hPa. When verified against the centres’ own analyses, the JMA forecast has the lowest error in
the short range (day-2) while in the medium-range, both ECMWF and JMA have comparable skill in
the tropics. In the tropics, verification against analyses (Figure 18) is sensitive to details of the analysis
method, in particular its ability to extrapolate information away from observation locations. When
verified against observations (Figure 19), the ECMWF forecast has the smallest overall error in the
medium range.

3.3 CAMS scores
In 2021, Copernicus Atmosphere Monitoring Service (CAMS) upper-air scores have been added to the
set of metrics routinely verified and monitored. CAMS uses the same model cycle as HRES but has
lower horizontal resolution (40 km grid spacing), does not use the EDA, has prognostic aerosols
interacting with radiation, and only goes out to day 5. Figure 20: Anomaly correlation of 500 hPa
geopotential in the northern hemisphere extratropics at day 5. CAMS forecast (red, dashed) shown in
comparison to the HRES (red) and forecasts from other global centres. shows that in terms of 500 hPa
geopotential in the extratropics, CAMS forecasts rank 3rd behind HRES and the Met Office, ahead of
other global centres’ forecasts. In some continental areas in the tropics such as India, and parts of Africa
and South America, CAMS slightly outperforms HRES for lower atmospheric (850 hPa) temperature,
indicating the benefit of prognostic aerosol on the meteorological forecast. Routine verification of the
CAMS atmospheric composition forecast is carried out by the CAMS Evaluation and Quality Assurance
(EQA) with reports being published at https://atmosphere.copernicus.eu/eqa-reports-global-services .

4 Weather parameters and ocean waves
4.1 Weather parameters – high-resolution and ensemble
The supplementary headline scores for deterministic and probabilistic precipitation forecasts are shown
in Figure 21. The top left panel shows the lead time at which the stable equitable error in probability
space (SEEPS) skill for the high-resolution forecast for precipitation accumulated over 24 hours over

Technical Memorandum No.884 5
Evaluation of ECMWF forecasts

the extratropics drops below 45%. The threshold has been chosen in such a way that the score measures
the skill at a lead time of 3–4 days. For comparison the same score is shown for ERA5. The top right
panel shows the score difference between HRES and ERA5. The bottom left panel shows the lead time
at which the CRPSS for the probability forecast of precipitation accumulated over 24 hours over the
extratropics drops below 10%, the bottom right panel shows the lead time where the Diagonal Skill
Score (DSS) drops below 20%. The ENS thresholds have been chosen in such a way that the scores
measure the skill at a lead time of about 7 days. All plots are based on verification against SYNOP
observations.
The deterministic precipitation forecast has reached its highest level of skill so far. There is considerable
variation in the score due to atmospheric variability, as shown by comparison with the ERA5 reference
forecast (black line in Figure 21, top left panel). By taking the difference between the operational and
ERA5 scores, much of this variability is removed, and the effect of model upgrades is seen more clearly
(upper right panel in Figure 21). The positive effect of cycle 46r1 shows up as a substantial increase
over the year 2019.
The probabilistic precipitation headline score CRPSS (lower left panel in Figure 21) shows a long-term
improvement as well. However, the positive effect from cycle 46r1 is not as readily seen. It should be
noted that in addition to the difference HRES vs ENS also the scores used (SEEPS vs CRPSS) measure
different aspects of the forecast. SEEPS, as a categorical score in probability space, does not penalize
errors at high precipitation values as much as the CRPSS. The DSS (lower right panel) measures, similar
to SEEPS, errors in probability space and puts more weight on the discrimination aspect of the forecast,
while the CRPSS is more sensitive to the reliability/calibration of the forecast. The discrimination ability
of the ENS has in fact reached its highest value so far in 2020 (as seen in the DSS), but the reliability
has decreased somewhat so that the CRPSS has not increased in the same manner.
ECMWF performs a routine comparison of the precipitation forecast skill of ECMWF and other centres
for both the high-resolution and the ensemble forecasts using the TIGGE data archived in the
Meteorological Archival and Retrieval System (MARS). Results using these same headline scores for
the last 12 months show both the HRES and ENS leading with respect to the other centres (Figure 22).
ECMWF’s probabilistic precipitation forecasts retain positive skill beyond day 9.
Trends in mean error (bias) and standard deviation for 2 m temperature, 2 m dewpoint, total cloud cover,
and 10 m wind speed forecasts over Europe are shown in Figure 23 to Figure 26. Verification is
performed against SYNOP observations. The matching of forecast and observed value uses the nearest
grid-point method. A standard correction of 0.0065 K m-1 for the difference between model orography
and station height is applied to the temperature forecasts.
For 2 m temperature (Figure 23), the daytime negative bias in spring has been reduced, while the level
of error standard deviation has not changed much. For 2 m dewpoint (Figure 24), the error standard
deviation has increased recently. For total cloud cover (Figure 25) there has been little change, both in
terms of error standard deviation and bias. The error standard deviation of 10 m wind speed has slightly
decreased (Figure 26).
ERA5 is useful as a reference forecast for the HRES, as it allows filtering out some of the effects of
atmospheric variations on scores. Figure 27 shows the evolution of skill at day 5 relative to ERA5 in the
northern hemisphere extratropics for various upper-air and surface parameters. The metric used is the

6 Technical Memorandum No.884
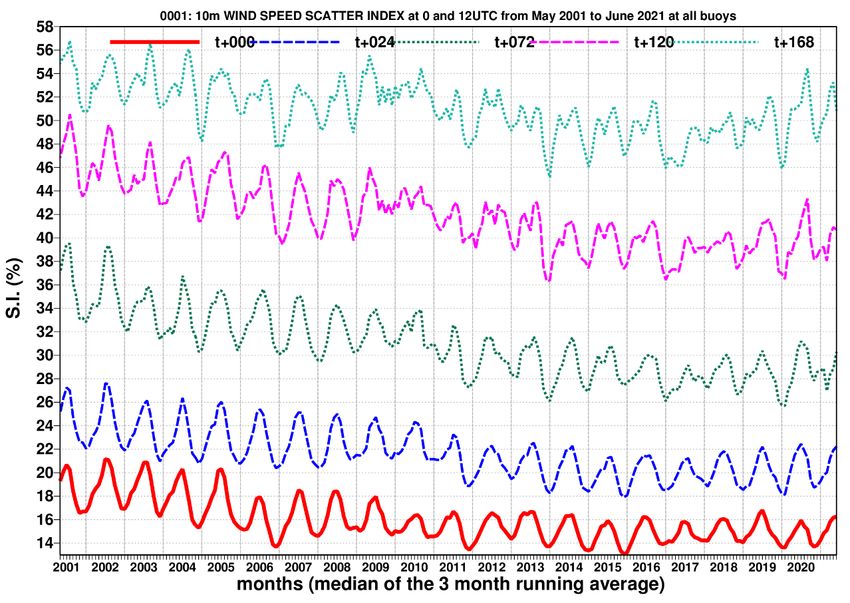
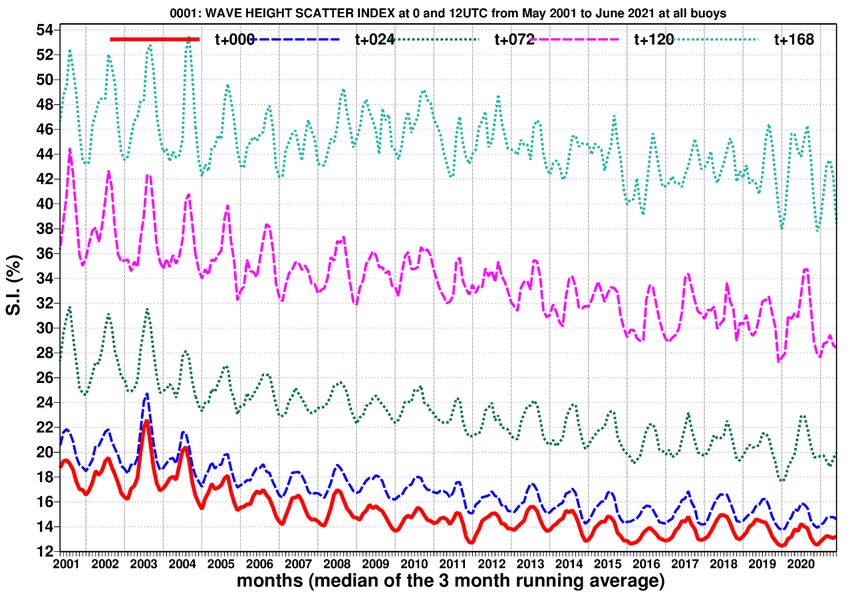
Evaluation of ECMWF forecasts

error standard deviation. Curves show 12-month running mean values. Improvements in near-surface
variables are generally smaller than those for upper-air parameters, partly because they are verified
against SYNOP, which implies a certain representativeness mismatch that is a function of model
resolution. For the upper-air variables (verification against analysis), the positive effect from 46r1 is
visible but there is a large drop in the second half of 2020 not tied to a particular model cycle. This has
been investigated and appears to be related to atmospheric variability, notably an unusually high Arctic
Oscillation index in JFM 2020. With this flow pattern, the HRES outperformed ERA5 somewhat more
than usual during this particular winter period. A similar feature (although less pronounced) has been
observed for some of the other centres. The actual improvement from 46r1 is therefore closer to the
difference in skill after and before the ‘top-hat’ shape.
The fraction of large 2 m temperature errors in the ENS has been adopted as an additional ECMWF
headline score. An ENS error is considered ‘large’ whenever the CRPS exceeds 5 K. Figure 28 shows
that in the annual mean (red curve) this fraction has decreased from about 7% to 4.5% over the last 15
years, and that there are large seasonal variations, with values in winter more than twice as high as in
summer. The beneficial effect of the resolution upgrade in 2016 is apparent, and some smaller
improvements were achieved by more recent model upgrades.
A similar measure of the skill in predicting large 10 m wind speed errors in the ENS is shown in Figure
29. Here, a threshold of 4 m/s for the CRPS is used, to obtain similar fractions as for temperature. As
for temperature, the 2016 resolution upgrade resulted in a substantial decrease of the large error fraction.
It is not yet clear whether the most recent further improvement driven by the winter 2020-21 indicates
an actual reduction in skill or is mainly due to atmospheric variability.

4.2 Ocean waves
The quality of the ocean wave model analysis and forecast is shown in the comparison with independent
ocean buoy observations in Figure 30. While errors in 10 m wind speed have not become smaller in the
last 2-3 years, wave height forecasts show a continued improving trend. This is also seen in the
verification against analysis (Figure 31). Across lead times, forecast skill has reached the highest level
so far.
ECMWF is the WMO Lead Centre for Wave Forecast Verification, and in this role, it collects forecasts
from wave forecasting centres to verify them against buoy observations. The forecast dataset has now
become sufficiently long such that meaningful time-series plots can be shown. In the extratropics (Figure
32), ECMWF generally leads other centres in significant wave height, while for peak period ECMWF
is within the bundle of models. In the tropics (Figure 33), ECMWF is narrowly leading in terms of peak
period, and ranking 2nd for significant wave height. For lead times other than the 72 h shown, the
ranking is similar. The difference in ranking between extratropics and tropics is partially due to different
wave characteristics and partly due to the different distribution of buoys in terms of proximity to coasts
between extratropics and tropics.
A comprehensive set of wave verification charts is available on the ECMWF website at
http://www.ecmwf.int/en/forecasts/charts
under ‘medium-range verification’ (select parameter ‘Ocean waves’). Verification results from the
WMO Lead Centre for Wave Forecast Verification can be found at

Technical Memorandum No.884 7
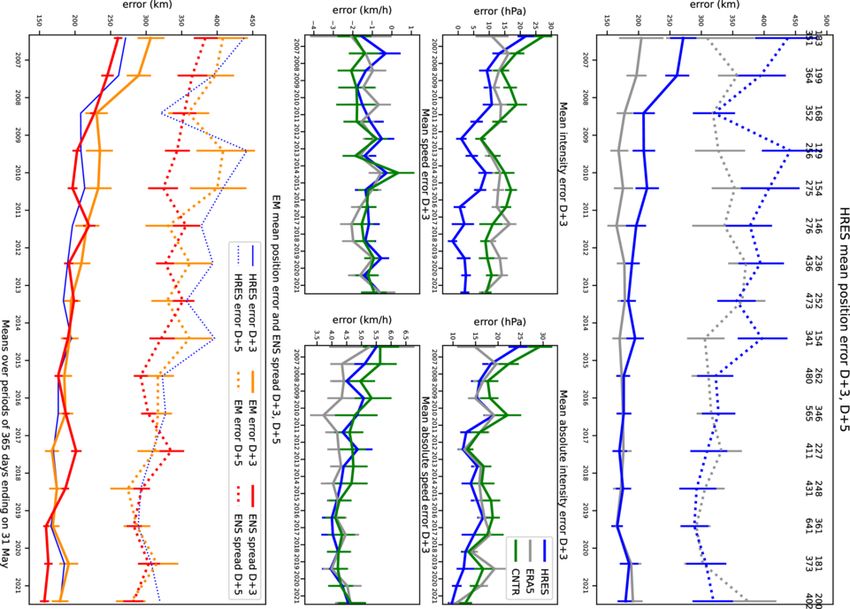
Evaluation of ECMWF forecasts

https://confluence.ecmwf.int/display/WLW/WMO+Lead+Centre+for+Wave+Forecast+Verification+L
C-WFV

5 Severe weather
Supplementary headline scores for severe weather are:
• The skill of the Extreme Forecast Index (EFI) for 10 m wind speed verified using the relative
operating characteristic area (Section 5.1)
• The tropical cyclone position error for the high-resolution forecast (Section 5.2)

5.1 Extreme Forecast Index (EFI)
The Extreme Forecast Index (EFI) was developed at ECMWF as a tool to provide early warnings for
potentially extreme events. By comparing the ensemble distribution of a chosen weather parameter to
the model’s climatological distribution, the EFI indicates occasions when there is an increased risk of
an extreme event occurring. Verification of the EFI has been performed using synoptic observations
over Europe from the GTS. An extreme event is judged to have occurred if the observation exceeds the
95th percentile of the observed climate for that station (calculated from a moving 15-year sample). The
ability of the EFI to detect extreme events is assessed using the relative operating characteristic (ROC).
The headline measure, skill of the EFI for 10 m wind speed at forecast day-4 (24-hour period 72–96
hours ahead), is shown by the blue lines in the left column of Figure 34 (top), together with results for
days 1–3 and day 5. Corresponding results for 24-hour total precipitation (centre) and 2 m temperature
(bottom) are shown as well. Each plot contains seasonal values, as well as the four-season running mean,
of ROC area skill scores. For all three parameters, the 12-month average skill at day 5 (red curves) has
reached the highest values ever in 2020-21. This has been achieved even for 2m temperature, where the
absolute level of skill was already above 0.9 in recent years.
A complementary way of verifying extremes is to use the Diagonal Elementary Skill Score DESS
(Bouallegue et al., 2018), as shown in the right column of Figure 34 for the same three variables. It is
based on verification in probability space and, like the ROC area, it emphasizes the discrimination aspect
of the forecast. As for the EFI, the 95th quantile is used, but for wind and temperature, instantaneous
rather than daily averages are used. Another difference between the two methods is that in the
computation of the DESS, observation uncertainty (representativeness) has been explicitly taken into
account using the method described in Bouallegue et al. (2020).
It can be seen that also in terms of the DESS metric, forecast skill has continued to increase in recent
years. Medium-range (day 5, red curves) performance has reached new high points for all three
parameters in 2020-21.

5.2 Tropical cyclones
The tropical cyclone position error for the 3-day high-resolution forecast is one of the two supplementary
headline scores for severe weather. The average position errors for the high-resolution medium-range
forecasts of all tropical cyclones (all ocean basins) are shown in Figure 35. Errors in the forecast central

8 Technical Memorandum No.884
Evaluation of ECMWF forecasts

pressure of tropical cyclones are also shown. The comparison of HRES and ENS control (central four
panels) demonstrates the benefit of higher resolution for some aspects of tropical cyclone forecasts.
The HRES position error at day 3 (top panels, Figure 35) has slightly decreased compared to the previous
year but not yet reached the low level of two years earlier. At day 5, errors have increased. However,
comparison with ERA5 (grey curves) shows that this is due to variations in predictability. Relative to
ERA5, the HRES has improved both at day 3 and at day 5. The HRES mean absolute error of intensity
has decreased as well, but comparison with ERA5 shows that this improvement has been smaller than
for ERA5.
The bottom panel of Figure 35 shows the spread and error of ensemble forecasts of tropical cyclone
position. For reference, the HRES error is also shown. At day 3, the forecast continues to be slightly
underdispersive, however for day 5 the match between spread and error is very good.
The ensemble tropical cyclone forecast is presented on the ECMWF website as a strike probability: the
probability at any location that a reported tropical cyclone will pass within 120 km during the next
240 hours. Verification of these probabilistic forecasts for the three latest 12-month periods is shown in
Figure 36. Results show a decrease in reliability compared to the two previous years (top panel). Skill
is shown by the ROC and the modified ROC, the latter using the false alarm ratio (fraction of yes
forecasts that turn out to be wrong) instead of the false alarm rate (ratio of false alarms to the total
number of non-events) on the horizontal axis. This removes the reference to non-events in the sample
and shows more clearly the reduction in false alarms in those cases where the event is forecast. In terms
of ROC, strike probability skill has slightly increased, while in terms of modified ROC, results are in-
between those of the previous two years.

6 Monthly and seasonal forecasts
6.1 Monthly forecast verification statistics and performance
Figure 37 shows the probabilistic performance of the monthly forecast over the extratropical northern
hemisphere for summer (JJA, top panels) and winter (DJF, bottom panels) seasons for week 2 (days 12–
18, left panels) and week 3+4 (days 19–32 right panels). Curves show the ROC score for the probability
that the 2 m temperature is in the upper third of the climate distribution in summer, and in the lower
third of the climate distribution in winter. It is a measure of the ability of the model to predict warm
anomalies in summer and cold anomalies in winter. For reference, the ROC score of the persistence
forecast is also shown in each plot. Forecast skill for week 2 exceeds that of persistence on average by
5-10%, for weeks 3 to 4 (combined) by 0-5%. In weeks 3 to 4 (14-day period), summer warm anomalies
appear to have slightly higher predictability than winter cold anomalies. In 2020, forecast skill above
persistence was generally quite high and near the upper end of values seen in the past. Week 2 forecast
skill for winter cold anomalies has been the highest so far in absolute terms.
Because of the low signal-to-noise ratio of real-time forecast verification in the extended range (Figure
37), re-forecasts are a useful additional resource for documenting trends in skill. Figure 38 shows the
skill of the ENS in predicting 2 m temperature anomalies in week 3 in the northern extratropics. This is
an additional headline score of ECMWF which was recommended by the TAC Subgroup on
Verification. Verification against both SYNOP observations and ERA5 analyses shows that there has

Technical Memorandum No.884 9
Evaluation of ECMWF forecasts

been a substantial increase in skill from 2005-2012, and little change (against analysis), and a slight
decrease (against observations) thereafter. However, a marked increase is seen in 2020, which is mainly
due to ERA5 replacing ERA-Interim as initial condition for the reforecasts. Due to this change, the
reforecast skill has in a way ‘caught up’ again and has become more representative of real-time forecast
skill. Note also that the verification is based on a sliding 20-year period and is therefore less sensitive to
changes from year to year than the real-time forecast evaluation, but some sensitivity remains, e.g. due
to major El Niño events falling within, or dropping out of, the sliding period.
In 2021, skill has increased even further, which appears to be a combination of the switch to ERA5
initial conditions (only 9 months of which were included in the 2020 value), the sliding period, and
possibly some beneficial effect from model cycle 47r1, although according to e-suite evaluation no
significant improvement was expected in terms of this specific score.
An evaluation of forecast skill from the medium to the extended range in terms of large-scale Euro-
Atlantic regimes and their effect on severe cold anomalies in Europe has been given by Ferranti et al.
(2018).
Comprehensive verification for the monthly forecasts is available on the ECMWF website at:
http://www.ecmwf.int/en/forecasts/charts

6.2 Seasonal forecast performance

6.2.1 Seasonal forecast performance for the global domain
The current version SEAS5 of the seasonal component of the IFS (implemented in November 2017)
includes updated versions of the atmospheric (IFS) and interactive ocean (NEMO) models and adds the
interactive sea ice model LIM2. While re-forecasts span 36 years (from 1981 to 2016), the re-forecast
period used to calibrate the forecasts when creating products uses the more recent period 1993 to 2016.
Compared to the previous version, SEAS5 shows an improvement in SST drift, especially in the tropical
Pacific, and improvements in the prediction skill of Arctic sea ice.
A set of verification statistics based on re-forecast integrations from SEAS5 has been produced and is
presented alongside the forecast products on the ECMWF website at
www.ecmwf.int/en/forecasts/charts

by choosing ‘Verification’ under the header ‘Long Range’. A comprehensive user guide for SEAS5 is
provided at:

https://www.ecmwf.int/sites/default/files/medialibrary/2017-10/System5_guide.pdf

6.2.2 The 2019–2020 El Niño forecasts
Summer and autumn of 2020 were characterized by a switch from positive to negative SST anomalies
in the eastern tropical Pacific. While this scenario was among those given by the SEAS5 ensemble
forecast in May 2020 (Figure 39, top row), the model suggested rather a smaller magnitude of the
negative anomalies, in particular the forecast issued in August 2020 (Figure 39, 2nd row). The forecast
issued in autumn, on the other hand, predicted some further cooling, whereas the La Nina conditions

10 Technical Memorandum No.884
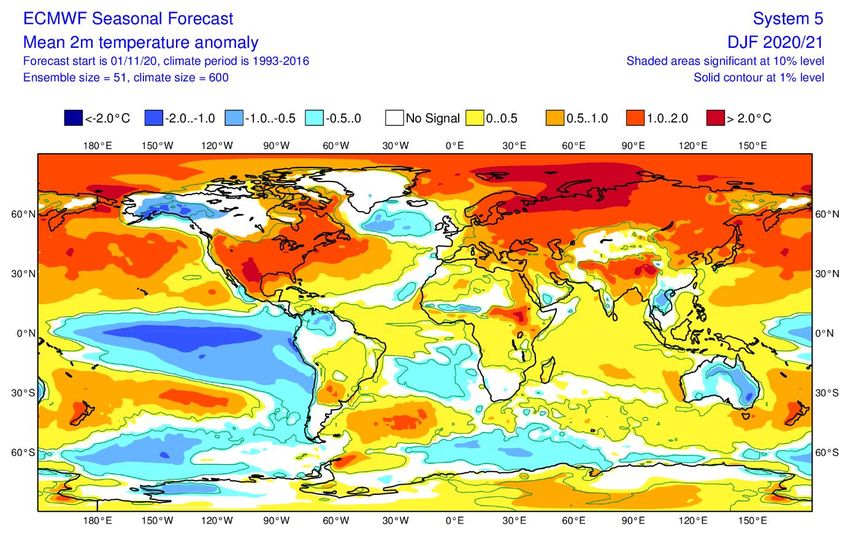
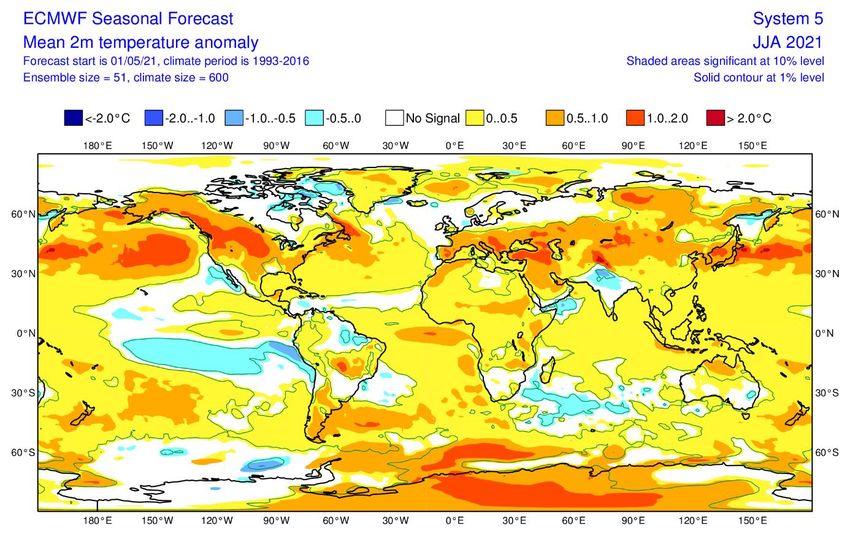
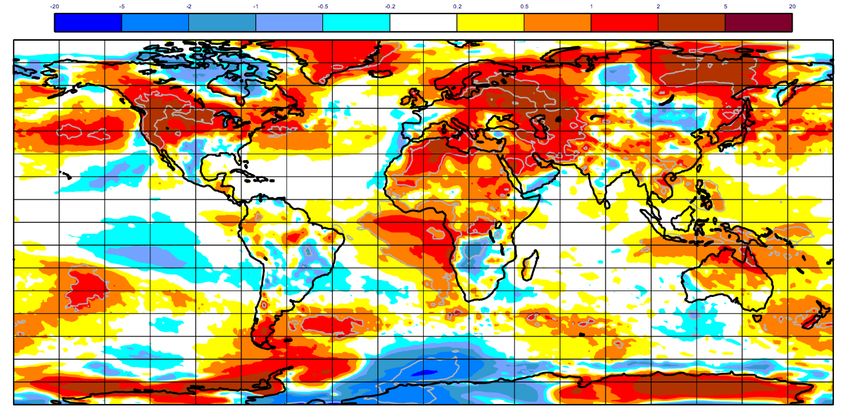
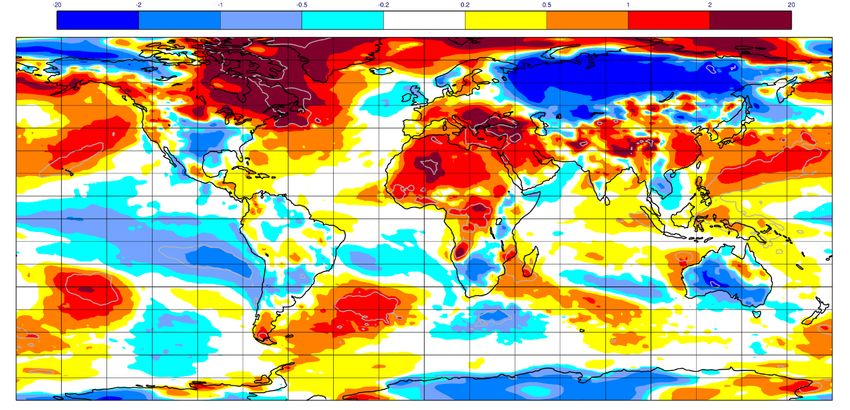
Evaluation of ECMWF forecasts

had actually reached their peak already in October 2020. The forecast of the return to neutral/warm
conditions in the beginning of 2021 was then well predicted. The C3S multi-model ensemble, due to its
naturally larger spread, better covers the observed evolution but also provides less clear guidance
because of its large spread.

6.2.3 Tropical storm predictions from the seasonal forecasts
The 2020 Atlantic hurricane season had a total of 30 named storms, which is the highest number
recorded, including 14 hurricanes and 7 major hurricanes. The accumulated cyclone energy index (ACE)
was about 150% of the past 10-year (2010-2019) climate average (Figure 40) which makes it a very
active, but not record-breaking season. Seasonal tropical storm predictions from SEAS5 indicated a
normal level of activity over the Atlantic (ACE of about 100% (+/- 40%) of the past 10-year average).
Similarly, the number of tropical storms (30) which formed in 2020 was strongly underpredicted (11.4)
by SEAS5. The following forecasts, issued in July and August, also predicted a normal or slightly below
average season. This poor seasonal forecast can be related to the difficulty of SEAS5 to properly
reproduce long-term trends and the lower impact of Atlantic SSTs on tropical storm frequency in
SEAS5. In 2021, the SEAS5 products for tropical cyclones were revised to better account for the
forecast’s inability to capture the observed trends. The correction involved generating forecast
anomalies with respect to the most recent ten years, rather than the fixed period 1993–2016 as was the
case previously.

Figure 41 shows that SEAS5 predicted slightly above average activity over the eastern North Pacific,
and below average activity over the western North Pacific (ACE of about 80% of the 2010-2019 climate
average). The 2020 western Pacific typhoon season was a slightly below-average season producing 23
storms, 10 typhoons, with an ACE about 20% below average, which is consistent with the SEAS5
forecast. The eastern North Pacific hurricane season was a below-average season with an ACE 20%
lower than climatology, while SEAS5 predicted normal tropical storm activity.

6.2.4 Extratropical seasonal forecasts
In contrast to the year before, where a very strong positive phase of the Indian Ocean Dipole (IOD)
increased global long-range forecast skill, the seasonal forecast for boreal winter 2020-21 was generally
poor over extratropical continents. Most notably, the strong cold anomaly over large parts of Siberia
was not predicted. Here we compare an ensemble mean forecast with the actual outcome, so we cannot
expect the magnitude of the observed anomalies to be captured, but also in terms of spatial patterns there
was limited correspondence between forecast and analysis (Figure 42). Similar to SEAS5, most other
centres predicted a warm anomaly in Siberia where a cold anomaly was observed. Some centres showed
neutral conditions, so in a relative sense performed better. It is also worth noting that the coldest anomaly
related to La Nina was located along the equator in the SEAS5 forecast, but further south in the analysis.
Summer 2m temperature anomalies (Figure 43) were predicted reasonably well in terms of spatial
pattern in North America. In Eurasia, however, the large positive anomaly stretching from Russia into
Eastern and Northern Europe was not captured.

Technical Memorandum No.884 11
Evaluation of ECMWF forecasts

Since the ensemble mean carries only part of the information provided by an ensemble, we also look at
the forecast distribution in the form of quantile (climagram) plots. Climagrams for Northern and
Southern Europe for winter 2020-21 and summer 2021 are shown in Figure 44. Red squares indicate
observed monthly anomalies. The November 2020 forecast for the winter season 2020-21 gave some
indication of the warm anomalies observed both in Northern and Southern Europe in early winter.
However, the shift to pronounced cold anomalies in Northern Europe in January and February was not
captured. The May 2021 forecast for summer 2021 gave little indication of the large warm anomalies
observed in Northern Europe, while the mode modest positive anomalies in Southern Europe were
predicted well.

12 Technical Memorandum No.884
Evaluation of ECMWF forecasts

Figure 1: Summary score card for IFS Cycle 47r2. Score card for HRES cycle 47r2 versus cycle 47r1 verified by
the respective analyses and observations at 00 and 12 UTC for 619 forecast runs in the period May 2020 to April
2021. Yellow colouring indicates that symbols refer to the second score indicated at the top of the column.

Technical Memorandum No.884 13
Evaluation of ECMWF forecasts

Figure 2: Summary ENS score card for IFS Cycle 47r2. Score card for ENS cycle 47r2 versus cycle 47r1 verified
by the respective analyses and observations at 00 UTC for 408 ENS forecast runs in the period November 2019 to
April 2021.

14 Technical Memorandum No.884
Evaluation of ECMWF forecasts

Figure 3: Impact of increased vertical resolution (Tco319L137 vs Tco319L91) on the real-time multivariate
Madden-Julian Oscillation index (Wheeler and Hendon, 2004) as a function of forecast lead time. Left: changes
in the fair version of the continuous ranked probability skill score (FCRPSS), where positive values indicate
increased RMM skill with L137. Right: changes in the mean amplitude of the bivariate RMM index, where positive
values indicate increased RMM amplitude with L137. See also Rodwell et al. (2021).

Technical Memorandum No.884 15
Evaluation of ECMWF forecasts

 Europe

 NH

 SH

Figure 4: Primary headline score for the high-resolution forecasts. Evolution with time of the 500 hPa geopotential
height forecast performance – each point on the curves is the forecast range at which the monthly mean (blue lines)
or 12-month mean centred on that month (red line) of the forecast anomaly correlation (ACC) with the verifying
analysis falls below 80% for Europe (top), northern hemisphere extratropics (centre) and southern hemisphere
extratropics (bottom).

16 Technical Memorandum No.884
Evaluation of ECMWF forecasts

 NH

 SH

Figure 5: Root mean square (RMS) error of forecasts of 500 hPa geopotential height (m) at day 6 (red), verified
against analysis. For comparison, a reference forecast made by persisting the analysis over 6 days is shown (blue).
Plotted values are 12-month moving averages; the last point on the curves is for the 12-month period August 2020–
July 2021. Results are shown for the northern extra-tropics (top), and the southern extra-tropics (bottom).

Technical Memorandum No.884 17
Evaluation of ECMWF forecasts

 Europe

 NH

Figure 6: A measure of inconsistency of the 500 hPa height forecasts over Europe (top) and northern extratropics
(bottom). Curves show the monthly average RMS difference between forecasts for the same verification time but
initialised 24 h apart, for 96–120 h (blue) and 120–144 h (red). 12-month moving average scores are also shown
(in bold).

18 Technical Memorandum No.884
Evaluation of ECMWF forecasts

 50 hPa temperature

 50 hPa wind speed

Figure 7: Model scores for temperature (top) and wind (bottom) in the northern extratropical stratosphere. Curves
show the monthly average RMS temperature and vector wind error at 50 hPa for one-day (blue) and five-day (red)
forecasts, verified against analysis. 12-month moving average scores are also shown (in bold).

Technical Memorandum No.884 19
Evaluation of ECMWF forecasts

 RMSE(ERA5) - RMSE(HRES)

 ACC(HRES) - ACC(ERA5)

Figure 8: Stratospheric scores at a lead time of +144 h. Top: model intercomparison of the 100 hPa temperature
RMSE in the northern extratropics. Centre: difference in RMSE of geopotential between ERA5 and HRES at four
different stratospheric levels. Bottom: difference in anomaly correlation of geopotential between HRES and ERA5
at four different stratospheric levels. Curves in the top plot are 3-month running averages and in the other two plots
12-month running averages.

20 Technical Memorandum No.884
Evaluation of ECMWF forecasts

 Europe

 N Hemisphere Extratropics

Figure 9: Primary headline score for the ensemble probabilistic forecasts. Evolution with time of 850 hPa
temperature ensemble forecast performance, verified against analysis. Each point on the curves is the forecast
range at which the 3-month mean (blue lines) or 12-month mean centred on that month (red line) of the continuous
ranked probability skill score (CPRSS) falls below 25% for Europe (top), northern hemisphere extratropics
(bottom).

Technical Memorandum No.884 21
Evaluation of ECMWF forecasts

Figure 10: Ensemble spread (standard deviation, dashed lines) and RMS error of ensemble-mean (solid lines) for
winter 2020–2021 (upper figure in each panel), and differences of ensemble spread and RMS error of ensemble
mean for last three winter seasons (lower figure in each panel, negative values indicate spread is too small);
verification is against analysis, plots are for 500 hPa geopotential (top) and 850 hPa temperature (bottom) over the
extratropical northern hemisphere for forecast days 1 to 15.

22 Technical Memorandum No.884
Evaluation of ECMWF forecasts

Figure 11: Ensemble spread reliability of different global models for 500 hPa geopotential for the period August
2020–July 2021 in the northern (top) and southern (bottom) hemisphere extra-tropics for day 1 (left) and day 6
(right), verified against analysis. Circles show error for different values of spread, stars show average error-spread
relationship.

Technical Memorandum No.884 23
Evaluation of ECMWF forecasts

Figure 12: As Figure 11 for 850 hPa temperature, and including the tropics.

24 Technical Memorandum No.884
Evaluation of ECMWF forecasts

Figure 13: Skill of the ENS at day 5 (top) and day 10 (bottom) for upper-air parameters in the northern extra-
tropics, relative to a Gaussian-dressed ERA5 forecast. Values are running 12-month averages, and verification is
performed against own analysis.

Technical Memorandum No.884 25
Evaluation of ECMWF forecasts

 200 hPa

 850 hPa

Figure 14: Forecast performance in the tropics. Curves show the monthly average RMS vector wind errors at
200 hPa (top) and 850 hPa (bottom) for one-day (blue) and five-day (red) forecasts, verified against analysis. 12-
month moving average scores are also shown (in bold).

26 Technical Memorandum No.884
Evaluation of ECMWF forecasts

Figure 15: WMO-exchanged scores from global forecast centres. RMS error of 500 hPa geopotential height over
northern (top box) and southern (bottom box) extratropics. In each box the upper plot shows the two-day forecast
error and the lower plot shows the six-day forecast error of model runs initiated at 12 UTC. Each model is verified
against its own analysis. JMA = Japan Meteorological Agency, CMC = Canadian Meteorological Centre, UKMO
= the UK Met Office, KMA = Korea Meteorological Administration, NCEP = U.S. National Centers for
Environmental Prediction, DWD = Deutscher Wetterdienst.

Technical Memorandum No.884 27
Evaluation of ECMWF forecasts

Figure 16: WMO-exchanged scores for verification against radiosondes: 500 hPa height (top) and 850 hPa wind
(bottom) RMS error over Europe and North Africa (annual mean August 2020–July 2021) of forecast runs initiated
at 12 UTC.

28 Technical Memorandum No.884
Evaluation of ECMWF forecasts

Figure 17: As Figure 16 for the northern hemisphere extratropics.

Technical Memorandum No.884 29
Evaluation of ECMWF forecasts

Figure 18: WMO-exchanged scores from global forecast centres. RMS vector wind error over tropics at 250 hPa
(top box) and 850 hPa (bottom box). In each box the upper plot shows the two-day forecast error and the lower
plot shows the six-day forecast error of model runs initiated at 12 UTC. Each model is verified against its own
analysis.

30 Technical Memorandum No.884
Evaluation of ECMWF forecasts

Figure 19: As Figure 18 for verification against radiosonde observations.

Technical Memorandum No.884 31
Evaluation of ECMWF forecasts

 CAMS

Figure 20: Anomaly correlation of 500 hPa geopotential in the northern hemisphere extratropics at day 5.
CAMS forecast (red, dashed) shown in comparison to the HRES (red) and forecasts from other global
centres.

 SEEPS HRES SEEPS difference

 ERA5 HRES – ERA5

 CRPSS DSS

Figure 21: Supplementary headline scores (left column) and additional metrics (right column) for deterministic
(top) and probabilistic (bottom) precipitation forecasts. The evaluation is for 24-hour total precipitation verified
against synoptic observations in the extratropics. Curves show the number of days for which the centred 12-month
mean skill remains above a specified threshold. The forecast day on the y-axis is the end of the 24-hour period
over which the precipitation is accumulated. The black curve in the top left panel shows the deterministic headline
score for ERA5, and the top right panel shows the difference between the operational forecast and ERA5 (blue).
Probabilistic scores in the bottom row are the Continuous Ranked Probability Skill Score (CRPSS) and the
Diagonal Skill Score (DSS).

32 Technical Memorandum No.884
Evaluation of ECMWF forecasts

 HRES precipitation - SEEPS

 ENS precipitation - CRPSS

Figure 22: Comparison of precipitation forecast skill for ECMWF (red), the Met Office (UKMO, blue), Japan
Meteorological Agency (JMA, magenta) and NCEP (green) using the supplementary headline scores for
precipitation shown in Figure 21. Top: deterministic; bottom: probabilistic skill. Curves show the skill computed
over all available synoptic stations in the extratropics for forecasts from August 2020–July 2021. Bars indicate
95% confidence intervals.

Technical Memorandum No.884 33
Evaluation of ECMWF forecasts

 2-m temperature

Figure 23: Verification of 2 m temperature forecasts against European SYNOP data on the GTS for 60-hour (night-
time, blue) and 72-hour (daytime, red) forecasts. Lower pair of curves shows bias, upper curves are standard
deviation of error.

 2-m dewpoint

Figure 24: Verification of 2 m dew point forecasts against European SYNOP data on the Global
Telecommunication System (GTS) for 60-hour (night-time, blue) and 72-hour (daytime, red) forecasts. Lower pair
of curves shows bias, upper curves show standard deviation of error.

34 Technical Memorandum No.884
Evaluation of ECMWF forecasts

 Total cloud cover

Figure 25: Verification of total cloud cover forecasts against European SYNOP data on the GTS for 60-hour
(night-time, blue) and 72-hour (daytime, red) forecasts. Lower pair of curves shows bias, upper curves show
standard deviation of error.

 10-m wind speed

Figure 26: Verification of 10 m wind speed forecasts against European SYNOP data on the GTS for 60-hour
(night-time, blue) and 72-hour (daytime, red) forecasts. Lower pair of curves shows bias, upper curves show
standard deviation of error.

Technical Memorandum No.884 35
Evaluation of ECMWF forecasts

Figure 27: Evolution of skill of the HRES forecast at day 5, expressed as relative skill compared to ERA5.
Verification is against analysis for 500 hPa geopotential (Z500), 850 hPa temperature (T850), and mean sea level
pressure (MSLP), using error standard deviation as a metric. Verification is against SYNOP for 2 m temperature
(T2M), 10 m wind speed (V10), and total cloud cover (TCC).

36 Technical Memorandum No.884
Evaluation of ECMWF forecasts

Figure 28: Evolution of the fraction of large 2m temperature errors (CRPS>5K) in the ENS at forecast day 5 in the
extratropics. Verification is against SYNOP observations. 12-month running mean shown in red, 3-month running
mean in blue.

Figure 29: Evolution of the fraction of large 10m wind speed errors (CRPS>4m/s) in the ENS at forecast day 5 in
the extratropics. Verification is against SYNOP observations. 12-month running mean shown in red, 3-month
running mean in blue.

Technical Memorandum No.884 37
Evaluation of ECMWF forecasts

Figure 30: Time series of verification of the ECMWF 10 m wind forecast (top panel) and wave model forecast
(wave height, bottom panel) verified against northern hemisphere buoy observations. The scatter index is the error
standard deviation normalised by the mean observed value; a three-month running mean is used.

38 Technical Memorandum No.884
Evaluation of ECMWF forecasts

Figure 31: Ocean wave forecasts. Monthly score and 12-month running mean (bold) of ACC for ocean wave
heights verified against analysis for the northern (top) and southern extratropics (bottom) at day 1 (blue), 5 (red)
and 10 (green).

Technical Memorandum No.884 39
Evaluation of ECMWF forecasts

Figure 32: Verification of forecasts of wave height and peak wave period (upper panels) at +72 h using
observations from wave buoys (lower panels). The scatter index (SI) is the standard deviation of error normalised
by the mean observed value; plots show the SI for the 3-month period March-May 2020. METFR: Météo-France;
JMA: Japan Meteorological Agency; ECCC: Environment and Climate Change Canada; BoM: Bureau of
Meteorology, Australia; LOPS: Laboratory for Ocean Physics and Satellite remote sensing, France; NZMS: New
Zealand Meteorological Service; DWD: Deutscher Wetterdienst, Germany; UKMO: Met Office, UK; NCEP:
National Centers for Environmental Prediction, USA; NIWA: National Institute of Water and Atmosperic
Research, New Zealand.

Figure 33: As Figure 32, but for the tropics.

40 Technical Memorandum No.884
Evaluation of ECMWF forecasts

 10-m wind speed

 24-h precipitation

 2-m temperature

Figure 34: Verification of Extreme Forecast Index (EFI) against analysis (left column). Top panel: skill of the EFI
for 10 m wind speed at forecast days 1 (first 24 hours) to 5 (24-hour period 96–120 hours ahead); skill at day 4
(blue line) is the supplementary headline score; an extreme event is taken as an observation exceeding 95th
percentile of station climate. Curves show seasonal values (dotted) and four-season running mean (continuous) of
relative operating characteristic (ROC) area skill scores. Centre and bottom panels on the left show the equivalent
ROC area skill scores for precipitation EFI forecasts and for 2 m temperature EFI forecasts. Diagonal elementary
skill score (DESS) for the 95th percentile for the same three variables, taking observation uncertainty into account
(right column).

Technical Memorandum No.884 41
Evaluation of ECMWF forecasts

Figure 35: Verification of tropical cyclone predictions from the operational high-resolution and ensemble forecast.
Results are shown for all tropical cyclones occurring globally in 12-month periods ending on 31 May. Verification
is against the observed position reported via the GTS. Top panel supplementary headline score – the mean position
error (km) of the three-day high-resolution forecast. The error for day 5 is included for comparison. Centre four
panels show mean error (bias) in the cyclone intensity (difference between forecast and reported central pressure;
positive error indicates the forecast pressure is less deep than observed), mean absolute error of the intensity and
mean and absolute error of cyclone motion speed for cyclone forecast both by HRES and ENS control. Bottom
panel shows mean position error of ensemble mean (mean of cyclones forecast by ensemble members) with respect
to the observed cyclone (orange curve) and ensemble spread (mean of distances of ensemble cyclones from the
ensemble mean; red curve); for comparison the HRES position error (from the top panel) is plotted as well (blue
curve). For reference, errors of tropical cyclone forecasts by ERA5 are shown in grey.

42 Technical Memorandum No.884
You can also read