Nutrient Intake, Excretion and Use Efficiency of Grazing Lactating Herds on Commercial Dairy Farms - MDPI
←
→
Page content transcription
If your browser does not render page correctly, please read the page content below
animals
Article
Nutrient Intake, Excretion and Use Efficiency of
Grazing Lactating Herds on Commercial Dairy Farms
Sharon R. Aarons 1, * , Cameron J. P. Gourley 1 and J. Mark Powell 2
 1   Agriculture Victoria Research, Ellinbank Dairy Centre, Victorian Department of Jobs, Precincts and Regions,
     1301 Hazeldean Road, Ellinbank, VIC 3821, Australia; Cameron.Gourley@agriculture.vic.gov.au
 2   US Dairy Forage Research Center, USDA Agricultural Research Service, 1925 Linden Drive West,
     University of Wisconsin, Madison, WI 53706, USA; jmpowel2@wisc.edu
 *   Correspondence: Sharon.Aarons@agriculture.vic.gov.au; Tel.: +61-4-1703-6998

 Received: 3 February 2020; Accepted: 24 February 2020; Published: 28 February 2020

 Simple Summary: Excess nutrients on dairy farms can affect soil and animal health and have negative
 impacts on the environment. More nutrients are usually brought onto farms in animal feed than in
 fertilizer and, as dairy cows do not efficiently use feed nutrients to produce milk, most consumed
 nutrients are excreted in dung and urine. Estimating nutrients excreted by cows relies on measuring
 feed and nutrient intake. However, measuring pasture nutrients consumed by cows that graze
 on commercial farms is complicated. We modified the ‘Feeding Standards’ approach to estimate
 daily pasture dry matter and nutrient intake and nutrients excreted using data and samples readily
 available on commercial dairy farms. These data were collected on five visits in different seasons
 from 43 grazing system farms located in diverse climatic zones. Although these herds graze daily,
 the lactating cows only obtained slightly more than half their dry matter intake from pasture. Each
 day, on average, we estimated that a grazing cow excretes 433 g nitrogen, 61 g phosphorus, 341 g
 potassium, 44 g sulphur, 92 g calcium and 52 g magnesium on these farms. Using this approach to
 estimate nutrients excreted by grazing animals on dairy farms can assist farmers improve nutrient
 distribution and fertilizer requirements.

 Abstract: Estimating excreted nutrients is important for farm nutrient management, but seldom
 occurs on commercial grazing system farms due to difficulties in quantifying pasture intake. Nitrogen
 (N), phosphorus (P), potassium (K), sulphur (S), calcium (Ca) and magnesium (Mg) intake, excretion
 and use efficiency of 43 commercial dairy herds grazing pasture were calculated to understand
 the range in nutrient intake and excretion in these systems. Milk production, feed (grazed and
 supplement), as well as farm and herd management data were collected quarterly on representative
 farms located in temperate, arid, subtropical and tropical regions of Australia. Lactating herd sizes
 on these farms averaged 267 (30 to 1350) cows, with an average daily milk yield of 22 (9 to 36)
 kg/cow per day and the herds walked from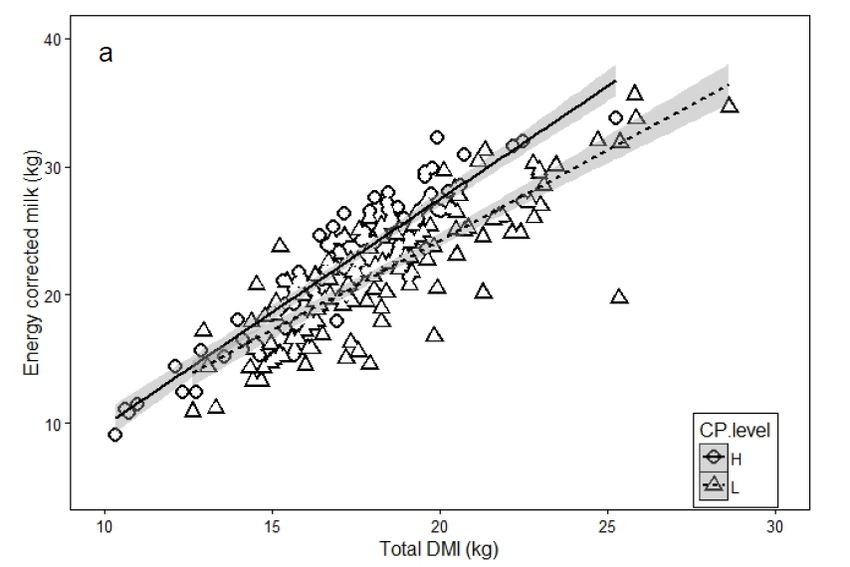
Animals 2020, 10, 390                                                                               2 of 20

 efficiencies by cows of N, P, K, S, Ca and Mg were 21%, 25%, 9%, 16%, 23% and 4%, respectively. These
 estimates of nutrient excretion and feed nutrient use efficiencies can be used to improve nutrient
 management on grazing system commercial dairy farms.

 Keywords: grazed pasture intake; supplementary feed; metabolizable energy; feed nutrient intake;
 macronutrients; animal nutrient use efficiency; manure; nitrogen; phosphorus; potassium

1. Introduction
     Nutrient accumulation that occurs on many dairy farms worldwide can lead to environmental
pollution, through gaseous emissions and nutrient losses to waterways [1]. In most dairy production
systems, imported feed contributes a greater source of nutrients than fertilizer inputs [2–4], and
even in grazed dairy systems, feed P and K were greater than fertilizer applications [5]. Substantial
inputs of feed nutrients along with the low use efficiencies by dairy cows of ingested nutrients
leads to greater proportions excreted in faeces and urine than exported in milk [6,7]. Consequently,
accounting for excreted nutrients is needed to ensure nutrient inputs at the farm scale are appropriately
managed for both environmental and production benefits. Quantifying excreted nutrients for improved
management of manure occurs more routinely in confinement-based systems due to the relative ease
in measuring dietary intakes, with this information used to meet environmental and production
objectives [7]. The relative ease of measuring DM intakes in confinement-based dairy production
systems has assisted with quantifying excreted nutrients for improved manure management [8], and
to meet environmental and production objectives (e.g., [9,10]). By contrast, measuring pasture intake
in grazing systems is more challenging due to the interactions of the grazing animal and feed sources
(pasture and supplements) as influenced by farm management practices [11]. Techniques such as
herbage estimation, internal or external markers, and calculation of net energy requirements have been
compared [12–14]. Methods such as alkane markers are better suited for research purposes, while
calculation of net energy requirements can be more easily used to estimate cow intakes on commercial
farms. The Cornell Net Carbohydrate and Protein System [15], and the GrazeIn [16] models have been
used to estimate pasture intake and milk yield, while the energy requirements to produce milk has
been used in a ‘back-calculation’ approach [17] to estimate pasture intake. By using these or similar
methods to calculate dietary intake, nutrient excretion on commercial dairy farms has been estimated.
The methods range from more data-intensive sampling strategies [10,18,19], where data were collected
on a small number of farms, to more rapid monitoring approaches, where data were collected from
larger numbers of farms [20]. Typically, however, pasture-based grazing systems were not included
in these studies, and where commercial farms with grazing herds were monitored, data were only
collected from a few farms [21]. In this paper, a methodology for estimating pasture dry matter and
nutrient intakes of grazing lactating herds that is based on metabolic requirements of the cows, and
which uses data readily collected from commercial dairy farms, is used to calculate excreted nutrients
and nutrient use efficiencies.

2. Materials and Methods
      Forty-three commercial dairy farms from a variety of grazing management systems in all climatic
zones of Australia were selected, from an initial pool of 124 dairy farms (Figure S1, see Gourley et al.
(5) for the detailed methodology). Briefly, a stratified-random process, rather than a random sampling
approach, was used to identify a diversity of farms. Six criteria used in farm selection were proportional
representation in the major dairy regions nationally, per hectare milk production, farm area (ha), use of
irrigation, soil P sorption and inclusion of organic farms. An iterative optimisation routine identified
44 farms, with one farm excluded due to insufficient data. The participating farmers were interviewed
on five separate occasions (summer, autumn, winter and spring 2008 and summer 2009), with feed
Animals 2020, 10, 390 3 of 20
and milk samples collected on the farms after the interviews. Data and sample collection typically
occurred over a relatively short period (2 to 3 h) at each interview.
2.1. Survey Data
Similar approaches combining collection of both farm management data and samples have
previously been used (e.g., [20,22]) to assess nutrient flows on dairy farms. In this study project, farmers
were always interviewed by the same trained technical staff, using a semi-structured questionnaire
designed for recording data about the production and intake of lactating herds present on the farm
at each interview. The farmers were asked about the amount of milk produced, cow numbers in the
herds, their stage of lactation, the average age of animals, and an estimated average weight of cows in
the lactating herd (Table S1). Diets provided to herds were described by the farmers, including the
types and estimates of the amounts consumed as well as estimates of wastage (Table S2). Data from
the survey (and feed and milk analyses) resulted in 227 herd records, as 6 farms milked two herds on
at least one visit and one farm milked two herds at all times.
2.2. Dietary Intake
The ‘Feeding Standards’ approach [17] for quantifying annual pasture dry matter intake (DMI)
was modified to calculate DMI at each interview date, based on the estimated metabolizable energy
(ME) requirements of the lactating herds,
where
MEPastureIntake (MJ/day) = METotalReq (MJ/day) - MESupplementfed (MJ/day) (1)
and
METotalReq = MEMaintenance + MEGraze + MEPregnancy + MEMilkProduced + MEActivity (2)
The equations for each calculation were as follows:
MEMaintenance (MJ/day) = 1.4 × 0.28 × ([LiveWt]0.75 ) × Exp (−0.03 × 2.5) ÷ [km ] × [NLactn1]
(3)
+ 1.4 × 0.28 × ([LiveWt]0.75 ) × Exp (−0.03 × 4.5) ÷ [km ] × [NLactn2+]
MEGrazing (MJ/day) = 0.1 × [MEMaintenance ] (4)
MEPregnancy (MJ/day) = [NMidLactn] × 349.16 × 0.0000576 × Exp(−0.0000576 × 69)
× Exp(349.22 − 349.16 × Exp(-0.0000576 × 69)) ÷ [kc ] + [NLateLactn] × 349.16 × 0.0000576 (5)
× Exp(−0.0000576 × 170) × Exp(349.22 − 349.16 × Exp(−0.0000576 × 170)) ÷ [kc ]
MEMilkProduced (MJ/day) = [NAnimals] × [MilkPerCow] × ((0.0381 × [Fat])
(6)
+ (0.0245 × [Protein]) + (0.0165 × [Lactose])) ÷ [kl ] × 1.1
MEActivity (MJ/day) = ((0.0026 + (0.028 × [Vert])) × [WalkDist] × [LiveWt] ÷ [km ]
(7)
× [NAnimals]) × [MilkingTimes] × 2
where
(i) [NLactn1] and [NLactn2+ ] are the number of cows in their first and in their second or greater
lactations, respectively;
(ii) [LiveWt] is the estimated liveweight of the cows and for the purposes of estimating daily energy
requirements is assumed to be constant for the day of visit to the farm;
(iii) [NMidLactn] and [NLateLactn] are the number of cows in mid and late lactation respectively,
where the lactation length was 305 days, divided evenly into early (102), mid (103 to 204) and late
(205+) lactation;Animals 2020, 10, 390 4 of 20
(iv) [MilkPerCow] is milk produced (L) per cow taking into consideration the number of heifers
[NLactn1] and older cows [NLactn2+ ];
(v) [WalkDist] is the distance walked (km) by the herd from the dairy shed to the middle of
each paddock;
(vi) [Vert] is the steepness factor according to Heard et al. [17], based on the representative terrain
(flat, undulating, steep) at each farm;
(vii) km : 0.02 × [MEDiet ] + 0.5;
(viii) kc : 0.133;
(ix) kl : 0.02 × [MEDiet ] + 0.4;
(x) MEDiet : 10 MJ/cow per day (Heard pers comm).
The ME consumed in supplements (MESupplementfed ) was summed for all supplements fed to
the lactating herd, accounting for estimates of wastage, and based on the ME concentration of all
supplements fed.
MESupplementfed (MJ/day) = DMISupplement × ME ConcSupplement (8)
Pasture DMI was calculated as
DMIPasture = MEPastureIntake ÷ ME ConcPasture (9)
using the MEPastureIntake as estimated in equation [1] and the ME concentration of the pasture samples
collected for each herd on each farm at each interview.
2.3. Nutrient Use Efficiency
Using the calculated pasture DMI, nutrients excreted (g/cow per day) were obtained by subtracting
total dietary nutrient intake from milk nutrients secreted. Animal nutrient use efficiencies were
calculated as the proportion of nutrients secreted in milk to those consumed.
Animal nutrient use efficiency (%) = Milk nutrient ÷ Nutrient Intake × 100 (10)
2.4. Sample Collection and Analysis
Feed and milk samples were collected on all farms after each interview for subsequent chemical
analysis. Approximately 400 mL of milk (from all milkings for the day) was collected after thorough
agitation of the vat (bulk tank), placed on ice, returned promptly to the laboratory and frozen (−20 ◦ C)
until chemical analysis. Separate grab samples of all dietary supplementary feeds (e.g., grains and
mixed concentrates, by-products, feed additives such as minerals, mixed rations, silage, hay) were
collected, totaling 830 samples. The exact weights of non-forage supplements provided by farmers to
herds in the dairy shed were confirmed by weighing (in triplicate) the amounts dispensed by feeders.
Where necessary the amounts stated by farmers were corrected to reflect the actual amounts dispensed
to the animals. A minimum of 20 grab samples of pasture (to post-grazing height) were collected
and composited from pastures representative of paddocks recently grazed by the lactating herd on
each farm.
Supplementary feeds and pasture samples were oven-dried (65 ◦ C, 72 h) then ground to pass
a 2 mm screen. Subsamples were dried at 100 ◦ C for 24 h for calculating percent DM. Feed and
milk samples were analysed by George Weston Technologies, Sydney, currently operating as Weston
Food Laboratories. Crude protein (CP) in feed and milk was measured according to AOAC methods
(CP ÷ 6.25 was used to calculate total N concentration in feed; CP ÷ 6.38 was used to calculate total N
concentration in milk) [23]. Total P, K, S, Ca and Mg in feed were measured by inductively coupled
plasma optical emission spectrometry after digestion in hydrochloric and nitric acid.Animals 2020, 10, 390 5 of 20
2.5. Data and Statistical Analysis
Data collected at each interview visit as well as sample analytical data were entered into an Access
(Microsoft Office, Armonk, NY, USA) database and queries based on the equations above were used to
calculate dietary and nutrient intakes, milk nutrient secretion, nutrient excretion and feed nutrient
use efficiencies. Energy corrected milk was calculated according to Tyrrell and Reid. [24], where the
density of milk was used to convert milk volume to kg.
ECM (kg) = (Milk yield (L) × 1.0295 × (376 × fat% + 209 × protein% + 948)) ÷ 3138 (11)
For 15 out of 227 records where milk fat and protein concentration data were not available, average
concentrations were calculated using either data from the other interview samples for a farm, if data
from more than three interviews were available (3 farms), and for three other farms using the average
of the whole dataset.
Statistical analyses were undertaken using Genstat 17 (VSN International, Wood Lane, Hemel
Hempstead, UK) and RStudio© 0.99.891 (R version 3.2.3), and RStudio and S-plus 8.1 (TIBCO Spotfire,
CA, USA) were used for graphical representation. Residual maximum likelihood (REML, Genstat)
was used to analyse relationships between nutrient excretion and farm characteristics, such as herd
size. The fixed model comprised an explanatory variate (e.g., herd size), or the explanatory variate
crossed with interview date or season (e.g., herd size × season), and the random model consisted
of the factor ‘farm’. In these analyses tests for fixed effects were determined by sequentially adding
terms to the fixed model. Although interviews were conducted on five occasions on each farm,
the herds at each interview consisted of different cows that were at different stages of lactation and
which received different diets. Consequently, ‘interviews’ were not nested in ‘farm’ in the random
model. Pearson correlation coefficient and linear regression analyses were performed in R using the
cor and lm functions, respectively. Linear regression analyses investigated relationships between
the explanatory variables total DMI or supplementary DMI and response variables ECM or FCE
(feed conversion efficiency; kg ECM/kg DMI). For analyses of relationships at each interview visit,
or different seasons, or for diets with low (L ≤ 20%) or high (H ≥ 20%) crude protein (CP), the data
were subset (e.g., lm(FCE~DMI, subset = (CP.level = “L”))). Correlation coefficients and p-values
were generated in a four column matrix using flattenSquareMatrix(cor.prob()). The regressions and
correlations were represented graphically or tabulated. All data met assumptions of normality and
constant variance based on residual graphs of histograms, fitted value and quantile plots.
3. Results
3.1. Dairy Farm Characteristics
The number of milking cows in each herd on these commercial farms for all interviews ranged
from 30 to 1350, with approximately three times as many cows in their second or greater lactation as
were in their first, and an estimated average age of the herds of 4 years old (Table 1). Most herds were
Friesian (20 farms), or Jersey/Friesian crosses (approximately 16 farms), with four farms milking Aussie
Red and Brown Swiss or Ayrshire cows and two farms milking Illawarra breeds. Across all interviews
(227 records), most cows were in mid lactation (193 records), while for 25 records, all or the majority of
the herd were in late lactation and for 19 records most or all animals were in early lactation. The herds
produced, on average, 22 kg ECM/cow per day, although the yield of the highest producing cows was
four times greater than the lowest. The distances the herds walked ranged from immediately adjacent
to the dairy shed to over 4 km one way. All terrain types (flat, undulating, steep) were recorded in this
study, and all paddocks on each farm were assigned the same terrain type. Similar numbers of the
farms were classified as flat (20) and as undulating (22) with only one farm classified as steep.Animals 2020, 10, 390 6 of 20
Table 1. Summary statistics for characteristics of milking herds and the 43 grazing system dairy farms
collected at the five interview dates.
Herd and Farm Characteristics Minimum Mean Median Maximum SD CV
Herd size 1 30 267 212 1350 202.2 76%
Number of lactating cows 2
Primiparous 0 66 55 230 46.5 71%
Multiparous 10 201 153 1330 178.3 89%
Early 0 68 35 850 114.0 169%
Mid 0 119 85 900 132.2 111%
Late 0 80 45 800 110.0 137%
Average age (y) 2.7 4.0 4.0 4.5 0.2 6%
Liveweight 3 (kg) 430 525 500 680 41.4 8%
Milk
Yield 4 (L/day) 7 21 22 36 5.7 27%
ECM 5 (kg/day) 9 22 22 36 5.3 24%
Protein (g/L) 30.9 33.1 33.0 38.3 1.57 5%
Fat (g/L) 36.5 40.9 40.2 51.3 2.97 7%
Distance walked (km) 0.00 0.99 0.84 4.08 0.662 67%
1 The number of cows in each herd on each farm at each visit, noting that on some visits to some farms, more
than one herd were present while other farms always had at least two herds. On most farms, the calving pattern
was seasonal or split, rather than year-round. 2 Number of lactating cows that are primiparous, multiparous, in
early (≤102 days), mid (>102, ≤ 204 days), late (>204, ≤ 305 days) lactation. 3 Liveweight estimated by the farmer.
4 Average milk volume produced per cow given by farmer. 5 ECM, energy corrected milk calculated as (milk yield
(L) × 1.0295 × (376 × fat (%) + 209 × protein (%) + 948))/3138) [25].
Of the calculated daily total ME (Table 2), per cow maintenance requirement ranged from 46
to 66 MJ/cow per day when the estimated per herd maintenance ME was divided by the number of
cows in each herd. Energy required for pregnancy was most variable (CV = 68%), as herds on seven
farms had all cows in early lactation (i.e., less than 102 days in milk) at one of the interview dates and
as such, were considered to be expending little energy in pregnancy at that time, while cows on the
remaining farms were in mid to late lactation and expended a maximum of 4.78 MJ/cow per day. The
calculated mean energy required for producing milk was approximately twice that for maintenance at
124.5 MJ/cow per day. The cows expended an average of 9 MJ/cow per day on walking, although this
ranged from 3.7 to 24.1 MJ/cow per day.
Table 2. Summary statistics of milk volume produced by the herd, and calculated per lactating cow
and per heifer, the calculated herd metabolizable energy (ME) required for maintenance, grazing,
pregnancy, milk production, activity, and total ME per cow for lactating cows at five occasions on
43 farms (n = 227).
Milk Produced Metabolizable Energy (MJ/Herd Per Day) Total ME
Summary
Statistics 1 /herd 2 /cow 3 /heifer Milk (MJ/Cow
L L L Maintenance Grazing Pregnancy Activity
Production Per Day)
Minimum 438 7 0 1571 157 0 2878 238 116
Mean 5937 23 18 14,590 1459 460 34,249 2646 195
Median 4218 23 18 11,473 1147 283 24,798 1595 194
Maximum 37,800 38 31 80,150 8015 4140 208,050 20,186 289
SD 5425.7 6.0 5.3 11,180.6 1118.1 522.8 30,284.9 2826.4 33.4
Var 29,438,659.6 36.3 27.7 125,006,498.3 1,250,065.0 273,271.8 917,172,365.3 7,988,323.0 1115.5
CV 91% 27% 29% 77% 77% 114% 88% 107% 17%
Skew 3.0 0.1 −0.5 2.4 2.4 3.3 2.9 2.8 0.3
Kurt 13.1 0.0 1.4 8.5 8.5 15.3 11.9 10.4 0.2
1 Calculated from the average per cow milk produced (Table 1) and the number of cows in the herd. 2 Calculated for
the number of multiparous cows in the herd. 3 Calculated for the primiparous cows in the herd.
3.2. Dietary Intake
Dairy farms in this study, while considered grazing-based systems, utilised various feeding
strategies, from complete dependence on pasture to total mixed rations, with diets containing a wideAnimals 2020, 10, 390 7 of 20
range of nutrient and energy contents (Table 3). Cows grazed at least 11 different types of pasture
and also grazed crops on some farms at some interview dates. Only herds on Farms 32, 33 and 34 at
the last interview date were not provided pasture and therefore did not graze. Similarly, Farms 1 and
36 did not provide supplements to their herd on at least one occasion over the study. Mean ME of
the different feeds was consistent across feed types, ranging between 8 and 13 MJ per day. However,
by-products were most variable in ME, with analysis of some individual feed types reporting 0 MJ/day
(e.g., vinegar, sea salt), while others were as high as 17 MJ/day (e.g., linseed meal). By-products also
had very variable N contents with soybean meal having highest concentrations, although the highest
mean N concentrations were observed for pasture. Forage crops had the highest mean K concentrations
followed closely by pasture which also had the greatest range in K concentration. Mineral supplements
contained the highest P, S, Ca and Mg concentrations and had the greatest range in values. For example,
lime feed supplements provided in a temperate region farm had the maximum P and Ca concentrations,
while a commercial mineral mix fed on a more arid region farm had the highest Mg concentration.
Both of these feed types were not a constant feature of the herds’ diets over the year of this study only
being supplied in small amounts and on three occasions on both farms.
Table 3. Mean nutrient (minimum-maximum) concentrations in samples of feeds (pasture and
supplements) consumed by grazing herds on five occasions on 43 dairy farms.
ME
Feed Types 1 Number N (%) P (%) K (%) S (%) Ca (%) Mg (%)
(MJ/kg DM)
3.7 0.45 2.8 0.34 0.59 0.31
Pasture 248 11 (7–13)
(1.0–5.8) (0.11–0.95) (0.5–5.9) (0.12–0.60) (0.11–2.21) (0.11–2.28)
2.5 0.57 0.6 0.21 1.15 0.45
Concentrates 163 13 (12–15)
(1.0–5.2) (0.14–1.99) (0.3–1.5) (0.10–0.46) (0.01–4.92) (0.03–2.35)
2.4 0.39 2.5 0.26 0.52 0.25
Silage 114 9 (7–11)
(1.1–4.4) (0.13–0.76) (0.7–4.5) (0.06–0.55) (0.12–1.09) (0.13–0.63)
1.8 0.25 1.7 0.19 0.48 0.21
Hay 94 8 (4–11)
(0.2–4.4) (0.01–0.66) (0.7–2.7) (0.04–0.64) (0.10–1.99) (0.07–0.87)
3.3 0.53 0.47 0.54 0.34
By-products 2 76 12 (0–17) 2 (0–5)
(0.1–8.5) (0.01–1.45) (0.02–1.33) (0.01–1.17) (0–0.74)
2.6 0.32 3.0 0.49 1.02 0.50
Crops 23 10 (8–11)
(1.4–3.9) (0.2–0.55) (1.4–6.5) (0.09–1.05) (0.30–1.85) (0.26–0.98)
2.6 0.40 0.6 0.19 0.24 0.23
Mixed grain 33 13 (11–16)
(1.4–3.5) (0.22–0.59) (0.4–0.8) (0.10–0.29) (0.04–0.90) (0.11–0.56)
2.5 0.36 0.6 0.17 0.11 0.15
Grain 32 13 (12–15)
(1.7–6.5) (0.22–1.19) (0.3–3.4) (0.09–0.73) (0.01–0.56) (0.10–0.60)
0.4 1.81 1.07 10 3.63
Mineral 3 30 9 (2–13) 0.6 (0–1.9)
(0.0–1.7) (0–3.99) (0–2.55) (0.01–40) (0–8.01)
2.7 0.45 1.9 0.25 0.90 0.28
TMR 4 12 9 (9–10)
(1.8–3.5) (0.28–0.55) (1.4–2.3) (0.18–0.30) (0.43–1.23) (0.25–0.31)
Organic 5 4 13 0.5 0.14 1.3 1.12 11.97 7.11
1 The range of feeds provided to lactating herds on farms at all five visits, where all feed types except pasture were
considered to be supplementary. More details can be found in Rugoho, et al. [26]. 2 By-products include a variety
of meals (soybean, canola, cottonseed, linseed), pea pollard, palm kernels, bread, citrus pulp, molasses, brewer’s
grain, apple cider vinegar, tomatoes, almond hulls, raw sugar and cod liver oil, fed at various interview dates on
16 farms. 3 In addition to several proprietary commercial mineral products, this feed type also included sea salt,
bicarb, limestone and urea fed on eight farms. 4 TMR—total mixed rations fed predominantly on one farm, but also
included hay and silage based feed on two other farms. 5 The organic feed type was a kelp/dolomite mix fed on one
farm at the first four interviews.
Supplement N, P, K, S, Ca and Mg intakes for all interview dates and farms averaged (range)
226 (7–667), 42 (2–155), 124 (3–511), 21 (1–72), 64 (2–216), and 28 (1–88) g/cow per day, respectively
(data not presented). On average, supplement nutrient intake on these farms was 42%, 50%, 36%, 42%,
53% and 51%, respectively, of total nutrient intakes and ranged from 0 to 100% for all nutrients.
Based on ME requirements of the cows and the total ME fed in supplements, calculated pasture
DMI ranged from 0.04 to 22.5 kg DM/cow per day, excluding those animals that did not access pasture
and therefore had no pasture intake (Table 4). Mean and ranges in pasture DMI were similar to those
for supplement DMI and constituted an average of 51% (median 53%) of total DMI for all farms.
Calculated pasture DM consumed showed a strong 1:1 relationship with farmer estimates of pasture
intake (correction bias of 0.9935, (Figure S2), although Lin’s correlation coefficient (0.66) showedAnimals 2020, 10, 390 8 of 20
considerable deviance around the line of best fit resulting in a concordance of 0.65 (95th percentile
confidence limits of 0.57 to 0.73).
Table 4. Summary statistics for supplement dry matter (DM) and metabolizable energy (ME) fed
and calculated intakes of ME, DM and nutrients from pasture of lactating herds on five occasions on
43 farms (n = 227).
Supplement Fed 1 Calculated Intake from Pasture
Summary DM ME ME 2 DM N P K S Ca Mg
Statistics
kg/Cow MJ/Cow MJ/Cow kg/Cow
g/Cow Per Day
Per Day Per Day Per Day Per Day
Minimum 1.1 13 0.4 0.04 1.2 0.2 0.9 0.2 0.4 0.1
Mean 9.2 104 98 9.1 336 42 260 32 55 28
Median 8.6 97 97 9.1 320 39 247 30 52 25
Maximum 25.4 251 236 22.5 787 117 686 81 190 267
SD 4.91 52.2 45.4 4.7 165.9 23.4 141.4 17.6 33.3 21.4
Var 24.07 2725.0 2056.7 21.9 27,531.5 546.6 19,988.9 309.3 1110.3 459.8
CV 54% 50% 47% 51% 49% 56% 54% 54% 61% 76%
Skew 0.56 0.5 0.1 0.1 0.2 0.7 0.4 0.5 0.8 6.6
Kurt 0.08 −0.1 −0.2 −0.2 −0.4 0.4 −0.1 −0.1 0.8 71.4
1 Total supplements fed, accounting for wastage (as estimated by the farmer) and reflecting actual amounts provided
by correcting inaccurately calibrated dairy shed feeders. 2 Pasture ME calculated by subtracting supplement ME
from total ME requirements.
Lower CV (17%) in estimated total DMI (10 to 29 kg DMI/day) was observed for all farms and
interviews (data not presented) compared to that for pasture (51%) and supplements (54%) DMI.
Despite the variety of diets offered nationally, both milk yield (R2 = 0.77, data not presented) and ECM
(R2 = 0.75) were significantly (p < 0.008) related to total DMI at all interviews (Table 5), although the
response to supplement DM fed was not significant in spring. Greater increases in milk production in
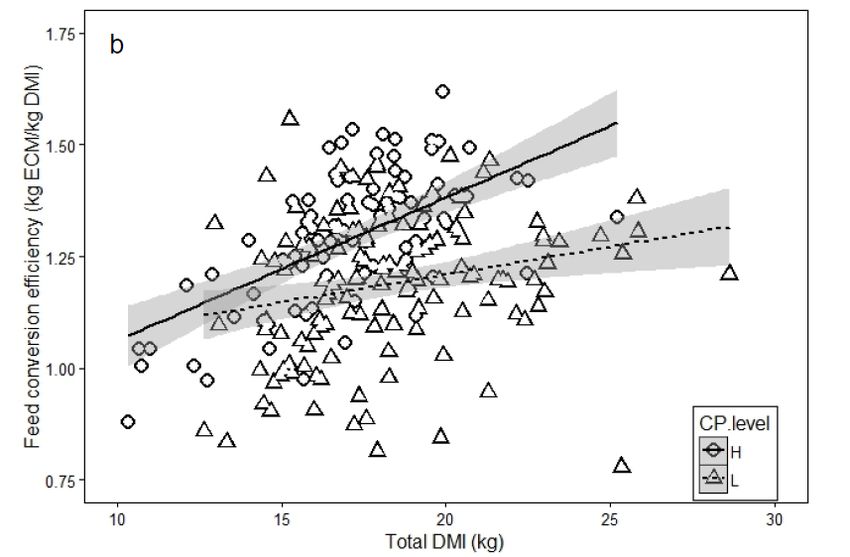
response to total DMI were observed for those diets that were above 20% CP in these systems (Figure 1).
Feed conversion efficiencies ranged from 0.8 to 1.62 kg ECM.kg DMI−1 and showed a poor correlation
to DMI, particularly to estimated pasture DMI (Table 6).
Table 5. Linear regression relationships and p value for relationships between per cow energy corrected
milk (ECM) or feed conversion efficiency (FCE) and total dry matter intake (DMI) or supplement DMI
(DMISUP ) for each interview and for all data. The range in adjusted R2 for all relationships is provided.
ECM 2 ECM 3 FCE 4
Time Periods 1
(kg ECM/kg
(kg/day) p (kg/day) p p
DMI)
Summer
January/February 2008 1.55 DMI 2 −7.36 2.87 × 10⁻¹⁴ 0.39 DMIsup 3 + 16.99 0.00482 0.023 DMI + 0.72 0.00715
January/February 2009 1.51 DMI−5.39Animals 2020, 10, 390 9 of 20
Animals 2020, 10, 390 10 of 24
Figure1.
Figure 1. Relationship
Relationshipbetween
betweenenergy
energycorrected
correctedmilk
milk(ECM);
(ECM);(a)(a)
or or
feed conversion
feed efficiency
conversion (b) and
efficiency (b)
totaltotal
and dry dry
matter intake
matter (DMI)
intake by lactating
(DMI) dairy
by lactating herds
dairy on 43
herds on grazing
43 grazingsystem dairy
system farms
dairy at low
farms (L;
at low
(L; 20%) dietary crude
dietary protein
crude (CP).
protein (CP).
Graphs were prepared using R Studio 0.99.891. Shaded areas represent 95% confidence intervals
around the regression lines.Animals 2020, 10, 390 10 of 20
Table 6. Pearson correlation coefficient and statistical significance (F-prob) for correlations between
milk production and intake parameters for lactating dairy herds on 43 grazing system dairy farms.
Correlation Variables R F-prob
ECM DMI 0.87 0.000
ECM FCE 0.75 0.000
ECM DMIpas 0.20 0.002
ECM DMIsup 0.36 1.69 × 10⁻⁸
ECM Milkfat −0.51 3.33 × 10⁻¹⁶
ECM Milkprot −0.19 0.003
FCE DMI 0.33 3.44 × 10⁻⁷
FCE DMIpas 0.006 ns
FCE DMIsup 0.21 0.002
FCE Milkfat −0.31 2.01 × 10⁻⁶
FCE Milkprot −0.05 ns
DMI DMIpas 0.29 1.28 × 10⁻⁵
DMI DMIsup 0.37 9.89 × 10⁻⁹
DMI Milkfat −0.52 0.000
DMI Milkprot −0.28 1.34 × 10⁻⁵
DMIpas DMIsup −0.79 0.000
DMIpas Milkfat −0.22 0.0007
DMIpas Milkprot −0.12 0.067
DMIsup Milkfat −0.12 0.068
DMIsup Milkprot −0.07 ns
Milkfat Milkprot 0.63 0.000
ECM, energy corrected milk [27]; DMI, estimated total dry matter intake; FCE, feed conversion efficiency (kg ECM/kg
DMI); DMIpas, estimated pasture dry matter intake; DMIsup, supplement dry matter fed (accounting for wastage);
Milkfat, milk fat (%) measured by chemical analysis; Milkprot, milk protein (%) measured by chemical analysis.
Graphs were prepared using R Studio 0.99.891. Shaded areas represent 95% confidence intervals
around the regression lines.
3.3. Feed Nutrient Intake, Excretion and Animal Use Efficiency
Calculated nutrient intakes (g/cow per day) were highly variable with pasture N intake having
the lowest CV and pasture Mg intake the highest (Table 4). Supplement N, P, K, S, Ca and Mg
intakes (n = 227) averaged (range) 226 (7−667), 42 (2−155), 124 (3−511), 21 (1−72), 64 (2−216), and 28
(1−88) g/cow per day, respectively (data not presented). Supplement nutrient intakes varied between
interview dates for all farms and no farms ever had both maximum and minimum supplement intakes.
On average, supplement nutrient intake was 42%, 50%, 36%, 42%, 53% and 51%, respectively, of total
nutrient intakes—ranging from 0 to 100% for all nutrients.
Pasture and supplement nutrient intakes were summed and divided by total DMI to give dietary
CP, P, K, S, Ca and Mg concentrations, which, on average (range), were 19% (9−30), 0.45% (0.21−0.75),
2.1% (0.8−4.0), 0.29% (0.14−0.56), 0.65% (0.17−1.34), 0.3% (0.14−0.6), respectively. Except for N,
supplement nutrient intake concentrations were always more variable than pasture nutrient intake
concentrations. Maximum total N, K and S intakes were four times minimum intakes for these nutrients
and six, eight and five times minimum dietary P, Ca and Mg (respectively, Table 7). Mean calculated N,
P, K, S, Ca and Mg excretion was 433, 61, 341, 44, 92, and 52 g/cow per day respectively, and differences
between the maximum and minimum were greater than for the calculated intakes. The CV was lowest
for excreted N, similar for K and S and highest for Ca and the excreted data were not skewed or
kurtotic. On average, close to 80, 75, 90, 85, 80 and 95% of N, P, K, S, Ca and Mg intakes were excreted
by these herds.Animals 2020, 10, 390 11 of 20
Table 7. Summary statistics for calculated nutrient intake (g/cow per day), excretion (g/cow per day)
and animal nutrient use efficiencies (%) across 43 grazing system dairy farms for five interviews.
Summary
N P K S Ca Mg
Statistics
Nutrient Intake (g/Cow Per Day)
Minimum 268 27 175 24 30 22
Mean 545 81 372 52 116 54
Median 543 81 364 51 111 52
Maximum 983 155 703 108 236 101
SD 129.4 23.8 105.2 13.8 41.8 15.0
Var 16,755.4 568.5 11,058.5 190.1 1744.4 225.1
CV 24% 29% 28% 26% 36% 28%
Nutrient Excretion (g/Cow Per Day)
Minimum 199 20 140 19 10 21
Mean 433 61 341 44 92 52
Median 429 60 335 42 89 50
Maximum 793 132 671 101 210 98
SD 110.3 20.7 102.7 13.0 40.6 14.7
Var 12,171.6 429.7 10,537.9 169.1 1651.5 216.0
CV 25% 34% 30% 30% 44% 28%
Animal Nutrient Use Efficiency (%)
Minimum 11 4 2 3 8 2
Mean 21 25 9 16 23 4
Median 21 24 8 15 21 4
Maximum 39 48 21 48 76 8
SD 4.3 6.6 3.3 7.1 10.8 1.2
Var 18.1 43.1 11.0 51.1 116.2 1.5
CV 20% 26% 38% 44% 46% 28%
Residual maximum likelihood analysis (Table 8) was undertaken to identify any relationships
between estimated daily excretion of nutrients and farm characteristics such as annual milk production,
farm size or supplementary feed importation. Where significant effects of farm characteristics on
excreted nutrients were observed these were generally positive. Only N excretion (p = 0.013) was
positively related to farm size, while N and S excretion were strongly (p < 0.004) positively related to
herd size, stocking rate and total milk produced on the farm. Nitrogen, P and Mg excretion increased
with per cow milk production, while only N, P and S excretion were related to per hectare milk
produced. Both P and Mg excretion increased (p < 0.001) as the percent of dietary ME that was
imported increased. An indication for P excretion (p = 0.057) to be related to percent of the farm
area that received irrigation was observed. Negative relationships were observed between K and Ca
excretion and farm characteristics. Potassium excretion was significantly related to importation of
supplementary ME (p = 0.007), and Ca excretion was related to herd size (p = 0.027) and stocking rate
(p = 0.046). Highly significant season effects were observed for relationships between Mg excretion and
per cow milk production (p = 0.007) with weaker relationships observed for the other characteristics
(0.013 < p < 0.046). Neither season nor interview date influenced relationships between K or Ca
excretion and the farm characteristics tested, but significantly (p < 0.001) influenced relationships
between the other nutrients excreted and farm characteristics (data not presented).Animals 2020, 10, 390 12 of 20
Table 8. F-prob (effects) estimates for residual maximum likelihood (REML) analysis of daily nutrient
excretion and characteristics of these grazing system dairy farms.
Daily Excretion (g/Cow Per Day)
Farm Characteristics
N P K S Ca Mg
0.013
Farm area 1 (ha) ns ns ns ns ns
(0.1557)Animals 2020, 10, 390 13 of 20
maximum reflected the high producing cows and systems with larger animals while the minimum was
associated with a farm where the cows were in late lactation and their intake comprised only grazed
pasture. The predominantly seasonal nature of milk production also contributed to the variability in
milk yield across the year of the study.
Heard et al. [17] observed that of the livestock parameters tested in their sensitivity analysis,
liveweight and terrain were the most important although supplemental feed inputs had generally
larger impacts on estimation of forage consumption. In this study, the terrain the animals traversed
was accounted for, although a single factor was applied to the whole farm. Animal liveweights were
based on herd average estimates provided by farmers. For the range of herd weights in this study,
daily ME requirements for maintenance could vary from 40 up to 70 MJ/day for Jersey and Friesian
animals [30], with the estimates for this study (46 to 66 MJ/cow per day) falling within those ranges.
We calculated daily ME maintenance requirements incorporating either a 10% increase or decrease in
the herd average liveweights provided by the farmers, which resulted in a 7.4% increase and a 7.6%
decrease, respectively, in estimated maintenance ME. Mean (minimum, maximum) estimated pasture
DMI increased by 0.388 kg (0.301 kg, 0.628 kg) per cow per day or decreased by 0.397 kg (0.644 kg,
0.309 kg) per cow per day, which, like Heard et al. [17], was similarly less than a 5% change in DMI.
While a number of other breeds were included in this study, maintenance requirement multipliers
for most breeds only ranged from 0.07 to 0.074 [15], suggesting that the variation in breeds in this
study may not have had a big impact on ME estimates and explaining the narrow range in calculated
maintenance ME requirements.
Estimation of dietary ME is difficult to accommodate in studies on commercial dairy farms, with
Reeves et al. [12] observing that accurate feed quality data minimizes errors in estimating intakes.
The ME data for supplements and pasture in this study were based on chemical analysis of over
800 samples of different feeds provided over the year of the study and collected on farms [26]—many
of which were not previously reported in feed databases. Thus, the feed sample data in this study
enabled a more accurate calculation of DMI, reflecting seasonal variations in ME contents which would
otherwise not have been possible with the use of book values. Assessments of wastage were also
shown to be important in sensitivity analyses of the ‘Feeding Standards’ approach and in estimation of
pasture DMI [17,31], and were accounted for in pasture DMI calculations in this study.
4.2. Dry Matter Intake
Average pasture DMI was only just over a half of total DMI for all farms, despite the grazing-based
nature of these systems, and considerably less than the average of 80% of ME intake that occurred on
farms 15 years ago [31]. As such, these data support reports that supplementary feeds are increasingly
being used by the Australian dairy industry [5,32,33]. However, the range in pasture DMI as a percent
of total DMI was larger than that for systems investigated by Powell et al. [21], as the four farms
assessed in their study were located in one region, and data were collected only in autumn and spring.
Despite different breeds, pasture systems and sampling times in this study the CV for DMI (17%) and
range (10 to 29 kg DMI) measured on these farms was low. Mean total DMI for our study was similar
to estimates reported by Beever and Doyle [31] of 17 to 18 kg for 600 kg cows grazing pasture on
commercial dairy farms. Our data likewise fell within ranges of predicted DMI for cattle at different
stages of lactation, that had diverse weights and which received diets with DM digestibilities ranging
from 0.5 to 0.8 [34].
Estimates of DMI are known to be influenced by body weight changes that occur in early and late
lactation [35]. Losses and gains in body weight cannot be accounted for in short duration on-farm
measurements [29], which may have contributed to the observed range in DMI in this study, noting
that for only approximately 0.1% of records all or the majority of the cows in the herd were either in
late or early lactation. Compounding the difficulty in accounting for liveweight gains and losses is
the influence of parity of the cows as well as their production level on the extent of negative energy
balance in early lactation [36,37]. Heat and cold stress also affect energy requirements and DMI [38]Animals 2020, 10, 390 14 of 20
with lactating dairy cows tolerating temperature ranges from −0.5 ◦ C up to 25 ◦ C [39]. Historical
meteorological data give mean minimum and mean maximum temperatures for farm locations in this
study of −0.6 and 35 ◦ C, respectively (http://www.bom.gov.au/climate/data/), suggesting that some
herds may have experienced temperature stress, although this may not have occurred near dates of
farm visits.
Hristov et al. [40] described highly significant influence of DMI on milk yield which we likewise
observed between ECM and total DMI for these grazing system herds, as well as weaker but still
positive relationships with pasture or supplement DMI. The relationship between ECM and supplement
DMI observed for commercial herds in this study was similar to that reported for experimental cows
grazing spring pasture and provided with a range of supplements (ECM = 27.96 + 0.30DMI p = 0.065;
Auldist et al. [25]). Calculated (mean; range) FCEs (1.2; 0.8 to 1.6 kg ECM/kg DMI) for commercial dairy
herds in this study were lower than that reported for 13 free stall lactating herds (mean = 1.4, range
1.12 to 1.79 kg 3.5% fat corrected milk/kg DMI) [41] where the higher milk yields and the DMI of the
Holsteins fed TMR would have contributed to the differences observed. Grazing herd FCEs indicate
lower biological efficiencies for these cows, particularly at the lower end where animals could have been
underfed with pasture, or pastures with lower digestibility were provided [31]. In addition, different
stages of lactation for the commercial grazing cows would contribute to the range of FCEs calculated.
Beever and Doyle [31] reported lower FCEs for later lactation cows grazing paspalum compared with
early lactation herds consuming ryegrass pastures. In our study, cows grazed a variety of pasture
types ranging from temperate perennial and annual grasses to tropical grass species, legumes, herbs,
cereals and brassicas [26]. Despite differences in FCE between US and Australian dairy herds, similarly
significant (p < 0.001) correlations between FCE and ECM were observed (0.748 [41]; 0.74, this study).
However, in contrast to this study, no relationship between FCE and DMI were observed in free stall
farms, attributed by Britt et al. [41] to strong seasonal (i.e., temperature) effects on milk production
and FCE for US Holstein herds. The relationship between FCE and DMI on grazing system farms
was not significant in spring only and that was most likely due to the absence of a relationship with
supplement DMI in that season. Thus, in addition to differences in breed, pasture types and seasonal
conditions, stage of lactation, parity, dietary CP and weather could have contributed to the small range
in DMI estimated (CV < 20%).
In addition to similarities observed between our intake and milk production data and the
experimental literature, a relationship between calculated pasture DMI and that estimated by farmers
in this study was also observed. Deviations between the calculated DMI and farmer estimates are
likely to be due to inaccuracies in calibration of supplementary feeders observed on many of the
project farms, which Beever and Doyle [31] consider to be a factor contributing to farmer errors in
intake estimations. Moreover, assessments of wastage, required for the ‘Feeding Standards’ approach,
are important but are typically not considered in farmer estimates [17,31]. When Heard et al. [17]
compared simulated data calculated using the ‘Feeding Standards’ approach with experimentally
estimated pasture intake data, a higher (0.76 vs. 0.65 in this study) concordance relationship was
observed, and they reported lower correction bias. In commercial settings it will be difficult to estimate
precisely the pasture consumed by each animal, but the concordance with farmer estimates observed
in our study indicates that, despite limitations of the methodology, the ‘Feeding Standards’ method
reflected pasture allocated to commercial herds.
4.3. Nutrient Intakes
Dietary P (2.1–7.5 g/kg DMI), Ca (1.7–13.4 g/kg DMI) and Mg (1.4–6.0 g/kg DMI) estimated in this
study spanned recommendations for lactating dairy cattle with different levels of milk production [34].
Few incidences of potential dietary deficiencies were observed for P, Ca and Mg, with only a few herds
on some farms on some dates having less than recommended nutrient intakes. For P, these dates were
always in summer. Dietary K (8.8–39.8 g/kg DMI) was only in excess (>30 g/kg DMI) for a small number
of farms on at least one occasion, and for one farm (Farm 1) at all except one occasion. PotassiumAnimals 2020, 10, 390 15 of 20
concentrations of pasture (5.9%), silage (4.5%) and crops (6.5%) provided to these herds would have
contributed to high dietary K and could have affected Mg absorption. Fisher et al. [42] described
historical increases in pasture and silage K concentrations that are similar to upper concentrations
observed in this study. However, despite high K intakes, dietary K balance was never greater than
2.2 [43] and therefore herds were unlikely to be at risk of hypomagnesaemic tetany. In contrast to
sporadic high K intakes, elevated dietary S (>4 g/kg DMI) was observed for almost all interview dates
for herds on Farms 1, 4 and 19. However, aside from molasses supplement on Farm 4 high pasture and
crop S concentrations appeared to contribute to dietary S on the other farms. Compared with TMR
diets provided by Idaho farmers [18,19], mean K (1.90%; 1.61 to 2.16%) was similar, and S (0.25%; 0.24 to
0.30%) and Mg (0.37%; 0.34 to 0.41%) were lower than for these grazing system animals (1.87%, 0.31%
and 0.46% respectively).
The potential for N and P to be environmental contaminants [44,45] resulted in more studies
quantifying intake and excretion of these nutrients on commercial dairy farms compared with K, S,
Ca and Mg. For instance, mean dietary P (4.5 g P/kg DM) of grazing herds on these study farms
was greater and the ranges generally wider than Spanish (3.98, 2.8 to 5.4 g/kg DMg) [22], Swedish
([3.7, 2.1 to 5.2 g/kg DM) [46], northeast US (4.42, 3.6 to 7.0 g/kg DM) [9], and Wisconsin ([4.0, 2.3
to 8.5 g/kg DM) [47] commercial farms, and well in excess of NRC [35] recommendations of 3.2 to
3.8 g/kg DM for cows producing 22 to 55 kg milk/day. Mean P concentration of dietary components
(0.47%, 0.01 to 3.99%) provided to the cows in this study was less than for Swedish rations (0.6%, 0.25
to 1.1%) [46], and Wisconsin (1..8%, 0.24 to 3.58%) [47]), and closer to that of Idaho (0.49%, 0.41 to
0.50%) [19]) farms. Arriaga et al. [22] attributed high P intakes in their study mainly to grass silage,
although concentrates had higher P concentrations. In our study, as reported elsewhere [9,47], mineral
supplements and concentrates contributed the highest P concentrations to diets. Despite these reported
differences, daily P intakes on Spanish and Wisconsin commercial farms of approximately 84 g [22,47]
were close to that estimated for grazing system farms in our study where 72% of records were above
dietary P recommendations. When P intake was averaged for each farm in this study, approximately
81% of farms fed above recommended P thresholds for high producing cows, slightly less than that
reported for Wisconsin farmers [47], although farms in our study did not always overfeed P, and milk
production was often lower than the basis of the recommendations.
Mean dietary CP concentration (19%) for cows in this study was slightly higher than both
Australian (16%) [34] and NRC [18%, 35] recommendations, and greater than observed on Idaho
(17.6%) [19], Wisconsin (17.2%) [20] and Spanish (16.4%) [22] farms. However, mean daily N intake for
Australian animals was only slightly less than that reported for Spanish cows. Consequently, most
farms in our study appear to be overfeeding dietary protein with only 12% of the data lower than the
recommended threshold of 400 g N/day [48,49]. Similarly, Jonker et al. (2002) reported that 71% of
Chesapeake Bay farmers overfed N in their survey. Thus, at the upper end of CP intake, considerable
excretion of N would be expected in these systems.
4.4. Nutrient Excretion and Animal Use Efficiency
Mean N and P excretion (g/cow per day) calculated for these grazing system farms fell within
ranges collated from a review of experimental literature [50]. When results from this study for K, S,
Ca and Mg excretion were compared with the few published data for commercial herds fed TMR in
California [8,51], K was between 14 and 44 g/cow per day greater than observed for the TMR herds, and
at the upper end of experimental data collated for the review mentioned above. Greater median, 25th
and 75th quartile (2.0%, 1.67%, 2.5%) dietary K for grazing cows, compared to those for the California
animals (1.62%, 1.46%, 1.75%, respectively) [8], indicates possible greater excretion by grazing herds.
Our observed K excretion contrasts with Ca, P, and Mg where the California herds excreted more on
a daily basis (58, from 8 to 13, between 15 and 23 g/cow per day, respectively). The greater mineral
excretion by the California herds can be due to the 30% higher milk yields of those animals and the
associated greater dietary DM intake to support higher body weight. Sulphur excretion by the TMRAnimals 2020, 10, 390 16 of 20
herds varied when compared with this grazing study, with less excreted in one report and more in the
other. Ranges (maximum minus minimum) in excretion were greater for Australian grazing systems
than international N (410 g/cow per day) and K (143 g/cow per day) data [50], but were similar for P
(107 g/cow per day). Likewise, for commercial TMR herds [8,51] ranges for K and S excreted were
approximately half that of the grazing cows, but were comparable for P, Ca and Mg.
Management factors can influence nutrient excretion, and as observed by Borsting et al. [52], N
excretion by grazing lactating cows increased as milk yield. Arriaga et al. [22] describe ‘intensification’
management factors such as herd size and land availability that influenced N more than P excretion.
On the grazing system farms stocking rate, herd size and annual milk yield strongly influenced N
excretion, whereas P, K and Mg excretion were significantly affected by the feed ME requirements
brought onto farms. The contribution of dietary minerals and concentrates to P and Mg intake and
pasture to K intake could explain the relationships observed.
Animal nutrient use efficiencies, based on dietary nutrients and nutrients secreted in milk, are often
considered a useful means of comparing the potential for environmental impact. Estimating animal
use efficiencies and excretion of macrominerals is both important for animal health and productivity
as well as for minimizing salt loads to soils [53]. On commercial farms animal N use efficiencies
ranged from 18% to 33% [20], from 19.2% to 32.3% [22], and from 24.5% to 32.3% [54], while feed P use
efficiencies were between 19.3% and 44.7% [22] and between 18% and 35% [20]. Mean N and P use
efficiencies for lactating cows on our grazing system farms were lower than reported in the literature,
with wider ranges in N and P use and lower minimum efficiencies. Limited data are available in the
literature for K, S, Mg and Ca feed use efficiencies on commercial farms. Using excretion and milk
nutrient data for TMR-fed herds in California [8], animal feed use efficiencies were calculated that
were equivalent (S, Mg) or less than (Ca) those for the grazing systems in this study.
4.5. Estimating Nutrient Excretion for Grazing System Farms
This paper addresses the requirement for technological solutions to improve nutrient
management [55], and is particularly relevant for grazing systems globally. Nutrient management
programs for Australian grazing systems are largely based on improving fertilizer management,
focusing on the assessment of soil test values and quantification of input output farm-gate budgets [56]).
As a consequence, these programs do not account for the large within-farm flow of nutrients through
dairy cows that is expected in these systems and the variety of places where these animals are likely to
excrete [50]. On many grazing system farms animals were spending less time in grazed paddocks and
more time in paddocks closest to dairy sheds were soil test levels were elevated [50,57].
The methodology to estimate dietary intake of grazing cows described in this paper can be
used for calculating nutrient excretion and to develop within-farm nutrient budgets. The herd data
(milk production, supplement DMI, stage of lactation etc.) required for the daily ‘Feeding Standards’
approach are readily available on commercial dairy farms. Dates of data collection should represent
major seasonal influences on diet and milk production, which for Australian grazing systems would be
at least once in each season. However, as farmers seek to increase productivity, individualised feeding
systems are recommended [52,58] and the associated automation of these systems should be able to
provide the daily cow specific diet, lactation and even liveweight or body condition score information
that will improve estimation of pasture DMI.
This approach for calculating excreted nutrients can be used to identify nutrient management
points of intervention on grazing system dairy farms. By combining excretion data with information
about the locations within farms where animals are held [50], deposited nutrient loads can be calculated
which will indicate nutrient accumulation zones where the potential risk of nutrient loss is high.
Estimating nutrient deposition by cows should improve manure and effluent management as a number
of surveys have shown that farmers often did not know manure N applied [20] or rarely tested their
manure before application [59], indicating a need for methods to more reliably estimate manure
nutrient application, particularly for grazing system farms.Animals 2020, 10, 390 17 of 20
5. Conclusions
This work demonstrated that the daily pasture DMI of lactating herds can be estimated with
a modified energy requirement (‘Feeding Standards’) approach using data readily available on
commercial dairy farms. The calculated intakes, which are comparable to those reported in the
literature and are concordant with farmer estimates of feed provided, indicate the feasibility of this
approach for estimating nutrients excreted by lactating cows in grazing systems. Using nutrient
analyses of all feeds offered on farms instead of book values, including estimates of feed wastage, and
ensuring accurate calibration of supplementary feeders are likely to have contributed to the agreement
of calculated pasture DMI with farmer estimates of pasture consumed. More accurate liveweight data
could improve DMI estimates, with sensitivity analysis indicating a less than 5% difference in calculated
values. Using this approach for lactating herds grazing on commercial dairy farms, we showed that
only approximately half the animals’ total DMI consisted of pasture, and calculated herd N and P
intakes were greater than recommended in the literature. Daily excreted N, P, K, S, Ca and Mg were
calculated for these grazing herds, with low feed N and P use efficiencies indicating the potential for
nutrient losses that will need to be managed on commercial farms.
Supplementary Materials: The following are available online at http://www.mdpi.com/2076-2615/10/3/390/s1.
Figure S1: Map showing the location of project farms across temperate, arid, subtropical and tropical zones of
Australia. Figure S2: Relationship between calculated pasture dry matter intakes and farmer estimates of what
was provided to their lactating herds. Table S1: Herd, milk production, fat and protein concentration and terrain
data, as well as calculated milk nutrients, supplement, pasture and total DMI, and nutrient intake, excretion and
use efficiency for lactating cows at 5 visits over 4 seasons on 43 commercial dairy farms. Table S2: Amounts and
nutrient contents of all feed types consumed by the lactating herds on 5 different visits to 43 dairy farms; including
wastage, estimates by farmer of pasture and where feeder weights were adjusted.
Author Contributions: Conceptualization, S.R.A., C.J.P.G., and J.M.P.; methodology, S.R.A., C.J.P.G., and J.M.P.;
formal analysis, S.R.A.; resources, C.J.P.G.; writing—original draft preparation, S.R.A.; writing—review and
editing, S.R.A. and C.J.P.G.; project administration, C.J.P.G.; funding acquisition, C.J.P.G. All authors have read
and agreed to the published version of the manuscript.
Funding: This research was supported by Dairy Australia [DAV12307] and the Victorian Department of Jobs,
Precincts and Regions [CMI100547]. The funders had no role in the design of the study; in the collection, analyses,
or interpretation of data; in the writing of the manuscript, or in the decision to publish the results.
Acknowledgments: The authors gratefully acknowledge the farmers who allowed access to their farms and
provided data. We thank the seven national project interview teams who visited farms to collect data and samples.
We are indebted to Jenny Smith for developing the queries used to calculate pasture intake and subsequently
nutrient excretion, Murray Hannah for biometric assistance and we are very appreciative of the help and advice
provided by Janna Heard with the ‘Feeding Standards’ method. We thank P Moate and other anonymous reviewers
whose suggestions improved this paper.
Conflicts of Interest: The authors declare no conflict of interest.
References
1. Tamminga, S. Nutrition management of dairy cows as a contribution to pollution control. J. Dairy Sci. 1992,
75, 345–357. [CrossRef]
2. Fangueiro, D.; Pereira, J.; Coutinho, J.; Moreira, N.; Trindade, H. NPK farm-gate nutrient balances in dairy
farms from Northwest Portugal. Eur. J. Agron. 2008, 28, 625–634. [CrossRef]
3. Spears, R.A.; Kohn, R.A.; Young, A.J. Whole-farm nitrogen balance on western dairy farms. J. Dairy Sci. 2003,
86, 4178–4186. [CrossRef]
4. Spears, R.A.; Young, A.J.; Kohn, R.A. Whole-farm phosphorous balance on western dairy farms. J. Dairy Sci.
2003, 86, 688. [CrossRef]
5. Gourley, C.J.P.; Dougherty, W.J.; Weaver, D.M.; Aarons, S.R.; Awty, I.M.; Gibson, D.M.; Hannah, M.C.;
Smith, A.P.; Peverill, K.I. Farm-scale nitrogen, phosphorus, potassium and sulfur balances and use efficiencies
on Australian dairy farms. Anim. Prod. Sci. 2012, 52, 929–944. [CrossRef]
6. Kobayashi, R.; Yamada, A.; Hirooka, H.; Tabata, Y.; Zhang, J.; Nonaka, K.; Kamo, M.; Hayasaka, K.; Aoki, Y.;
Kawamoto, H.; et al. Changes in the cycling of nitrogen, phosphorus, and potassium in a dairy farming
system. Nutr. Cycl. Agroecosystems 2010, 87, 295–306. [CrossRef]You can also read