Carbonyls and Carbon Monoxide Emissions from Electronic Cigarettes Affected by Device Type and Use Patterns
←
→
Page content transcription
If your browser does not render page correctly, please read the page content below
International Journal of
           Environmental Research
           and Public Health

Article
Carbonyls and Carbon Monoxide Emissions from
Electronic Cigarettes Affected by Device Type and
Use Patterns
Yeongkwon Son , Chiranjivi Bhattarai , Vera Samburova and Andrey Khlystov *
 Division of Atmospheric Sciences, Desert Research Institute, Reno, NV 89512, USA;
 yeongkwon.son@dri.edu (Y.S.); chiranjivi.bhattarai@dri.edu (C.B.); vera.samburova@dri.edu (V.S.)
 * Correspondence: andrey.khlystov@dri.edu; Tel.: +1-775-674-7084

 Received: 18 March 2020; Accepted: 15 April 2020; Published: 17 April 2020

 Abstract: Dangerous levels of harmful chemicals in electronic cigarette (e-cigarette) aerosols were
 reported by several studies, but variability in e-cigarette design and use patterns, and a rapid
 development of new devices, such as JUUL, hamper efforts to develop standardized testing protocols
 and understand health risks associated with e-cigarette use. In this study, we investigated the relative
 importance of e-cigarette design, power output, liquid composition, puff topography on e-cigarette
 emissions of carbonyl compounds, carbon monoxide (CO), and nicotine. Four popular e-cigarette
 devices representing the most common e-cigarette types (e.g., cig-a-like, top-coil, ‘mod’, and ‘pod’)
 were tested. Under the tested vaping conditions, a top-coil device generated the highest amounts of
 formaldehyde and CO. A ‘pod’ type device (i.e., JUUL) emitted the highest amounts of nicotine, while
 generating the lowest levels of carbonyl and CO as compared to other tested e-cigarettes. Emissions
 increased nearly linearly with puff duration, while puff flow had a relatively small effect. Flavored
 e-liquids generated more carbonyls and CO than unflavored liquids. Carbonyl concentrations and
 CO in e-cigarette aerosols were found to be well correlated. While e-cigarettes emitted generally
 less CO and carbonyls than conventional cigarettes, daily carbonyl exposures from e-cigarette use
 could still exceed acute exposure limits, with the top-coil device potentially posing more harm than
 conventional cigarettes.

 Keywords: electronic cigarette; vaping topography; carbonyls; carbon monoxide; nicotine

1. Introduction
      Electronic cigarettes (e-cigarette) have been assumed to pose less harm than conventional cigarette
products, but e-cigarette vaping is not risk free [1]. Indeed, e-cigarette is a source of exposures to
various air toxics. Previous studies demonstrated that e-cigarette aerosols contain carbonyls [2–8],
volatile organic compounds [9,10], and metals [11,12]. Carbonyl compounds have been receiving a lot
of attention so far as they were found to be the most abundant toxic species in e-cigarette aerosols [7].
      E-cigarette carbonyl emissions were reported to vary with e-cigarette device construction, power
output, and e-cigarette liquid (e-liquid) composition (e.g., base material, flavorings) [3–5]. For a given
e-cigarette, a higher power output, and thus higher e-cigarette coil temperature, results in higher
carbonyl emissions [4–6,8,13]. The e-cigarette construction (e.g., top vs. bottom coil, power per coil
surface area, etc.) also influences carbonyl emissions as it affects e-liquid supply to the wick [3,5] and
coil temperature distribution [14]. E-liquid composition, especially the flavoring compounds, is another
significant factor that affects e-cigarette carbonyl emissions [3,15]. Very little is known about the effect
of puff topography, such as puff duration and puff flow rate, on e-cigarette emissions. Puff flow rate
was reported to affect coil temperature and thus e-liquid evaporation rate [16]. E-cigarette nicotine

Int. J. Environ. Res. Public Health 2020, 17, 2767; doi:10.3390/ijerph17082767    www.mdpi.com/journal/ijerph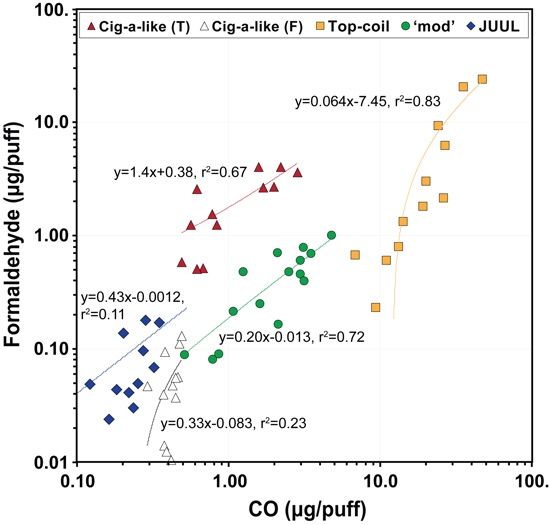
Int. J. Environ. Res. Public Health 2020, 17, 2767                                                  2 of 15

yields were shown to increase with puff duration, while puff flow rate had no effect [14]. E-liquid
consumption and emissions of some carbonyls were observed to depend on puff flow rate [17].
     Differences in device types and testing protocols (e.g., e-cigarette power, e-liquid composition,
and puff parameters) used in previous studies [4,5,8] make it difficult to inter-compare results and
draw conclusions about the relative safety of particular e-cigarette devices and e-liquids. If puff
topography has a strong effect on e-cigarette emissions, translating results of laboratory studies
performed using fixed puff parameters to user exposure becomes problematic because puff topography
among e-cigarette users varies widely. Puff durations employed by users of the same e-cigarette device
were reported to vary from 0.6 s to over 10 s [18]. In a study of 23 daily e-cigarette users, e-cigarette
power output was reported to vary between 5 and 60 W, puff volume varied between 10–251 mL,
and puff duration between 1.3 and 5.8 s [19]. Understanding of the relative importance of different
parameters affecting e-cigarette emissions is needed for formulating standardized testing protocols
and translating laboratory results to real-life exposure.
     Carbon monoxide (CO) emissions from e-cigarette have been understudied [20,21], because a few
studies showed that exhaled CO concentrations among e-cigarette users were significantly lower than
conventional tobacco smokers [7,22–24]. However, CO can be formed in e-cigarettes through thermal
decomposition of e-liquid base materials (propylene glycol (PG) and vegetable glycerin (VG)) [25] and
some flavoring compounds [26]. Therefore, CO could serve as a useful indicator to study chemical
processes occurring in e-cigarette.
     In this study, we investigated the impact of e-cigarette construction, power, puff topography, and
e-liquid composition on carbonyl, CO, and nicotine emissions. We tested four popular e-cigarette
devices, each representing one of the popular e-cigarette construction types: A cig-a-like, a top-coil,
a ‘mod’ with a sub-ohm coil, and a ‘pod’ system (i.e., JUUL). In 2014, the e-cigarette market in the U.S.
was $2.5 billion (40% was for cig-a-like and 60% was for tank-type, ‘mod’, and other type devices).
Currently, the ‘pod’ type e-cigarettes including JUUL are the most popular e-cigarette device in the
rapidly increasing U.S. e-cigarette market, especially among teenagers [27], capturing over 72.1% of
the e-cigarette market [28]. Very little is known about chemical composition of aerosols produced by
the pod devices [9,29].

2. Materials and Methods

2.1. E-Cigarette Devices and E-Liquids
      Table 1 lists e-cigarette brands, e-liquid types, and vaping conditions used in this study (more
details can be found in Figure S1 and Table S1). Four e-cigarette devices were tested: A cig-a-like device
with a single coil atomizer (V2, VMR products, LLC, Miami, FL, USA), a single-top-coil e-cigarette
(eGo CE4, Shenzhen Somple Technology, Shenzhen, China), an adjustable power ReuLeaux RX200
‘mod’ (WISMEC Electronics, Guangdong, China) with an Aspire Cleito atomizer (Shenzhen Eigate
Technology, Shenzhen, China) equipped with a replaceable Clapton-style 0.4 Ω Kanthal coil, and a
JUUL ‘pod’ system (PAX Labs, San Francisco, CA, USA). These devices represent a progression of
e-cigarette device designs with the JUUL being currently the most popular device in the USA [27]. Since
e-liquid PG:VG ratio and, especially, e-liquid flavor were shown to affect e-cigarette emissions [3,6],
several e-liquids were tested in this study. Tierney et al. [30] have shown that flavoring chemicals
differ among “flavor classes”. For example, sweet and fruit-like e-liquids contain mainly esters and
alcohols, while cream-like flavored e-liquids contain carbonyls. Thus, e-liquids representing tobacco,
fruit, cream, and mint flavor families were tested in this study (Table 1).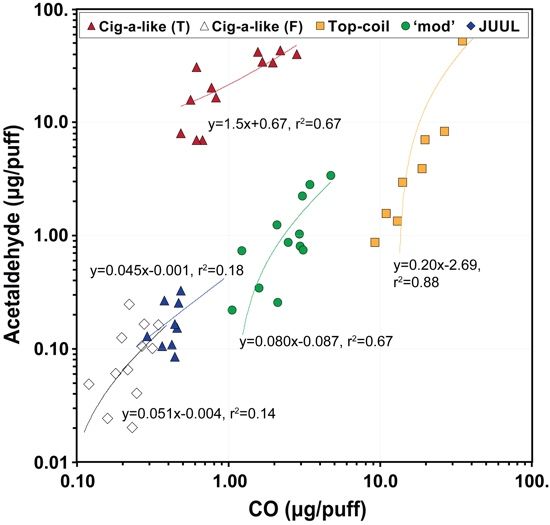
Int. J. Environ. Res. Public Health 2020, 17, 2767                                                                           3 of 15

 Table 1. E-cigarette brands, e-liquid types, and e-cigarette aerosol generation conditions used in this study 1 .

       Type            E-liquid (Flavor, Nicotine)         Puff Duration (s)      Puff Volume (mL)        Power Output (watt)
                           Tobacco, 18 mg/mL                    2, 3, 4, 5              100, 133                    5.2
    Cig-a-like
                            Grape, 18 mg/mL                         4                     100                       5.2
     Top-coil      Strawberry-watermelon, 3 mg/mL               2, 3, 4, 5          40, 67, 100, 133                4.9
                   Strawberry-watermelon, 3 mg/mL               2, 3, 4, 5          40, 67, 100, 133            40, 50, 60
                       Peach-lemonade, 3 mg/mL                      4                      40                       50
      ‘mod’
                    Vanilla-almond-milk, 6 mg/mL                    4                      40                       50
                        Unflavored, no-nicotine                     4                      40                   40, 50, 60
                        Fruit melody, 59 mg/mL                  2, 3, 4, 5              100, 133                   6–9
       ‘pod’              Cool mint, 59 mg/mL                       4                     100                      6–9
      (JUUL)           Virginia tobacco, 59 mg/mL                   4                     100                      6–9
                        Creme brulee, 59 mg/mL                      4                     100                      6–9
      1 The effect of different puff durations (2, 3, 4, and 5 s) and puff volumes (40, 67, 100, and 133 mL) were tested at a
      fixed flow rate (1.5 L/min) and puff duration (4 s), respectively. Power output conditions for the Brand III e-cigarette
      were tested under 40 mL puff volume and 4-s puff duration.

2.2. E-Cigarette Aerosol Generation
     E-cigarette aerosols were generated using a lab-made automated vaping system (Figure S2).
The effect of puff topography was tested by controlling either puff duration or puff flow rate (Table 1).
The puffing parameters used in this study cover the range of e-cigarette vaping topography data
reported in the literature (80.4–133 mL volume and 3.3–4.16 s duration) [18,19,31–33]. A square-shaped
flow profile was used as it was observed during actual e-cigarette use [19,34]. A 30-s puff interval
was used throughout the study. The effect of power output was investigated using the ‘mod’ device,
because it was the only device used in this study that allowed adjusting power output.

2.3. CO Measurements
      Concentrations of CO emitted from the e-cigarettes were measured using a Model 8830 CO
Analyzer (Teledyne Monitor Labs, Englewood, CO, USA) connected to the vaping machine via a
2-m-long, 14 -inch outer-diameter Teflon tubing (Figure S2). A long piece of tubing was used to equilibrate
the sample air temperature to the room temperature (24 ± 1 ◦ C). A quartz fiber filter was installed at the
inlet of the CO analyzer to protect the instrument. The analog output of the analyzer was continuously
recorded at a rate of 5 Hz using a digital-analog converter (LabJack U6 series, LabJack Corporation, CO,
USA). The CO analyzer was calibrated daily using a mixture of zero air and a CO standard gas (Airgas,
Radnor, PA, USA). The total amount of CO produced per puff was calculated by integrating peaks in
CO readings and multiplying them by the instrument sample flow rate (Figure S3). No interference
from PG or VG in CO measurements was detected.

2.4. Carbonyl Analysis
     The 2,4-Dinitrophenylhydrazine (DNPH)-coated glass fiber filters (ORBO 827, Supelco, Folsom,
CA, USA) followed by DNPH cartridges (Sep-Pak XPoSure Plus Short Cartridge, WAT047205, Waters,
Milford, MA, USA) were used to collect carbonyl compounds generated by five e-cigarette puffs.
All measurements were done in triplicate. A combination of DNPH filters with DNPH cartridges was
used to ensure that both particle- and gas-phase carbonyls were collected. After collection, filters and
cartridges were extracted with 2 mL of acetonitrile (HPLC grade, EMD Millipore, Burlington, MA,
USA). A 2-µL aliquot was then injected into an HPLC system (Waters 2690 Alliance with a model
996 photodiode array detector, Waters, Milford, MA, USA) equipped with a Polaris 3 column (C18-A,
3 µm, 100 × 2.0 mm, Agilent Technologies, Santa clara, CA, USA). DNPH-carbonyl adducts were
quantified at 360 nm, while full spectrum readings (210–400 nm) were used to confirm the identity of
individual compounds. Carbonyl concentrations were quantified using six-point external calibration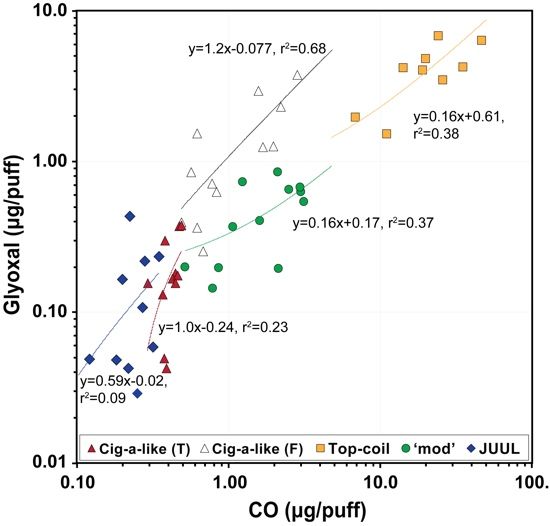
Int. J. Environ. Res. Public Health 2020, 17, 2767                                                    4 of 15

curves prepared from a certified calibration mixture (AccuStandard, New Haven, CT, USA). Details of
the analytical method and limits of detection can be found in Tables S2 and S3.

2.5. Nicotine Analysis
     To determine the amount of nicotine produced by the e-cigarette devices, five puffs of e-cigarette
aerosols were collected on a glass fiber filter (MilliporeSigma, Burlington, MA, USA). Filters were
then spiked with 40 µg of quinoline (98%, Sigma-Aldrich, Saint Louis, MO, USA) and extracted with
4 mL HPLC grade methanol (EMD Millipore, Billerica, MA, USA). Quinoline was used as an internal
standard due to its chemical similarity to nicotine, no interference in nicotine analysis, and its absence
in the samples. Filter extracts were analyzed using the HPLC system described above (Waters 2690
equipped with a Polaris 3 column). External standards of nicotine (≥99%, Sigma-Aldrich, Saint Louis,
MO, USA) and quinoline were prepared and quantified at 260 and 220 nm wavelengths, respectively.
It should be noted that JUUL aerosols contain nicotine salts. Since these salts have a similar UV
absorption maximum at 255–260 nm [35], they were quantified using the same nicotine standard.
Details of nicotine analysis can be found in Tables S4 and S5.

2.6. Statistical Analyses
     All statistical analyses in this study were done using the R software package version 3.4.3
(R Development Core Team, Vienna, Austria). Two-tailed Student’s t-tests and simple linear regression
analysis were used to assess the effects of different parameters tested in this study. Pearson’s correlation
was used to assess relationship between CO and carbonyl compound emissions. Significances were
determined at p = 0.05.

3. Results and Discussion

3.1. Carbonyls and CO Emissions from the Different E-Cigarettes
     Carbonyl emissions varied among the e-cigarette devices and different e-liquids types (Figure 1a).
Our carbonyl emission result was similar to earlier studies that reported higher carbonyl emissions
from top-coil devices than other e-cigarette construction types (e.g., cig-a-like and bottom coil) [3–6].
The cig-a-like e-cigarette device with a tobacco-flavored e-liquid generated significantly higher
formaldehyde (2.65 ± 0.06 µg/puff), acetaldehyde (3.27 ± 0.17 µg/puff), and glyoxal (1.35 ± 0.17 µg/puff)
than the same e-cigarette with a grape-flavored e-liquid (p < 0.001). Notably, acetaldehyde emission
from the cig-a-like e-cigarette with the tobacco-flavored e-liquid was significantly higher than all the
other e-cigarettes (p < 0.001). The top-coil device generated the highest concentrations of formaldehyde
(4.80 ± 3.88 µg/puff) and glyoxal (5.01 ± 1.65 µg/puff) among the tested e-cigarettes. The ‘mod’ device
formed 0.17 ± 0.03 µg of acrolein per puff which was 3 to 6 times more than the acrolein concentrations
emitted from the other e-cigarettes (p = 0.048). The cig-a-like e-cigarette with the grape-flavored
e-liquid had the lowest carbonyl emissions followed by the JUUL. Among the JUUL flavors, fruit-flavor
generated the highest amounts of formaldehyde (0.14 ± 0.04 µg/puff, p = 0.074) than the other flavors
(0.07–0.10 µg formaldehyde/puff).
     Figure 1b shows CO emissions for the four e-cigarette devices. CO emissions of the cig-a-like
device with the tobacco-flavored e-liquid were 1.4 ± 0.7 µg/puff, which is 3.5 times higher than
those produced by the same e-cigarette with the grape-flavored e-liquid (0.4 ± 0.1 µg/puff, p = 0.070).
The top-coil device generated significantly larger amounts of CO (23.3 ± 3.1 µg/puff) than any of the
tested devices (p < 0.001). The cig-a-like and the JUUL with different e-liquids generated 16-86 times
less CO (0.4 ± 0.1 µg/puff) than the top-coil device. The ‘mod’ e-cigarette generated 10 times less
CO (2.2 ± 0.9 µg/puff) than the top-coil device even though both devices were filled with the same
strawberry-watermelon flavored e-liquid. To our knowledge, there was no systematic study on the
direct e-cigarette CO emissions to date. Our results demonstrate that e-cigarettes generate CO along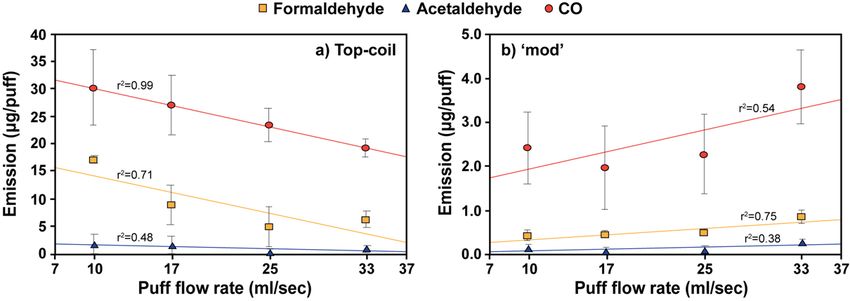
Int. J. Environ. Res. Public Health 2020, 17, 2767                                                                    5 of 15

with carbonyls. Similarly to carbonyls, CO is likely emitted due to thermal decomposition of e-liquid
components
Int.              [25,26].
     J. Environ. Res.        Further
                      Public Health 2020,in17,
                                            the   paper,
                                               x FOR PEERwe will provide more evidence that this is indeed the5case.
                                                          REVIEW                                                of 15

                 (a)Carbonyl
             1. (a)
      Figure 1.     Carbonyl and
                               and(b)
                                    (b)CO
                                        COconcentrations
                                            concentrationsfor
                                                            forthethecombinations
                                                                       combinationsof ofthe
                                                                                         thefour
                                                                                             fourdifferent
                                                                                                  different e-cigarette
                                                                                                            e-cigarette
      brands (cig-a-like, top-coil, ‘mod’, and JUUL) and flavored e-liquids (tobacco, fruit, mint, and cream
      brands  (cig-a-like, top-coil, ‘mod’, and JUUL)    and   flavored   e-liquids (tobacco,  fruit, mint, and
      flavored). The
      flavored).  The 50-watt
                      50-watt power
                               power output
                                       output was
                                              was used
                                                   used for
                                                         for ‘mod’
                                                              ‘mod’ device.
                                                                      device. Vaping
                                                                               Vaping topography
                                                                                       topography was was 100-mL
                                                                                                          100-mL puff
                                                                                                                   puff
      volume, 4-sec
      volume,  4-s puff duration,
                     puff          and
                           duration,    30-s
                                      and    puff puff
                                          30-sec  interval for all
                                                       interval   forconditions  (n = (n
                                                                      all conditions  3).= 3).

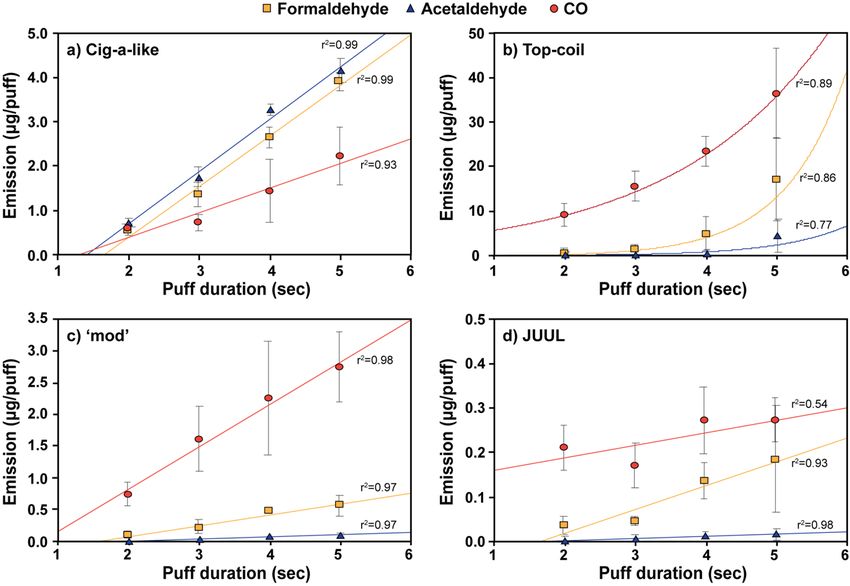
3.2. Effect of Vaping Topography on E-Cigarette Emissions
3.2. Effect of Vaping Topography on E-Cigarette Emissions
      Figure 2 presents formaldehyde, acetaldehyde, and CO emissions for the four tested e-cigarettes
      Figure 2 presents formaldehyde, acetaldehyde, and CO emissions for the four tested e-cigarettes
under different puff durations. Detailed carbonyl concentrations and linear regression parameters
under different puff durations. Detailed carbonyl concentrations and linear regression parameters
(nonlinear regression parameters for the top-coil e-cigarette) under different puff durations are tabulated
(nonlinear regression parameters for the top-coil e-cigarette) under different puff durations are
in Tables S6–S8. CO and carbonyl emissions for cig-a-like, ‘mod’, and JULL showed statistically
tabulated in Tables S6, S7, and S8. CO and carbonyl emissions for cig-a-like, ‘mod’, and JULL showed
significant increases with the puff duration (p = 0.007), except for JUUL emissions of CO (p = 0.100).
statistically significant increases with the puff duration (p = 0.007), except for JUUL emissions of CO
The amount of heat transferred to the coil was directly proportional to the puff duration. This explains
(p = 0.100). The amount of heat transferred to the coil was directly proportional to the puff duration.
the linear relationships between the puff duration and the pollutant emissions observed in our study.
This explains the linear relationships between the puff duration and the pollutant emissions observed
A similar effect of puff duration on nicotine e-cigarette yields have been reported elsewhere [14].
in our study. A similar effect of puff duration on nicotine e-cigarette yields have been reported
The intercepts of regression lines with the x-axis indicate a minimum puff duration at which measurable
elsewhere [14]. The intercepts of regression lines with the x-axis indicate a minimum puff duration
carbonyl and CO emissions occur. Based on the estimated regression parameters, the tested e-cigarette
at which measurable carbonyl and CO emissions occur. Based on the estimated regression
devices start generating toxic compounds after approximately 1 s since e-cigarette devices need some
parameters, the tested e-cigarette devices start generating toxic compounds after approximately 1 sec
time to heat up the atomizer coils to reach certain stable temperatures [4].
since e-cigarette devices need some time to heat up the atomizer coils to reach certain stable
      It should be noted that the top-coil e-cigarette emissions showed an exponential increase with
temperatures [4].
puff duration (Figure 2b). Even though all top-coil emissions could be approximated with a linear
      It should be noted that the top-coil e-cigarette emissions showed an exponential increase with
relationship due to the large variability in the data, a nonlinear (exponential) regression showed a
puff duration (Figure 2b). Even though all top-coil emissions could be approximated with a linear
better fit with lower residual errors than linear regression. For CO and formaldehyde emitted from the
relationship due to the large variability in the data, a nonlinear (exponential) regression showed a
top-coil device, the exponential dependence was statistically significant (p = 0.027), with acetaldehyde
better fit with lower residual errors than linear regression. For CO and formaldehyde emitted from
and acrolein demonstrating a weaker significance (p = 0.274 and p = 0.055, respectively). The significant
the top-coil device, the exponential dependence was statistically significant (p = 0.027), with
nonlinear increase of carbonyl and CO emissions from the top-coil device with puff duration could be
acetaldehyde and acrolein demonstrating a weaker significance (p = 0.274 and p = 0.055, respectively).
due to limited liquid transfer capacity of the wick in the top-coil devices. An imbalance in heat vs.
The significant nonlinear increase of carbonyl and CO emissions from the top-coil device with puff
e-liquid transfer could lead to overheating of the e-liquid increasing generation of carbonyl and CO.
duration could be due to limited liquid transfer capacity of the wick in the top-coil devices. An
imbalance in heat vs. e-liquid transfer could lead to overheating of the e-liquid increasing generation
of carbonyl and CO.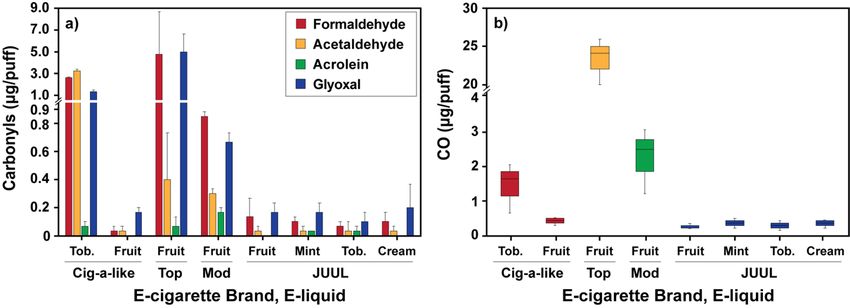
Int. J. Environ. Res. Public Health 2020, 17, 2767 6 of 15
Int. J. Environ. Res. Public Health 2020, 17, x FOR PEER REVIEW 6 of 15
Figure 2. Dependence
Dependence of of carbonyl
carbonylandandCOCOemissions
emissionsononpuff duration
puff forfor
duration thethe
(a) (a)
cig-a-like, (b) top-coil,
cig-a-like, (b) top-
(c) ‘mod’, and (d) JUUL ‘pod’ e-cigarette devices at 25 mL/s puff flow rate (error bars represent
coil, (c) ‘mod’, and (d) JUUL ‘pod’ e-cigarette devices at 25 mL/sec puff flow rate (error bars representstandard
deviation deviation
standard of three independent measurements).
of three independent The 50-wattThe
measurements). power output
50-watt was used
power outputfor was
‘mod’ device.
used for
Linear device.
‘mod’ and, in Linear
the case of the
and, top-coil
in the device,
case of exponential
the top-coil regression
device, linesregression
exponential for each compound are
lines for each
also shown.are also shown.
compound
Carbonyl and
Carbonyl and CO
CO emissions
emissions for for the
the top-coil
top-coil and
and ‘mod’
‘mod’ e-cigarette
e-cigarette devices
devices were
were found
found toto be
be fairly
fairly
insensitive to the puff volume (Figure 3, Tables S9 and S10). For the top-coil e-cigarette,
insensitive to the puff volume (Figure 3, Tables S9 and S10). For the top-coil e-cigarette, CO and all CO and all
carbonyls but acetaldehyde emissions significantly decreased with increasing
carbonyls but acetaldehyde emissions significantly decreased with increasing puff flow rates (p =puff flow rates (p = 0.047).
Acetaldehyde emission
0.047). Acetaldehyde from the
emission fromtop-coil e-cigarette
the top-coil also showed
e-cigarette a decreasing
also showed trend,trend,
a decreasing though with
though
a weak statistical significance (p = 0.266). In contrast, the ‘mod’ device generated
with a weak statistical significance (p = 0.266). In contrast, the ‘mod’ device generated higher higher carbonyls
and CO atand
carbonyls higher
CO flow ratesflow
at higher but only
ratesformaldehyde showed ashowed
but only formaldehyde significant positive slope
a significant (p =slope
positive 0.003).
(p
The cig-a-like and JUUL devices could not be tested at puff flow rates below
= 0.003). The cig-a-like and JUUL devices could not be tested at puff flow rates below 17 mL/sec 17 mL/s because such
flows could
because suchnot activate
flows couldoperation
not activateof these devices.
operation By comparing
of these devices. Byestimated
comparing regression
estimatedparameters
regression
(Table
parameters (Table S10), higher puff flow rates did not change carbonyl emissions for theand
S10), higher puff flow rates did not change carbonyl emissions for the cig-a-like JUUL
cig-a-like
e-cigarettes (p > 0.052) except for glyoxal from the cig-a-like device (p =
and JUUL e-cigarettes (p > 0.052) except for glyoxal from the cig-a-like device (p = 0.002).0.002).
The dependence of carbonyl and CO emissions on the puff flow rate appears to vary with the
e-cigarette construction. In our study, e-cigarette carbonyl and CO emissions showed a decreasing trend
with increasing puff flow rate for the top-coil device, while the ‘mod’ e-cigarette showed an opposite,
though weak, trend. Our results with the top-coil e-cigarette were consistent with previous reports.
Previous studies showed decreased total particle mass concentration [36] and carbonyl emissions [17] at
higher flow rates using cig-a-like, top-coil, bottom-coil, and JUUL devices. Faster air flows through the
heating chamber were shown to decrease coil temperature [16], leading to lower aerosol and carbonyl
emissions. However, in our study, the ‘mod’ e-cigarette generated more carbonyls and CO at higher
flow rates. Different emission trends for the top-coil and ‘mod’ device could be due to differences in
e-cigarette construction and properties (e.g., power output, chamber design, air hole size, air flow
regime, coil resistance, etc.), though the exact cause of this was unclear and needs to be further studied.
These findings demonstrate that the effect of vaping topography should be carefully considered
Figure
to test 3. Impact
e-cigarette of puff flow
chemical rate on carbonyl
emissions. Previousand CO emissions
reports used puff fordurations
the (a) top-coil
of 1 and
to 2(b) ‘mod’ e- and
s [6,37–40]
cigarette
vaping devices
flow rates offor a 4-secmL/s
10–16.7 puff duration. The tested
[4,5,8,17,41,42] to flow rates the
measure of 10, 17, 25, and 33
potentially mL/sec emissions
harmful correspondfrom
to 40, 67, 100, and 133 mL puff volumes. A 50-watt power output was used for ‘mod’ device. Error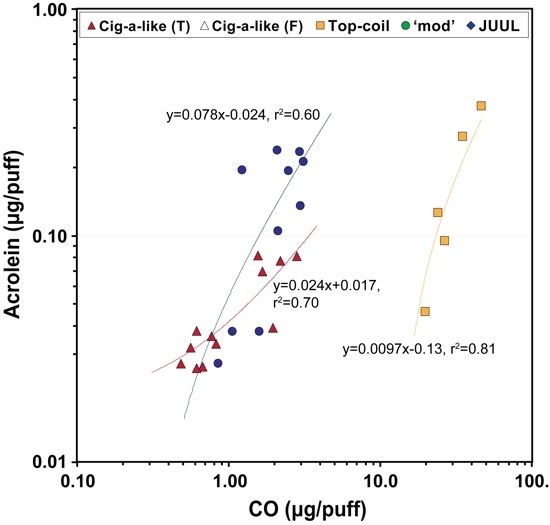
Carbonyl and CO emissions for the top-coil and ‘mod’ e-cigarette devices were found to be fairly
insensitive to the puff volume (Figure 3, Tables S9 and S10). For the top-coil e-cigarette, CO and all
carbonyls but acetaldehyde emissions significantly decreased with increasing puff flow rates (p =
Int. J. Environ. Res. Public Health 2020, 17, x FOR PEER REVIEW 7 of 15
0.047). Acetaldehyde
Int. J. Environ. emission
Res. Public Health from
2020, 17, 2767the top-coil e-cigarette also showed a decreasing trend, though 7 of 15
with bars a weak statistical significance (p = 0.266). In contrast, the ‘mod’ device
represent standard deviation of three independent measurements. Regression lines for each
generated higher
carbonyls and CO
compound at higher
are also shown.flow rates but only formaldehyde showed a significant positive slope (p
=e-cigarettes.
0.003). The Depending
cig-a-like and on JUUL
the e-cigarette construction,
devices could levels at
not be tested ofpuff
potentially harmful
flow rates belowcompounds
17 mL/sec
reported
because in
Thesuch the previous
flows could
dependence studies can
not activate
of carbonyl cause
and operation the
CO emissions over-
of theseor under-estimation
devices.
on the By comparing
puff flow of
rate appearsthe actual
estimated exposures
regression
to vary with the e-
since
parameterse-cigarette
(Table users
S10),showed
higher much
puff longer
flow ratespuff
did durations
not change(3.5 to 4
carbonyl s)
cigarette construction. In our study, e-cigarette carbonyl and CO emissions showed a decreasing and higher
emissions puff
for theflow rates
cig-a-like
(24–38
and JUUL
trend mL/s) [31,32].
withe-cigarettes
increasing puff(p > 0.052)
flow rateexcept
forfor
theglyoxal
top-coilfrom the cig-a-like
device, while thedevice
‘mod’ (p = 0.002). showed an
e-cigarette
opposite, though weak, trend. Our results with the top-coil e-cigarette were consistent with previous
reports. Previous studies showed decreased total particle mass concentration [36] and carbonyl
emissions [17] at higher flow rates using cig-a-like, top-coil, bottom-coil, and JUUL devices. Faster air
flows through the heating chamber were shown to decrease coil temperature [16], leading to lower
aerosol and carbonyl emissions. However, in our study, the ‘mod’ e-cigarette generated more
carbonyls and CO at higher flow rates. Different emission trends for the top-coil and ‘mod’ device
could be due to differences in e-cigarette construction and properties (e.g., power output, chamber
design, air hole size, air flow regime, coil resistance, etc.), though the exact cause of this was unclear
and needs to be further studied.
These findings demonstrate that the effect of vaping topography should be carefully considered
to test e-cigarette chemical emissions. Previous reports used puff durations of 1 to 2 sec [6,37–40] and
vaping flow rates of 10–16.7 mL/sec [4,5,8,17,41,42] to measure the potentially harmful emissions
Impactof
Figure 3. Impact ofpuff
puffflow
flowrate
rateon
oncarbonyl
carbonyland
andCOCOemissions
emissions forfor
thethe
(a)(a) top-coil
top-coil andand
(b)(b) ‘mod’
‘mod’ e-
from e-cigarettes. Depending on the e-cigarette construction, levels of potentially harmful
e-cigarette devices for a 4-s puff duration. The tested flow rates of 10, 17, 25, and 33 mL/s correspond
cigarette devices for a 4-sec puff duration. The tested flow rates of 10, 17, 25, and 33 mL/sec correspond to
compounds
40,40,
67,67,reported
100, andand in
mLthe
133133 puffprevious
volumes. studies canpower
A 50-watt causeoutput
the over-
was wasor under-estimation
used for ‘mod’ device. of the
Error actual
bars
to 100, mL puff volumes. A 50-watt power output used for ‘mod’ device. Error
exposures since
represent e-cigarette
standard users
deviation showed
of three much longer
independent puff durations
measurements. Regression (3.5lines
to 4for
sec) and
each higher puff
compound
flow are
rates (24–38
also shown. mL/sec) [31,32].
Effect of Power Output and Flavor on CO Emission
3.3. Effect
Figure 4 shows CO emissions measured measured at different power outputs and using different e-liquid
flavors with the ‘mod’ e-cigarette. A A clear,
clear, linear
linear increase
increase of CO emissions with e-cigarette power
output was observed for the the strawberry-watermelon
strawberry-watermelon flavored e-liquid (Figure 4a). CO CO emissions
emissions from
from
unflavored liquid
an unflavored (PG:VG==3:7)
liquid(PG:VG 3:7)were
weresignificantly
significantly lower
lower than
than those
those from
from thethe flavored
flavored liquid
liquid at
at all
all tested
tested power
power outputs
outputs (Figure
(Figure 4b).4b).
CO CO emissions
emissions increased
increased by 0.057
by 0.057 per per
µg/puff
μg/puff 1 W1ofWpower
of power for
for the
the flavored
flavored e-liquid
e-liquid < 0.001)
(p
Int. J. Environ. Res. Public Health 2020, 17, 2767                                                         8 of 15

     Increasing carbonyl emissions with increasing e-cigarette power is a well-known phenomenon:
Applying a higher power to the coil increases its temperature, facilitating thermal decomposition of
e-liquid components [4–6]. The co-occurrence of CO and carbonyl emissions in our experiments and
the fact that CO emissions increase with e-cigarette power output indicate that, similarly to carbonyls,
CO is produced by thermal decomposition of e-liquid constituents [20,21]. The observed variation in
CO and carbonyl emissions among different flavored and unflavored liquids confirms the fact that these
pollutants originate due to e-liquid breakdown and not because of decomposition of a liquid-starved
wick material (the so-called dry puff phenomenon). Flavoring compounds in e-liquids were shown
to be thermally unstable at conditions encountered in e-cigarettes, being responsible for the major
part of carbonyls emitted by e-cigarettes [3]. Our results show that, similarly to carbonyl emissions,
CO production in e-cigarettes appears to be dominated by flavoring compounds. The observed
differences in CO emissions between flavored e-liquids are likely due to differences in thermal stability
of individual flavoring compounds or differences in thermal decomposition pathways leading to CO
formation. Further studies on the thermal breakdown of flavoring chemicals are desirable for better
understanding of e-cigarette CO and carbonyl emissions.

3.4. Correlation between Carbonyls and CO Emissions
     Figure 5 and Table 2 show a relationship and Pearson’s correlation coefficients, respectively,
between CO and major carbonyls in e-cigarette aerosols, which were measured simultaneously.
Formaldehydes emitted from the top-coil device (r = 0.909, r2 = 0.83), ‘mod’ e-cigarette (r = 0.847,
r2 = 0.72), and cig-a-like device with tobacco flavored e-liquid (r = 0.820, r2 = 0.67) were significantly
correlated with CO levels. Measured CO emissions also correlated well with other carbonyls
(0.609 < r < 0.857) except for the cig-a-like with a grape flavored e-liquid (0.380 < r < 0.478) and the
JUUL e-cigarette with all tested flavors (0.296 < r < 0.429) (Table 2).
     Different conventional cigarettes were reported to have strong linear relationship (r2 = 0.90–0.95)
between emitted CO and acetaldehyde [43]. This is because their formation is dominated by thermal
decomposition and incomplete combustion of tobacco leaf and the wrapping paper, which does not
differ significantly among different cigarettes [44]. Since the bulk of any e-liquid is composed of PG
and VG, and if these components dominated CO and carbonyl production as was proposed in other
studies [6,45], there would be no differences in CO-carbonyl relationship among different flavored
e-liquids. However, we observed a wide variation in slopes and intercepts for the different e-cigarette
devices and e-liquids tested in this study. This proves that CO and carbonyl emissions are dominated
by e-liquid components other than PG and VG, such as flavoring compounds.

      Table 2. Correlation coefficients of CO and carbonyl compounds in e-cigarette aerosols. Asterisk marks
      (*) indicate Pearson’s correlation coefficients with statistical significance (p < 0.05).

               E-Cigarette Type             Formaldehyde       Acetaldehyde   Acrolein       Glyoxal
             Cig-a-like (tobacco)                    0.820 *      0.821 *      0.837 *        0.823 *
              Cig-a-like (grape)                      0.476        0.380          –            0.478
                  Top-coil                           0.909 *      0.857 *      0.901 *        0.620 *
                    ‘mod’                            0.847 *      0.855 *      0.776 *        0.609 *
                    JUUL                              0.335        0.429          –            0.296
Int. J. Environ. Res.
Res. Public
PublicHealth
Health2020,
2020,17,
17, x2767
FOR PEER REVIEW 9 of 15
(a) (b)
(c) (d)
Figure 5. Relationship between CO and (a) formaldehyde, (b) acetaldehyde, (c) acrolein, and (d)
Figure 5. Relationship between CO and (a) formaldehyde, (b) acetaldehyde, (c) acrolein, and (d)
glyoxal in e-cigarette aerosols. Cig-a-like e-cigarette was tested using tobacco (T) and grape (F) flavored
glyoxal in e-cigarette aerosols. Cig-a-like e-cigarette was tested using tobacco (T) and grape (F)
e-liquids. Fruit flavored e-liquids were used for top-coil, ‘mod’, and JUUL e-cigarettes.
flavored e-liquids. Fruit flavored e-liquids were used for top-coil, ‘mod’, and JUUL e-cigarettes.
3.5. E-Cigarette vs. Conventional Cigarette Emissions
Table 2. Correlation coefficients of CO and carbonyl compounds in e-cigarette aerosols. Asterisk
Carbonyl
marks and CO
(*) indicate emissions
Pearson’s from the
correlation tested e-cigarettes
coefficients were
with statistical generally(plower
significance < 0.05).than those from
conventional cigarettes except for formaldehyde emissions from the top-coil e-cigarette. According
E-cigarette
to the previous reports, Type
conventional Formaldehyde Acetaldehyde
cigarettes yielded 81.5–187.7Acrolein Glyoxal0.75–1.73 mg of
µg of nicotine,
Cig-a-like (tobacco)
CO, 1.08–15.4 µg of formaldehyde, and 0.820 *
5.88–81.5 µg of 0.821 *
acetaldehyde 0.837 *
per puff, 0.823 *
assuming 13 puffs per
Cig-a-like (grape) 0.476 0.380 – 0.478
cigarette [43,46–48]. All of the tested e-cigarettes under our experimental conditions generated 40 to
Top-coil 0.909 * 0.857 * 0.901 * 0.620 *
3618 times less CO than conventional cigarettes.
‘mod’ 0.847 *
The cig-a-like,
0.855 *
‘mod’, and JUUL
0.776 *
devices produced
0.609 *
less formaldehyde (3-JUUL to 120-fold) and acetaldehyde
0.335 (3- to 3950-fold)–than conventional
0.429 0.296 cigarettes.
The top-coil device generated 24 to 41 times less acetaldehyde, but formaldehyde emissions were
comparable (within
Different factors cigarettes
conventional of 0.5 to 1.3) to reported
were those of conventional
to have strongcigarettes. It should(rbe
linear relationship 2 =noted that,
0.90–0.95)
given the cancer potency factors [49] of formaldehyde (1.3 × 10 −5 ) and acetaldehyde (1.3 × 10⁻⁶ ), the
between emitted CO and acetaldehyde [43]. This is because their formation is dominated by thermal
lung cancer riskand
decomposition dueincomplete
to top-coil e-cigarette
combustion useofistobacco
only 5 times lower
leaf and thethan that ofpaper,
wrapping conventional cigarette
which does not
use. This
differ raises questions
significantly amongabout effectiveness
different cigarettesof top-coil
[44]. Sincedevices
the bulk forofsmoking harmisreduction.
any e-liquid composed of PG
and VG, and if these components dominated CO and carbonyl production as was proposed in other
studies [6,45], there would be no differences in CO-carbonyl relationship among different flavored e-
liquids. However, we observed a wide variation in slopes and intercepts for the different e-cigaretteInt. J. Environ. Res. Public Health 2020, 17, 2767 10 of 15
Nicotine and nicotine-normalized carbonyl and CO emissions for the four e-cigarettes are listed
in Table 3. Such normalization might help to better understand e-cigarette users’ exposure, because
most e-cigarette users are former cigarette smokers or dual users [50] who usually consume e-liquids
until they inhale sufficient levels of nicotine [51]. Thus, low nicotine yield e-cigarette users could
vape more frequently and, thus, increase exposure to harmful chemicals. Different e-liquid types and
vaping topographies measured in this study were combined to estimate carbonyl and CO emissions
per nicotine mass. Levels of nicotine, CO, and carbonyl emissions for the conventional cigarette smoke
were obtained from literatures [46–48,52]. The cig-a-like and ‘mod’ e-cigarettes emitted similar levels
of nicotine even though the ‘mod’ e-cigarette was used with e-liquid that had 6 times lower nicotine
content than cig-a-like device. This is because the ‘mod’ produces significantly more aerosol due to its
higher power output [53]. For the same reason, the top-coil e-cigarette generated 18 times less nicotine
than the ‘mod’ device with the same e-liquid (3 mg/mL nicotine content). In our study, we used a low
nicotine liquid, sold mostly for ‘mod’ e-cigarettes, to test the top-coil device. It is likely that actual
top-coil e-cigarette users will be using a higher nicotine content liquid as top-coil devices produce less
aerosol than ‘mod’ e-cigarettes. Even if we assume that the higher nicotine content liquids offered in
the market (e.g., 18–24 mg/mL) are used, nicotine intake for top-coil e-cigarette users still would be
2.6 times lower than the ‘mod’ device users with lower nicotine content liquid (i.e., 3 mg/mL). The
JUUL generated 2.9 times higher nicotine per puff than the conventional cigarette.
Table 3. Nicotine (µg/puff) and nicotine-normalized CO (COn ), formaldehyde (formaldehyden ),
acetaldehyde (acetaldehyden ), acrolein (acroleinn ), and glyoxal (glyoxaln ) concentrations (ng/puff/µg
nicotine) for four tested e-cigarettes. Values for conventional cigarettes are given for comparison 1 .
Nicotine Nicotine Normalized Concentration (ng/puff/µg Nicotine)
Device Type
(µg/puff)
COn Formaldehyden Acetaldehyden Acroleinn Glyoxaln
Cig-a-like 104 ± 10.4 13.8 ± 68.8 25.6 ± 6.13 31.6 ± 16.4 0.47 ± 1.7 13.8 ± 68.8
Top-coil 2 6.0 ± 1.3 556 ± 337 114 ± 427 8.92 ± 38.5 1.52 ± 6.99 556 ± 337
‘mod’ 106 ± 11.8 21.1 ± 76.3 7.77 ± 1.12 2.61 ± 0.54 1.64 ± 2.89 21.1 ± 76.3
JUUL 390 ± 30.5 1.01 ± 7.14 0.34 ± 4.34 0.06 ± 2.06 0.02 ± 0.66 1.01 ± 7.14
Cigarette 3 134 ± 75.1 10893 ± 7313 72.4 ± 84.8 551 ± 669 127 ± 78.4 10893 ± 7313
1 Nicotine, CO, and carbonyl data from the two (tobacco and fruit [1.8% nicotine]), one (fruit [0.3% nicotine]),
one (fruit [0.3% nicotine]), and four (fruit, mint, tobacco, and cream [5% nicotine]) e-liquids were combined for
the cig-a-like, top-coil, ‘mod’, and JUUL e-cigarettes under 67–133 mL puff volumes and 3–5-s puff durations,
respectively. 2 Nicotine-normalized carbonyl and CO emissions were adjusted by 7 times to reflect top-coil users’
e-liquid nicotine contents (see explanation in the text). 3 Nicotine, CO, and carbonyl emissions for conventional
cigarette were obtained from [46–48,52].
The tested e-cigarette devices usually shown to have lower nicotine-normalized carbonyls and CO
emissions than conventional tobacco cigarettes. The cig-a-like, ‘mod’, and JUUL e-cigarettes showed
lower nicotine-normalized CO (517- to 10,802-fold), formaldehyde (2.8- to 215-fold), acetaldehyde
(17- to 9156-fold), and acrolein (78- to 6529-fold) emissions than those of conventional cigarettes.
Assuming that an 18–24 mg/mL nicotine content is more realistic for top-coil e-cigarette than 3 mg/mL
used in our study, we adjusted nicotine-normalized emissions by a factor of 7. Nicotine-normalized
CO, acetaldehyde, and acrolein emissions for the top-coil device were then 20, 62, and 84 times lower
than conventional cigarettes, respectively, while nicotine-normalized formaldehyde emissions were
still 1.6 times higher. Cig-a-like, top-coil, and ‘mod’ devices generated 2–40 times more glyoxal per
unit nicotine than conventional cigarettes. Glyoxal emissions could be of concern, as glyoxal was
reported [54] to cause allergic reaction at 9.4–21 µg/m3 , which is similar or lower than estimated daily
glyoxal exposures for the cig-a-like, top-coil, and ‘mod’ e-cigarette users (assuming 200 puffs/day).
3.6. Public Health Implications
To our knowledge, this is the first study of carbonyl and CO emissions from JUUL devices under
various vaping conditions. Carbonyl and CO emissions from the JUUL were significantly lower thanInt. J. Environ. Res. Public Health 2020, 17, 2767 11 of 15
those of conventional cigarettes and the other e-cigarettes tested in this study. JUUL is currently the
most popular e-cigarette device in the U.S. [27,28]. Low carbonyl and CO emissions observed in
our study and the nondetectable levels of benzene reported by [9] suggest that JUUL devices might
benefit tobacco-use cessation efforts. However, it should be pointed out that the high nicotine content
of the JUUL (59 mg/mL) could be a problem for the United States Food and Drug Administration
(U.S. FDA)’s efforts to combat nicotine addiction [55]. Recently, the FDA proposed a new rule to
lower the maximum allowable nicotine content of combustible cigarettes [55]. The JUUL e-cigarette
generated 3 to 13 times more nicotine than the non-addictive nicotine level proposed by the FDA
(0.5 mg/cig, 40–50 µg/puff) [55]. Potential harm caused by tobacco products is closely connected with
the addictiveness of nicotine [56]. Indeed, young adults who used e-cigarettes were shown to be
4 times more likely to start conventional cigarette smoking than non-e-cigarette users [57]. Moreover,
among adolescent and young adult e-cigarette users, pod-based e-cigarette users (e.g., JUUL) reported
much higher frequency of vaping within 30 days (58.8%) than users of other e-cigarettes (30.1%) and
conventional cigarettes (28.3%) [58]. Thus, the high nicotine addictiveness of JUUL could still harm
public health by initiating new tobacco product users.
Moreover, it is worth mentioning that daily exposure estimates for the all tested e-cigarettes
including JUUL could exceed acute exposure limits. Daily carbonyl exposures were estimated using
measured emissions in this study, reported vaping frequency (200 puffs/day) [18,31], daily air inhalation
volume (16 m3 /day) [59] for healthy adult population. Estimated daily formaldehyde (83.8 µg/m3 /day)
and acetaldehyde (18.0 µg/m3 /day) exposures for the top-coil e-cigarette were shown to exceed an acute
minimal risk level (MRL) for 1–14 days average formaldehyde exposure (MRL = 50 µg/m3 ) [60] and the
reference concentration (RfC = 9 µg/m3 ) [49] for daily average acetaldehyde exposure concentration,
respectively. All tested e-cigarettes showed 9–104 times higher daily acrolein exposures than RfC
value (0.02 µg/m3 ). The acute exposure estimates indicate that, despite e-cigarettes usually shown to
generate less harmful chemicals than conventional cigarettes, e-cigarettes are not harmless. Thus, use
of e-cigarettes, especially JUUL-like devices, among youth and non-smokers should be addressed to
promote public health.
3.7. Limitations
This study had several limitations. First of all, even though we tested the four most popular
e-cigarettes under a wide range of vaping conditions, we only included one e-cigarette in each device
category due to limited resources available. As a recent study showed, a ‘mod’ e-cigarette with different
coil configurations could generate varying levels of carbonyls under the same vaping pattern [53]. It is
worth mentioning that extreme vaping conditions (e.g., ‘mod’ device with over 100-watt power output)
could also alter carbonyls and CO emissions. Thus, the results of our study should be carefully examined
to extrapolate beyond our experimental conditions. Further, the high amounts of PG/VG particles
emitted from e-cigarettes (especially the ‘mod’ device) might affect carbonyl sampling efficiency.
However, we used the best available carbonyl sampling method (DNPH filter followed by DNPH
cartridge) for both particle and gas phase compounds, while other studies used a DNPH cartridge or
an impinger containing DNPH solution, which is not suitable for samples containing large amounts of
particles [61].
4. Conclusions
This study provides a comprehensive examination of how different e-cigarette types and use
patterns affect e-cigarette emissions of carbonyls and CO. To the best of the authors’ knowledge, this is
the first systematic study simultaneously measuring both carbonyl and CO levels emitted from different
types of e-cigarettes. The study demonstrates that higher carbonyl and CO levels are associated with
higher power settings, longer puff durations, and e-liquids with flavors. The top-coil type was found
to produce the highest emissions among the studied devices under the vaping conditions used in this
study. The ‘pod’ type device (i.e., JUUL) could emit significantly higher levels of nicotine than otherInt. J. Environ. Res. Public Health 2020, 17, 2767 12 of 15
devices, which could increase the risk of addiction, especially among the youth. Therefore, regulatory
agencies should better inform youth and their parents to minimize the potential risks of vaping and
public health burdens. Regulations of both e-liquid nicotine content (e.g., below non-addictive levels
discussed in Section 3.5) and harmful chemical emissions should also be considered to better protect
public health.
Carbonyl and CO emissions correlated with each other for all e-cigarette devices and e-liquids
studied. However, these correlations varied among devices and e-liquid flavors, which suggests that
chemical processes leading to carbonyl and CO formation depend largely on e-liquid components other
than PG and VG, i.e., on e-liquid flavorings. These results have significant implications for regulating
e-cigarette flavorings as they clearly influence production of harmful constituents. This study also
demonstrated that carbonyl and CO emissions not only strongly depend on vaping topography, but
that this dependence also varies among e-cigarette types. An important implication of this finding is
that the current e-cigarette testing protocols, such as International Organization for Standardization
(ISO) [62] and Cooperation Centre for Scientific Research Relative to Tobacco (CORESTA) [34] that use
fixed puff topography (3-s puff duration, 55 mL puff volume, and 30-s interval), cannot adequately
predict e-cigarette emissions at the wide range of real-world e-cigarette vaping patterns. A more
robust e-cigarette testing protocol is needed to better aid regulators, policy makers, and public
health professionals.
Supplementary Materials: The following are available online at http://www.mdpi.com/1660-4601/17/8/2767/s1.
Figure S1: E-cigarette devices used in this study. Figure S2: Scheme of E-cigarette aerosol testing system. Figure S3:
Example signal obtained from the CO analyzer. Table S1: Descriptions of the e-cigarette brands, e-liquid types, and
e-cigarette aerosol generation conditions used in this study. Table S2: Detailed descriptions of chromatographic
condition for the carbonyl-DNPH analysis. Table S3: Limit of detections (LOD) and limit of quantifications (LOQ)
for carbonyl compounds. Table S4: Detailed descriptions of chromatographic condition for the nicotine analysis.
Table S5: Limit of detections (LOD) and limit of quantifications (LOQ) for carbonyl compounds. Table S6: Carbonyl
levels (ng/puff) and e-liquid consumption (mg/puff) under different puff durations. Blank values indicate below
LOD or LOQ. Table S7: Linear regression parameters (estimate ± standard error) for e-cigarette emissions and
puff durations (emission = β1 × duration + β0). Table S8: Nonlinear regression parameters (estimate ± standard
error) for top-coil emissions and puff durations (emission = a × e(b × duration) ). Table S9: Carbonyl levels (ng/puff)
and e-liquid consumption (mg/puff) under different puff flow rates. Blank values indicate below LOD or LOQ.
Cig-a-like and JUUL were not tested under 10 and 17 mL/s puff flow rates. Table S10: Linear regression parameters
(estimate ± standard error) between e-cigarette emissions and flow rates (emission = β1 × flow rate + β0).
Author Contributions: Conceptualization, A.K., Y.S. and V.S.; methodology, A.K. and Y.S.; resources, A.K. and
Y.S.; formal analysis, Y.S. and C.B.; investigation, Y.S., A.K., and V.S.; visualization, Y.S. and A.K.; writing—original
draft preparation, Y.K. and A.K.; writing—review and editing, Y.S., A.K., V.S. and C.B.; supervision, A.K.; project
administration, A.K.; funding acquisition, A.K. All authors have read and agreed to the published version of
the manuscript.
Funding: This research received no external funding.
Acknowledgments: This work was carried out with internal funding provided by the Desert Research Institute.
Conflicts of Interest: The authors declare no conflict of interest.
References
1. WHO. Electronic nicotine delivery systems, Report by WHO. In Proceedings of the Conference of the Parties
to the World Health Organization Framework Convention on Tobacco Control, Moscow, Russia, 13–18
October 2014.
2. Allen, J.G.; Flanigan, S.S.; LeBlanc, M.; Vallarino, J.; MacNaughton, P.; Stewart, J.H.; Christiani, D.C. Flavoring
Chemicals in E-Cigarettes: Diacetyl, 2, 3-Pentanedione, and Acetoin in a Sample of 51 Products, Including
Fruit-, Candy-, and Cocktail-Flavored E-Cigarettes. Environ. Health Perspect. 2015, 124, 733–739. [CrossRef]
[PubMed]
3. Khlystov, A.; Samburova, V. Flavoring compounds dominate toxic aldehyde production during e-cigarette
vaping. Environ. Sci. Technol. 2016, 50, 13080–13085. [CrossRef] [PubMed]Int. J. Environ. Res. Public Health 2020, 17, 2767 13 of 15
4. Geiss, O.; Bianchi, I.; Barrero-Moreno, J. Correlation of volatile carbonyl yields emitted by e-cigarettes with
the temperature of the heating coil and the perceived sensorial quality of the generated vapours. Int. J. Hyg.
Envirn. Health 2016, 219, 268–277. [CrossRef]
5. Gillman, I.; Kistler, K.; Stewart, E.; Paolantonio, A. Effect of variable power levels on the yield of total aerosol
mass and formation of aldehydes in e-cigarette aerosols. Regul. Toxicol. Pharmacol. 2016, 75, 58–65. [CrossRef]
6. Kosmider, L.; Sobczak, A.; Fik, M.; Knysak, J.; Zaciera, M.; Kurek, J.; Goniewicz, M.L. Carbonyl compounds
in electronic cigarette vapors—Effects of nicotine solvent and battery output voltage. Nicotine Tob. Res. 2014,
16, 1319–1326. [CrossRef] [PubMed]
7. Goniewicz, M.L.; Gawron, M.; Smith, D.M.; Peng, M.; Jacob, P.; Benowitz, N.L. Exposure to nicotine and
selected toxicants in cigarette smokers who switched to electronic cigarettes: A longitudinal within-subjects
observational study. Nicotine Tob. Res. 2017, 19, 160–167. [CrossRef] [PubMed]
8. Sleiman, M.; Logue, J.M.; Montesinos, V.N.; Russell, M.L.; Litter, M.I.; Gundel, L.A.; Destaillats, H. Emissions
from electronic cigarettes: Key parameters affecting the release of harmful chemicals. Environ. Sci. Technol.
2016, 50, 9644–9651. [CrossRef]
9. Pankow, J.F.; Kim, K.; McWhirter, K.J.; Luo, W.; Escobedo, J.O.; Strongin, R.M.; Duell, A.K.; Peyton, D.H.
Benzene formation in electronic cigarettes. PLoS ONE 2017, 12, e0173055. [CrossRef]
10. Schripp, T.; Markewitz, D.; Uhde, E.; Salthammer, T. Does e-cigarette consumption cause passive vaping?
Indoor Air 2013, 23, 25–31. [CrossRef]
11. Williams, M.; Villarreal, A.; Bozhilov, K.; Lin, S.; Talbot, P. Metal and silicate particles including nanoparticles
are present in electronic cigarette cartomizer fluid and aerosol. PLoS ONE 2013, 8, e57987. [CrossRef]
12. Olmedo, P.; Goessler, W.; Tanda, S.; Grau-Perez, M.; Jarmul, S.; Aherrera, A.; Chen, R.; Hilpert, M.; Cohen, J.E.;
Navas-Acien, A. Metal concentrations in e-cigarette liquid and aerosol samples: The contribution of metallic
coils. Environ. Health Perspect. 2018, 126, 027010. [CrossRef]
13. Talih, S.; Balhas, Z.; Salman, R.; El-Hage, R.; Karaoghlanian, N.; El-Hellani, A.; Baassiri, M.; Jaroudi, E.;
Eissenberg, T.; Saliba, N. Transport phenomena governing nicotine emissions from electronic cigarettes:
Model formulation and experimental investigation. Aerosol Sci. Technol. 2017, 51, 1–11. [CrossRef] [PubMed]
14. Talih, S.; Balhas, Z.; Eissenberg, T.; Salman, R.; Karaoghlanian, N.; El Hellani, A.; Baalbaki, R.; Saliba, N.;
Shihadeh, A. Effects of user puff topography, device voltage, and liquid nicotine concentration on electronic
cigarette nicotine yield: Measurements and model predictions. Nicotine Tob. Res. 2015, 17, 150–157.
[CrossRef] [PubMed]
15. Qu, Y.; Kim, K.-H.; Szulejko, J.E. The effect of flavor content in e-liquids on e-cigarette emissions of carbonyl
compounds. Environ. Res. 2018, 166, 324–333. [CrossRef]
16. Zhao, T.; Shu, S.; Guo, Q.; Zhu, Y. Effects of design parameters and puff topography on heating coil
temperature and mainstream aerosols in electronic cigarettes. Atmos. Environ. 2016, 134, 61–69. [CrossRef]
17. Korzun, T.; Lazurko, M.; Munhenzva, I.; Barsanti, K.C.; Huang, Y.; Jensen, R.P.; Escobedo, J.O.; Luo, W.;
Peyton, D.H.; Strongin, R.M. E-Cigarette Airflow Rate Modulates Toxicant Profiles and Can Lead to
Concerning Levels of Solvent Consumption. ACS Omega 2018, 3, 30–36. [CrossRef] [PubMed]
18. Dautzenberg, B.; Bricard, D. Real-Time Characterization of E-Cigarettes Use: The 1 Million Puffs Study.
J. Addict. Res. Ther. 2015, 6, 229. [CrossRef]
19. Son, Y.; Weisel, C.; Wackowski, O.; Mainelis, G.; Schwander, S.; Delnevo, C.; Kipen, H.; Meng, Q. Evaluation
of e-vapor nicotine and nicotyrine concentrations emitted under various e-liquid compositions, device
settings and vaping topographies. Chem. Res. Toxicol. 2018, 31, 861–868. [CrossRef]
20. Casebolt, R.; Cook, S.J.; Islas, A.; Brown, A.; Castle, K.; Dutcher, D.D. Carbon monoxide concentration in
mainstream E-cigarette emissions measured with diode laser spectroscopy. Tob. Control 2019, 1–4. [CrossRef]
21. El-Hellani, A.; Al-Moussawi, S.; El-Hage, R.; Talih, S.; Salman, R.; Shihadeh, A.; Saliba, N.A. Carbon monoxide
and small hydrocarbon emissions from sub-ohm electronic cigarettes. Chem. Res. Toxicol. 2019, 32, 312–317.
[CrossRef]
22. D’ruiz, C.D.; O’connell, G.; Graff, D.W.; Yan, X.S. Measurement of cardiovascular and pulmonary function
endpoints and other physiological effects following partial or complete substitution of cigarettes with
electronic cigarettes in adult smokers. Regul. Toxicol. Pharmacol. 2017, 87, 36–53. [CrossRef]
23. McRobbie, H.; Phillips, A.; Goniewicz, M.L.; Smith, K.M.; Knight-West, O.; Przulj, D.; Hajek, P. Effects of
switching to electronic cigarettes with and without concurrent smoking on exposure to nicotine, carbon
monoxide, and acrolein. Cancer Prev. Res. 2015, 8, 873–878. [CrossRef]You can also read


