Mineral and Citrate Concentrations in Milk Are Affected by Seasons, Stage of Lactation and Management Practices - MDPI
←
→
Page content transcription
If your browser does not render page correctly, please read the page content below
agriculture
Article
Mineral and Citrate Concentrations in Milk Are
Affected by Seasons, Stage of Lactation and
Management Practices
Frank R. Dunshea 1, * , Glen P. Walker 2,3 , Roderick Williams 4 and Peter T. Doyle 2,5
 1    Faculty of Veterinary and Agricultural Sciences, The University of Melbourne, Parkville, Victoria 3010, Australia
 2    Agriculture Victoria, Department of Economic Development, Jobs, Transport and Resources, Ellinbank 3821,
      Australia; glen.walker@jcu.edu.au (G.P.W.); doyleconsulting@bigpond.com (P.T.D.)
 3    School of Veterinary and Biomedical Sciences, James Cook University, Townsville, Queensland 4811, Australia
 4    CSIRO Animal, Food and Health Sciences, 671 Sneydes Road, Werribee 3030, Australia;
      Roderick.Williams@csiro.au
 5    Red Bean Close, Suffolk Park, New South Wales 2481, Australia
 *    Correspondence: fdunshea@unimelb.edu.au; Tel.: +61-8344-7124

 Received: 27 December 2018; Accepted: 21 January 2019; Published: 29 January 2019

 Abstract: This study was conducted to examine associations between nutrition, time of year and
 season of calving on milk mineral concentrations in 24 pasture-based dairy farms. There was
 substantial variation in the concentrations (mean with range in parentheses) of Ca 1072 (864–1310)
 mg/kg; citrate 1579 (880–2080) mg/kg; P 885 (640–1040) mg/kg; Mg 98 (73–122) mg/kg; Na
 347 (248–554) mg/kg; K 1534 (1250–2010) mg/kg; and S 295 (155–372) mg/kg with most of the
 variation associated with stage of lactation, although the influence of days in milk was different
 for different minerals. Feeding practices were also important in determining the concentrations of
 some components. Milk Ca, citrate, P, and K concentrations were greater (p < 0.05) in cows receiving
 mineral supplements, while Ca, P and Mg were positively correlated (p < 0.05) with the amount
 of concentrates fed. Milk citrate and K concentrations were positively correlated (p < 0.05) with
 herbage allowance. Milk Se (15 (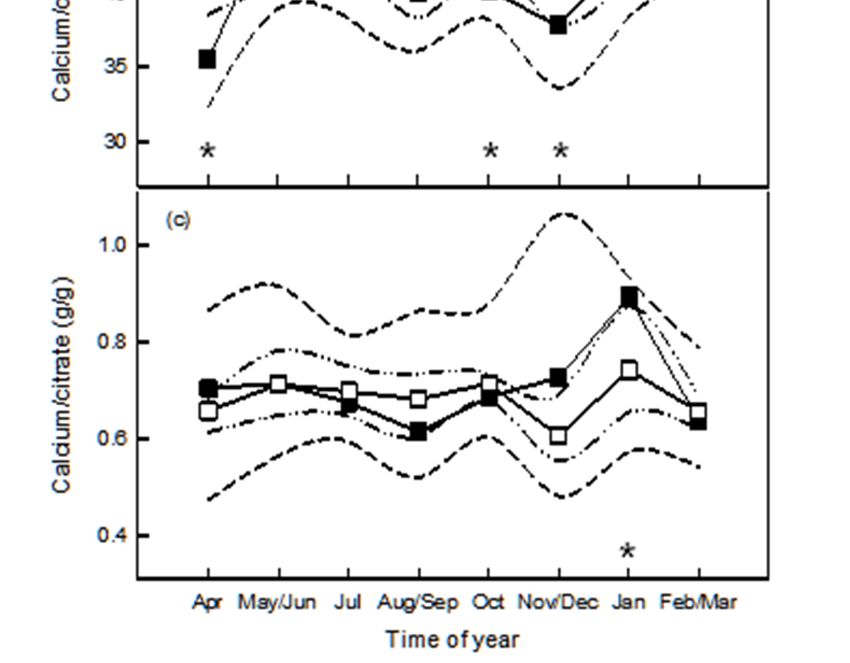
Agriculture 2019, 9, 25                                                                           2 of 17

For example, physical functional properties for manufacturing cheese and yoghurt are affected by the
relative concentrations of Ca, P, Mg, and citrate [12–15], while physiological functional properties for
human health can be influenced by concentrations of Zn and Se-rich proteins [16–19]. Dairy companies
require sufficient knowledge of changes in the composition of milk over time to optimize processing
efficiency and product mix and quality.
      There is little information from any of the Australian dairy regions of Victoria on variations in
the concentrations of minerals and citrate in milk throughout the year. This study was conducted
to examine changes in the mineral concentrations in milk from farms in northern Victoria as
affected by time of year (seasonal variation), season of calving (SOC), stage of lactation (SOL) and
management practices.

2. Materials and Methods

2.1. Experimental Design
     Twenty-four farms that calved in both spring and autumn as well as being representative of dairy
farms in northern Victoria were selected for the study. These farms were also selected because they
covered the range in amounts of grain fed from less than 0.5 to about 2.5 t grain/cow.lactation [3].
     The experimental design allowed the assessment of associations between month, SOC, nutrition
and grazing management on milk yield, and composition under commercial conditions. As it was
logistically possible to only visit and sample 3 farms within any week, the 24 farms were sampled as 2
groups of 12. The farms in the first group were sampled in blocks of 4 weeks during April, July and
October 2001 and January 2002, while those in the second group were sampled in blocks of 4 weeks from
mid-May to mid-June, mid-August to mid-September and mid-November to mid-December in 2001
and mid-February to mid-March in 2002. The full experimental design is described in Reference [3].
     For each farm, 16 Holstein Friesian cows from those that calved from late February to late April
2001 (Autumn calving) and 16 Holstein Friesian cows that calved from mid-August to late September
2000 (Spring calving) to values for the corresponding herd based on the most recently available
herd records. As the sampling period straddled 2 lactations for the herds that calved in spring,
an additional group of 16 cows that calved from mid-August to late September 2001 were selected
so as to be representative of the cows calving in Spring on each farm. Cows were not selected if
they had high somatic cell counts. Using these selection criteria, the association between time of year
and milk mineral concentration could be described at 8 points ~ 6–7 weeks apart over a 12-month
collection period, and the association between SOC and SOL on milk composition could be described
at 7 points ~ 6–7 weeks apart, across a lactation of ~42 weeks. Milk samples were not taken from the
spring-calving herds in the July sampling period and the autumn-calving herds in the February–March
sampling period when cows were dry. Associations between nutrition or grazing management and
milk composition were determined after first accounting for the effects of SOC and SOL.

2.2. Nutrition and Grazing Management
     The area of pasture available to the combined herd within an irrigation bay (small paddock on
irrigated dairy farms that is flood irrigated) for strip grazing prior to and after the evening milking
was measured at each farm visit. This was assumed to be representative of the herbage available after
both the evening and morning milking, and no measurements were made on pasture offered after the
morning milking. A rising plate meter [20] was used to measure the height of pasture (the average
of 100 plate meter readings) that was offered to cows after the evening milking. The average heights
of perennial pastures were converted to pre-grazing pasture mass using the Dietcheck program [21].
Average plate meter heights of annual pastures (subterranean or Persian clovers) were converted to
pre-grazing pasture mass using relationships reported for studies conducted in northern Victoria for
subterranean clover [22] or Persian clover [23] pastures. Unless visual assessment suggested otherwise,
it was assumed that the remaining pasture within a bay (that was not available to the herd) was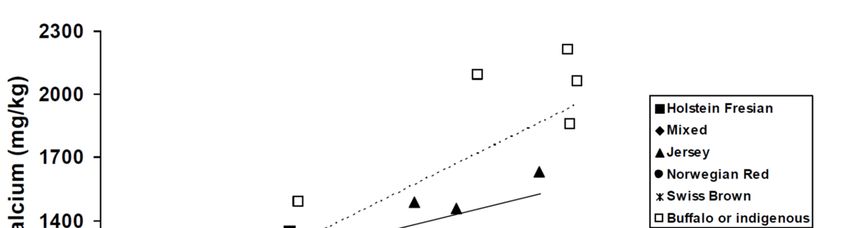
Agriculture 2019, 9, 25                                                                                                     3 of 17

representative of the pre-grazing pasture mass within that bay. Average daily herbage allowance per
cow was calculated from the estimates of pasture mass, the area available for grazing, and the number
of cows in the milking herd (autumn + spring-calved cows). Pasture mass was only estimated when
the pasture was not wet from rain and herbage allowance was estimated only when strip grazing was
being used. Strip grazing was not being used on 6 out of the 24 farm visits made in May-June and July
(late autumn and winter) and so herbage allowance could not be calculated. However, pasture mass
data collected on these visits was included in the statistical analysis.
      The botanical composition of herbage available was estimated by visually determining the
proportions of paspalum, ryegrass, clover, weeds, and dead material within 6 quadrats (0.245 m2 )
within each grazing area and an average obtained. The ME content of herbage consumed from
perennial pastures was estimated using the Dietcheck program [21]. The ME content of herbage
consumed from annual pastures during their growing season was assumed to be the maximum value
recorded for perennial pastures at the same time of year within the Dietcheck program. Concentrate
supplements were generally offered in the bail during the morning and evening milkings except for
6 out of the 96 farm visits, where concentrates were fed in both the bail during milking and as a
component of a mixed ration after milking. Where concentrates were fed as part of a mixed ration,
the farmer specified the composition of the mixed ration. Since concentrates and mixed rations were
measured by volume, known volumes of concentrate and mixed rations were weighed on each farm
visit to determine amount fed. Information was also collected on the composition of concentrate
supplements, the form in which they were fed, and whether they contained mineral supplements
(Table 1). The macro-mineral supplements and complete mineral mixes were all high in Ca. Farmers
provided estimates of the amounts of conserved forages fed, but no measurements were made of the
weights of forage supplements offered or of wastage of those supplements so that statistical analyses
were for amounts of forages offered rather than amounts consumed.

      Table 1. Numbers of farms in four categories for amounts of concentrates fed and within those
      categories for the type of concentrate and whether mineral supplements were used.

               Parameter                                         Concentrates Fed (kg DM/cow.day)
                                                    0–3                  >3–6                  >6–9                   >9
         Number of farms                            7                      7                    8                      2
 Herd size (average for category) 1          100–280 (200)          130–280 (207)        100–1150 (463)         210–210 (210)
        Concentrate Type 2                   2 grain/2 mix          2 grain/5 mix        2 grain/6 mix          0 grain/2 mix
  Macro-mineral supplement fed                 4 no/3 yes             0 no/7 yes           0 no/8 yes             0 no/2 yes
  Trace element supplement fed                 5 no/2 yes             2 no/5 yes           2 no/6 yes             0 no/2 yes
      1 Herd size refers to the maximum number of cows milked daily over the 12 months of sample collection. 2 Grain
      refers to cracked or hammer-milled cereal grains (usually barley, wheat, and/or triticale). Mix refers to a proprietary
      feed mix supplied by a commercial feed company based on cereal grains, protein meals, vegetable oils, and/or
      oil seeds.

2.3. Milk Production and Composition
     A representative sample of milk (22 g sample/kg milk) was obtained at the afternoon and
subsequent morning milking at each farm visit from the 16 focus cows for each calving group before
pooling to obtain a composite sample of milk for analysis for each seasonal calving groups. The pooled
samples were preserved with preservative (ca. 0.045% W/W Bronopol; CAS number: 52-51-7) and
placed in a refrigerator (3–4 ◦ C) before analysis within 7 days.
     The concentration of crude protein was determined using a CombiFoss 5000 (i.e., linked Milkoscan
+ Fossmatic; Foss Electric, Denmark). Triplicate samples were analysed using a Leco FP-2000
combustion nitrogen analyzer (LECO Australia Pty Ltd, Castle Hill, Australia) for total nitrogen,
true protein nitrogen following isolation of the protein by precipitation with 12% trichloroacetic
acid [24], and casein nitrogen following isolation of the protein by precipitation at pH 4.6 according to
the method of Reference [25] with modifications as described by Reference [3].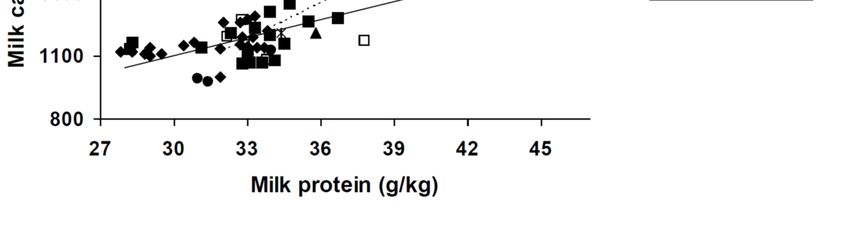
Agriculture 2019, 9, 25                                                                             4 of 17

      Milk samples for determination of concentrations of Ca, Mg, K, Na, P, S, and Zn were homogenized
by vigorous shaking. Three grams of milk were weighed into a digestion vessel, sealed, and digested
in a mixture of nitric acid and hydrogen peroxide using microwave acid digestion to 180 ◦ C for 15 min.
The digestate was diluted to 40 mL prior to analysis using Inductively Coupled Plasma Emission
Spectroscopy (ICP-ES, Spectro-Flame-EOP, Spectro Analytical Instruments GmbH, Kleve, Germany)
for the determination of Ca, Mg, K, Na, P, and S or Atomic Absorption Spectrophotometry (Varian
SpectrAA-300/400, Varian, Mulgrave, Australia) for the determination of Zn. The limits of detection
and resolution were 1 and 3 mg/kg, respectively for Ca, K, and Na; 0.7 and 3 mg/kg for Mg, 4 and
9 mg/kg for P, 7 and 21 mg/kg for S, and 0.5 and 2 mg/kg for Zn.
      Total Se in milk samples was determined after digesting subsamples in a mixture of nitric and
perchloric acids by using test tubes fitted with reflux funnels in an electrically heated digestion block.
In the end stage of the digestion process, hydrochloric acid was added to the tubes to reduce Se (V)
to Se (III), with the final matrix being 30% hydrochloric acid. The digestate was diluted (to 20 mL
final volume) and analysed by Inductively Coupled Plasma Mass Spectrometry/Vapour Generation
(ICP-MS, Ultramass ICP-MS, Varian, Mulgrave, Australia). Duplicate samples were included at 3–4 per
100 samples, and reproducibility was at least 90%. Standard reference material (Institute of Standards
and Technology standard 1549—non-fat milk powder) and laboratory control standards were carried
through all analyses. In each run, two randomly selected samples were spiked, with acceptable
recoveries being between 80 and 120%. The limits of detection and resolution were 1 and 3 µg/kg.
      Citrate/citric acid was determined using a commercial assay kit (Boehringer Mannheim
Citrate/citric acid kit Cat 139076) following deproteinization of the sample with Perchloric acid
(HClO4 ): A test portion (~0.75 mL) was weighed (to 0.0001 g) into a standard mini-centrifuge tube
and ice cold HClO4 solution (1 M 0.75 mL) added. The weight of the total mixture was recorded.
The precipitated protein was pelleted by centrifugation (14,000× g/10 min) and an aliquot of the
supernatant (approximately 0.75 mL weighed accurately), removed and mixed with a solution of
K2 CO3 (0.3 M, 0.75 mL), and incubated at 4 ◦ C for 10 min. The weight of the total mixture was recorded.
The samples were clarified by centrifugation, and duplicate aliquots (0.2 mL each) were removed for
assay according to the manufacturer’s instructions.

2.4. Statistical Analysis
     Statistical analysis for the effects of nutrition and management on milk fat components was by
analysis of variance using Residual Maximum Likelihood (Genstat Version 11, release 11.1.0.1575,
VSN International, Hemel Hemstead, United Kingdom). Definitions of the terms used are provided
in Table 2. All models contained a random effects term to account for the effect of a particular farm
(Farm: 1 to 24) and a visit at a particular time to that farm (Visit: 1 to 4). The effects of SOC at a
particular period of sampling (fixed effect) were tested for main and interactive effects. The effects
of time of calving at a particular SOL (fixed effect) were tested using a model that included the main
and interactive effects of SOC and SOL. The effects of variation in nutritional regimen or grazing
management were tested using a model that included the interactive effects between SOC and SOL and
nutritional regimen or grazing management [3]. The effects of the estimated ME content of herbage
consumed, amount of conserved forage offered, and herbage allowance were tested for each analyte
using simple linear regression, as these factors were seen to co-vary with both time of year and SOL.
Summary statistics to describe the between- farm variation in milk components for both the autumn
and spring calving groups were calculated using the average value for all samples from each calving
group within a farm (Table 3).
Agriculture 2019, 9, 25 5 of 17
Table 2. Descriptors used to define the management structure of dairy farms in the study 1 .
Descriptors Factor/Variate Definition
Structural Components
Farm Factor Farm identifier (1 to 24).
Calving group Factor Calving group: 1 = autumn, 2 = spring.
Average days in milk as a discrete variable calculated for each calving
DIM 2 Variate
group within a farm at a particular visit.
Period (4 weeks duration) in which samples were collected (1 = Apr,
Period Factor 2 = May/Jun, 3 = Jul, 4 = Aug/Sep, 5 = Oct, 6 = Nov/Dec, 7 = Jan,
8 = Feb/Mar).
Stage of lactation as a category calculated as the average days post-partum
for each herd on all farms visited during a sampling period (1 = 24, 2 = 60,
Stage of lactation Factor
3 = 113, 4 = 145, 5 = 199, 6 = 231 and 7 = 288 days
post-partum, respectively).
Visit Factor Visit to a particular farm (1 to 4).
Inputs
Calcium
Factor Was a calcium supplement fed: yes = 1, no = 0
supplement
Concentrate Variate Amount of concentrate (grain or grain mix) fed (kg DM/cow·day)
Conserved forage Variate Amount of silage and/or hay fed (kg DM/cow·day)
Herbage
Variate Herbage allowance (kg DM/cow·day)
allowance
Herbage ME Variate Estimated metabolizable energy in herbage consumed (MJ ME/kg DM)
Size Variate Number of cows milked on the day of sampling
Trace supplement Factor Was a trace mineral supplement fed: yes = 1, no = 0
1 Descriptors are divided into two groups, those aspects of production that are defined by the design of the study
(structural) and those that are inputs to the farm production system (inputs).2 DIM refers to days in milk.
Table 3. Statistics summarizing the effects of autumn or spring calving, when averaged across all farms,
on the yield, concentrations of protein fractions, minerals and citrate in milk 1 .
Title Autumn Spring
Component mean c.v.% min. max. mean c.v.% min. max.
Gross Composition
Milk yield 24.5 15 15.9 29.9 23.6 21 17.7 34.8
Crude protein 33.1 3.3 26.7 37.4 34.1 3.5 30.2 41.3
True protein 30.6 4.6 24.8 36.2 31.5 3.9 27.2 37.7
Casein protein 25.0 4.8 20.2 28.9 25.8 4.0 22.3 31.1
Minerals and Citrate
Ca 1070 8 891 1310 1080 8 864 1290
Mg 98 9 82 122 98 11 73 118
P 891 7 690 1020 879 9 640 1040
S 294 11 155 348 300 10 191 372
Se 11.6 45 3.0 30.3 13.7 51 1.7 37.1
Zn 3.45 16 2.15 4.91 3.48 15 2.52 4.73
Na 346 11 278 461 355 19 248 554
K 1540 9 1300 1870 1520 12 1250 2010
Citrate 1580 15 880 2040 1570 14 960 2080
1Milk yield has units of kg/cow.day, while milk protein concentrations have units of g/kg milk and milk mineral
concentrations have units of mg/kg milk with the exception of Se where units are µg/kg milk.
Data from the present study and a number of published studies where both milk Ca and protein
were reported were subjected to regression analyses to determine the relationship between the two
milk constituents using the Generalized Linear Model Procedure in Genstat. Published studies were
identified using PubMed and Web of Science databases using the key words calcium, protein, andAgriculture 2019, 9, 25 6 of 17
cow (or cattle). Only papers that reported milk protein and milk calcium content were included in the
analyses, and there was no minimum number of observations required for inclusion. The initial model
included breed, but when there were no effects of breed, the pooled response is presented.
3. Results
Summary statistics describing the concentrations of minerals and citrate in milk from herds
that calved in autumn and spring are presented in Table 3. Relationships between milk production
and gross composition and season, SOL or herd management have been reported by Reference [3].
However, the concentrations of crude protein and casein are reproduced in Table 3, as relationships
between these fractions and concentrations of some minerals are examined below.
3.1. Calcium and Magnesium
The average concentrations of Ca or Mg in milk did not differ significantly between SOC groups
when averaged for SOL and the coefficients of variation, minimum, and maximum values for Ca or Mg
in milk were similar for both SOC groups (Table 3). The concentration of Ca in milk varied little from
25 to 150 days postpartum, but increased (p < 0.05) across the remainder of lactation with the highest
concentration observed around 300 days postpartum (Table 4). There was an interaction (p < 0.05)
between SOC group and time of year, where herds that calved in spring produced milk with a higher
concentration of Ca in May-June and a lower concentration in October and January (Table 4).
The concentration of Mg in milk increased at a similar rate from 25 to 300 days post-partum for
both SOC groups, with the exception that herds that calved in spring produced milk with a higher
(p < 0.05) concentration of Mg around 150 days post-partum when compared with those that calved
in autumn (Table 4). There was an interaction (p < 0.05) between SOC group and time of year where
herds that calved in spring produced milk with a higher concentration of Mg in April and May–June
and a lower concentration in October, November–December, and January when compared with herds
that calved in autumn (Table 4).
On average, the concentrations of Ca and Mg in milk increased (p < 0.05) by 7 ± 2.5 mg/kg and
0.8 ± 0.23 mg/kg, respectively, for every extra kg DM of concentrates fed (Table 5) and that of Mg
increased (p < 0.05) by 0.1 ± 0.05 mg/kg for every extra kg DM pasture offered. The concentration of Ca
in milk did not vary with herbage allowance. The concentrations of Ca and Mg were higher (p < 0.05;
46 ± 17.3 and 4 ± 1.8 mg/kg, respectively) in milk from herds receiving macro-mineral supplements
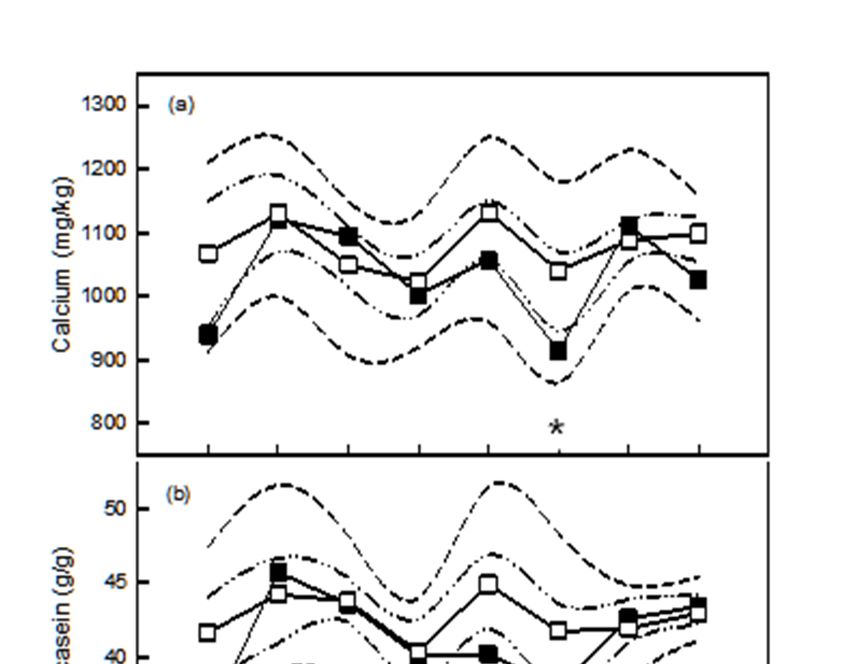
(Table 6). The effect of feeding these minerals supplements on Ca concentration was apparent in the
May–June and November–December sampling periods only (Figure 1a). Concentrations of Ca and Mg
in milk did not vary significantly with estimated ME content of pasture or the amounts of conserved
forages fed.
The ratio of Ca relative to casein varied by time of year for herds that were not fed high-Ca
mineral supplements, with the ratio being lower (p < 0.05) in April and November–December when
compared with May-June, July, January and February-March. There was no significant variation in
the ratio of Ca relative to casein by time of year for herds fed macro-mineral supplements. Herds fed
macro-mineral supplements had higher Ca to casein than those which were not in April, October, and
November–December (Figure 1b).
The ratio of Ca relative to citrate in milk varied by time of year for herds that were not fed high-Ca
supplements, being higher in January when compared with all other sampling periods. There was no
variation in the ratio of Ca relative to citrate by time of year for herds fed macro-mineral supplements
and the supplemented herds produced milk with a lower (p < 0.05) ratio of Ca to citrate in January
(Figure 1c).Agriculture 2019, 9, 25 7 of 17
Table 4. The average concentrations of minerals and citrate in milk for herds that calved in autumn or
spring by the time of year that samples were collected.
Time of Year
Calving April May/Jun July Aug/Sep Oct Nov/Dec Jan Feb/Mar s.e.d
Stage of lactation (days)
Autumn 24 60 113 145 199 231 288 dry -
Spring 231 288 dry 24 60 113 145 199
Ca (mg/kg)
Autumn 1086 def 1021 bcd 1044 cde 1010 bc 1218 h 971 ab 1145 fg dry 35.3
Spring 1114 efg 1137 fg dry 1057 cde 1158 gh 937 a 1101 efg 1057 cde
Mg (mg/kg)
Autumn 97 cde 91 abc 97 cde 91 abc 106 fgh 94 bcd 114 h dry 3.8
Spring 107 gh 104 efg dry 87 ab 98 cde 84 a 106 fgh 99 def
P (mg/kg)
Autumn 897 bcde 837 ab 919 def 889 bcd 976 f 818 a 906 cde dry 29.7
Spring 838 ab 840 ab dry 952 ef 975 f 804 a 894 bcde 851 abc
S (mg/kg)
Autumn 277 bc 246 a 292 bcd 296 cd 326 e 288 bcd 331 e dry 12.2
Spring 315 de 313 de dry 308 de 297 cd 267 ab 311 de 291 bcd
Se (µg/kg)
Autumn 14.5 bcd 13.2 abc 9.8 a 12.0 ab 9.9 a 9.8 a 12.2 ab dry 2.21
14.0
Spring 16.9 cd 18.3 d dry abcd 10.1 ab 9.7 a 10.3 ab 16.9 cd
Zn (mg/kg)
Autumn 4.12 e 2.93 ab 2.73 a 3.64 cd 3.60 cd 3.70 cde 3.65 cd dry 0.23
Spring 4.05 de 3.34 bc dry 4.01 de 3.31 bc 3.46 c 3.33 bc 2.94 ab
K (mg/kg)
Autumn 1437 bc 1613 ef 1664 fg 1537 de 1612 ef 1503 cd 1425 abc dry 49.0
Spring 1328 a 1373 ab dry 1511 cd 1727 g 1566 de 1613 def 1557 de
Na (mg/kg)
Autumn 350 cd 334 bc 325 bc 326 bc 378 de 336 bc 379 de dry 15.9
Spring 401 e 462 f dry 317 b 328 bc 285 a 339 bc 353 cd
Citrate (mg/kg)
Autumn 1648 ab 1635 ab 1532 ab 1574 ab 1613 ab 1694 ab 1402 a dry 121.7
Spring 1597 ab 1581 ab dry 1516 ab 1555 ab 1661 ab 1420 a 1722 b
Within mineral contents, means followed by different superscripts are significantly different at p = 0.05.
Table 5. Effect of dietary concentrate supplementation on milk mineral and citrate concentrations.
Mineral Effect per kg Concentrates 1 s.e.d. p-Value
Ca (mg/kg) 7 2.5Agriculture 2019, 9, x FOR PEER REVIEW 7 of 17
For2019,
Agriculture citrate,
9, 25 there
was an interaction between SOC and SOL where the concentration was higher 8 of 17
(p < 0.05) in milk from herds that calved in spring around 100 and 300 days post-partum, and lower
around 150 days post-partum, compared with herds that calved in autumn (Table 4). The
Table 6. Effect of dietary mineral supplementation on milk mineral and citrate concentrations.
concentration of citrate in milk did not vary much with time of year, averaged for SOC, except that
milk citrate was lower in January than
Mineral in with
Effect Supplement 1
November–December and February–April
s.e.d. p-Value (Table 4).
For P, there was an interaction
Ca (mg/kg) between SOL
46 and SOC with the
17.3 concentrationAgriculture 2019, 9, 25 9 of 17
3.2. Citrate, Phosphorus and Sulphur
The average concentrations of citrate or P in milk did not differ between SOC groups when
averaged for SOL and the coefficients of variation, minimum, and maximum values for citrate or P in
milk were similar for both calving groups (Table 3). The concentration of S in milk was higher (p < 0.05)
for herds that calved in spring compared with herds that calved in autumn, although the difference
was biologically small, while the coefficients of variation, minimum, and maximum values for S in
milk were similar for both SOC groups.
For citrate, there was an interaction between SOC and SOL where the concentration was higher
(p < 0.05) in milk from herds that calved in spring around 100 and 300 days post-partum, and lower
around 150 days post-partum, compared with herds that calved in autumn (Table 4). The concentration
of citrate in milk did not vary much with time of year, averaged for SOC, except that milk citrate was
lower in January than in November–December and February–April (Table 4).
For P, there was an interaction between SOL and SOC with the concentration declining in milk
of herds that calved in spring across early- and mid-lactation and increasing across the same period
for herds that calved in autumn (Table 4). The concentration of P in milk varied with time of year,
being higher (p < 0.05) for both calving groups in July, August–September and October compared with
February–March and April (Table 4). There was an interaction between SOC group and time of year
such that herds that calved in spring produced milk with a lower (p < 0.05) concentration of P in April
and higher (p < 0.05) concentration of P in August–September, when compared with herds that calved
in autumn.
The concentration of S in milk varied with SOL, declining from 25 to 50 days in milk and then
increasing across the remainder of the lactation (Table 4). There was an interaction (p < 0.05) between
SOC group and SOL with herds that calved in spring producing milk with a higher concentration of S
around 25 and 50 days post-partum. There was an interaction (p < 0.05) between calving group and
time of year, where herds that calved in spring produced milk with higher (p < 0.05) concentrations of
S in April and May/June when compared with herds that calved in autumn (Table 4).
The concentration of citrate was higher (p < 0.05) in milk from herds receiving macro-mineral
supplements (114 ± 53.8 mg/kg) (Table 6), but was not significantly affected by the estimated ME
content of pasture or the amounts of concentrates fed. On average, the concentration of P in milk
increased (p < 0.05) by 7 ± 2.0 mg/kg for every extra kg DM concentrates fed (Table 5), and was
higher in milk from herds receiving macro-mineral supplements (46 ± 14.5; p < 0.05) (Table 6).
The concentration of S in milk increased (p < 0.05) by 9 ± 3.2 mg/kg for every extra MJ ME in pasture
consumed, but was not affected by the amount of concentrates fed or mineral supplementation Tables 5
and 6). The concentrations of citrate, P or S in milk were not affected by herbage allowance or the
amounts of conserved forages fed.
3.3. Selenium and Zinc
The concentration of Se in milk was higher (p < 0.05) for herds that calved in spring compared
with herds that calved in autumn, and the coefficient of variation was larger, minimum value smaller,
and maximum value larger for Se in milk from spring calving compared with autumn calving herds
(Table 3). There was an interaction (p < 0.05) between calving group and SOL with herds that calved in
spring, producing milk with a higher concentration of Se around 200, 225, and 300 days post-partum
(Table 4). When averaged for the effect of SOC group, the concentration of Se in milk varied with time of
year, being higher (p < 0.05) in April and May–June compared with October and November/December.
There was an interaction (p < 0.05) between SOC group and time of year such that herds that calved in
spring produced milk with higher (p < 0.05) concentrations of Se in May-June when compared with
herds that calved in autumn (Table 4).
The concentration of Zn in milk, averaged for SOL, did not differ significantly between calving
groups and the coefficients of variation, minimum, and maximum values for Zn in milk were similar
for both SOC groups (Table 3). There was an interaction (p < 0.05) between SOC group and SOLAgriculture 2019, 9, 25 10 of 17
with herds that calved in spring, producing milk with a higher concentration of Zn around 100 days
post-partum and a lower concentration around 150 days post-partum when compared to herds that
calved in autumn (Table 4). When averaged for the effect of SOC group, the concentration of Zn in
milk varied with time of year, being higher (p < 0.05) in April and August–September when compared
with July and February/March (Table 4). There was an interaction (p < 0.05) between SOC group and
time of year, so that herds that calved in spring produced milk with higher concentrations of Zn in
May–June and August–September and lower concentrations in October, November–December, and
January when compared with herds that calved in autumn.
On average, the concentration of Se in milk increased (p < 0.05) by 0.8 ± 0.18 µg/kg for every extra
kg DM concentrates fed (Table 5), and was higher (p < 0.05) for herds fed macro-mineral (7 ± 1.3 µg/kg)
(Table 6) and/or trace element (7 ± 1.2 µg/kg) supplements (data not shown). The concentration of
Zn in milk did not vary significantly with these factors, and the concentrations of Se and Zn were
not affected by herbage allowance, estimated ME content of herbage consumed, or the amounts of
conserved forages fed.
3.4. Sodium and Potassium
The concentrations of Na or K in milk, averaged for SOL, did not differ significantly between
SOC groups (Table 3). However, the coefficient of variation was larger, minimum value smaller,
and maximum values larger for Na and K in milk for spring, compared with autumn calving herds
(Table 3). The average concentration of Na in milk varied (p < 0.05), with SOL tending to decline for
both calving groups from 25 to around 100 days postpartum and then increase for the remainder of
the lactation (Table 4). There was an interaction (p < 0.05) between SOC and SOL, so that herds that
calved in spring produced milk with a lower concentration of Na around 25 and 100 days postpartum
and a higher concentration around 250 and 300 days postpartum. There was an interaction (p < 0.05)
between calving group and time of year, where herds that calved in spring produced milk with higher
concentrations of Na in April and May/June and lower concentration in October, November–December
and January (Table 4).
The average concentration of K in milk varied with SOL, increasing for both SOC groups from
25 to 50 days post-partum and then declining across the remainder of lactation (Table 4). There was
an interaction (p < 0.05) between SOC and SOL where herds that calved in spring produced milk
with a higher concentration of K around 50 days post-partum and lower concentration about 250
days post-partum, when compared with cows that calved in autumn. There was an interaction
(p < 0.05) between SOC and time of year, where herds that calved in spring produced milk with
higher concentrations of K in October and January and lower concentrations in April and May-June
(Table 4).
The concentrations of Na and K in milk did not vary with the estimated ME content of pasture
consumed, the feeding of macro-mineral supplements, or with the amounts of concentrates or
conserved forages fed. While the concentration of K in milk increased (p < 0.05) by 2 ± 0.8 mg/kg for
every extra kg DM pasture offered, that of Na was not affected.
The ratio of Na to K varied with time of year declining from 25 to 50 days post-partum and
increasing from around 150 to 300 days post-partum for both calving groups (Table 4). There was an
interaction (p < 0.05) between SOC group and SOL where the ratio of Na to K was higher around
225 and 300 days post-partum for herds that calved in spring (Table 4). There was an interaction
(p < 0.05) between SOC group and time of year, where herds that calved in spring produced milk with
a higher ratio of Na to K in April and May–June and lower ratios in October, November–December
and January when compared to herds that calved in autumn (Table 4). The ratio of Na to K declined by
−0.0004 ± 0.00019 g/g for every extra kg DM pasture offered (p < 0.05) and did not vary significantly
with the estimated ME content of pasture, the feeding of macro-mineral supplements, or with the
amounts of concentrates or conserved forages fed.Agriculture 2019, 9, 25 11 of 17
3.5. Associations between Milk Components
Every extra g/kg of crude protein in milk was associated with increases (p < 0.001) in the
concentrations of Ca (20 ± 3.0 mg/kg), Mg (2 ± 0.3 mg/kg), P (17 ± 2.3 mg/kg), S (8 ± 1.0 mg/kg), Se
(0.7 ± 0.16 µg/kg), and Zn (0.1 ± 0.02 mg/kg), while the concentration of K decreased (p < 0.001) by
22 ± 5.9 mg/kg.
The significance of correlations between milk concentrations of various minerals is summarized in
Table 7. On average, the ratio of Ca relative to P varied by time of year being higher (p < 0.05) in April,
May–June, January and February–March when compared with July and August–September. There was
no effect of feeding macro-mineral supplements (data not shown) on this ratio. The concentration
of citrate in milk was positively correlated (p < 0.05) with that of Ca, while there were no significant
correlations with the concentrations of other minerals. The concentration of Na in milk was negatively
correlated (p < 0.05) with that of K.
Table 7. Correlations between milk mineral concentrations. Correlations ≤−0.40 and ≥0.40 are
significant (p < 0.05) and are in bold.
Ca Citrate K Mg Na P S Se
Ca
Citrate 0.48
K NS NS
Mg 0.62 NS NS
Na 0.51 NS −0.53 0.52
P 0.48 NS NS NS NS
S 0.61 NS NS 0.58 0.40 0.62
Se NS NS NS NS NS NS NS
Zn NS NS −0.41 NS NS NS NS NS
An analysis of the relationship between milk Ca and protein from 22 studies conducted around
the world and published since 1978 in dairy cattle, indigenous cattle, and buffalo reveals a strong
relationship, given the number of possible confounding factors (Figure 2). Milk Ca increased with
increasing milk protein content with the response being similar for all dairy breeds, but with a higher
slope for the buffalo and indigenous cattle breeds. Within the dairy breeds, both milk Ca and milk
protein were higher in Jerseys than in the other breeds, while buffalo had similar milk protein but
higher milk Ca than Jerseys.
4. Discussion
Milk and dairy products are an important source of Ca and P and a significant source of Mg in the
Australian diet [26,27], and the concentrations of these elements has implications in processing [28,29].
The average concentrations of Ca, P, and Mg from these northern Victorian farms was similar to values
reported in Reference [30], who reported mean values for Ca 1% higher, P 3% lower, and Mg 9% higher
in milk from herds in New York. In milks sourced from 8 milk outlets, [31] reported Ca concentrations
between 1073 and 1372 mg/L and Mg concentrations between 95 and 120 mg/L, the range in Ca
concentration being less than in this study. Importantly, all cows sampled in the current study were
Holstein Friesian, which is now the predominant breed in Australia, having increased from 38% of the
national herd in 1978 to 83% in 2000 [32] and 78% in 2010 [33]. As ~70% of the Ca in milk is bound to
protein [34], the low proportion of Jersey, red breeds, and crossbred cows in the national herd likely has
an impact on the protein concentrations in milk, as well as the concentrations of minerals, such as Ca,
associated with protein. In this context, Reference [35] found that Ca, Mg, and protein concentrations
were lower in milk from Holstein Friesians than from Jerseys that were grazed in a single herd.
In the present study, there was an increase in milk Ca with increasing milk protein. Similarly,
others have also reported correlations between milk Ca and protein contents [29,36] with similar slopes
(~25 mg/kg) to those observed in the present study (20 mg/kg) and generated from the analysesAgriculture 2019, 9, 25 12 of 17
of published data (28 mg/kg). The mean Ca concentrations in milk from dairy cows reported in
a number of studies spanning the period 1978 to 2017 ranged from 975 to 1630 mg/kg (Figure 2),
so that the average value observed in this study (1072 mg Ca/kg milk) was at the lower end of
this range. Within the dairy breeds, Jersey cows had higher milk Ca concentrations. Excluding
these values as being unrepresentative of the predominantly Holstein/Friesian Australian herd, the
concentration of Ca in milks from the current study fits approximately midway between values
reported from studies largely conducted over the previous 2 decades. The low mean Ca concentrations
in the Holstein/Friesian and mixed breed cows (Figure 2) are likely indicative of the emphasis on
selection for milk volume in these breeds. However, it is the range in Ca (and other macro element)
concentrations in milk, from across these 24 farms in the present study, which were at times quite
low, that is of interest to us. Interestingly, very recently, some extremely low levels Ca (ca. 750 mg
Ca/kg milk) have been reported in high yielding Polish Holstein-Friesians [37]. Given the increased
focus on dairy consumption and effects on Ca status and human health [38,39], it is important that
Agriculture 2019, 9, x FOR PEER REVIEW
we
12 of 17
understand the sources of variation in milk Ca.
Figure 2. Relationship between milk calcium and protein contents in cows of various breeds and
Figurepotential.
milking 2. Relationship between
Regression equationmilk is:calcium
(Milk calcium) = 249 ±
and protein contents
163.0 + in ± 4.93
28.4cows of *various breedsfor
(Milk protein) and
themilking
pooled potential.
dairy breedRegression − 1256 ±
(solid line)equation is:272.03 38.0 ± 7.36
(Milk +calcium) = 249 163.0
* (Milk + 28.4for
protein) 4.93 * (Milkbuffalo
the pooled protein)
andforindigenous
the pooled breeds
dairy breed
(dotted(solid
line).line) 2 = 0.847
The− R1256 272.03
and+SE38.0
was 7.36
108.0* mg/kg
(Milk protein)
for this for the pooled
relationship
(p buffalo
< 0.001).and
There was no effect
indigenous of breed
breeds within
(dotted the The
line). dairyRbreeds but and
2 = 0.847 the intercept
SE was was 108.0lower
mg/kg(pAgriculture 2019, 9, 25 13 of 17
concentrates fed increased, and there were positive associations between crude protein concentration in
milk and the concentrations of Ca, Mg, P, and S. For example, 70% of Ca, 50% of inorganic phosphate,
and 30% of Mg are located in the casein micelle [34]. This indicates that nutrition strategies that
increase milk casein and protein concentration can also be used to enhance concentrations of key
macro-elements in milk. Western diets are often deficient in Mg, and milk and dairy foods offer a
means of increasing Mg intake [62], especially given that milk Mg is responsive to supplementation.
The short-term seasonal variations in the relative amounts and forms of Ca, Mg, citrate, and
phosphate in milk noted in this study may influence the manufacture of powders and milk concentrates
by changing heat stability of milk, cheese manufacture by altering curd firmness, and syneresis capacity
of milk (see reviews by [9,11]). In particular, changes in the concentration of citrate in milk affect
milk-processing characteristics through its effects on buffering against changes in pH, its role in
stabilizing milk against flocculation during heating and freezing by forming complexes with Ca and
Mg ions [63,64] and its fermentation products yield distinct aromatic flavor characteristics of fermented
milk products [65]. Garnsworthy et al. [66] found that milk citrate was lower mid-lactation than in
early-lactation, with late-lactation being intermediate. These authors argued that variation in milk
citrate with stage of lactation was related to de novo synthesis of fatty acids (as indicated by a negative
correlation between citrate and milk short and medium chain fatty acids (SMCFA)) and that the
relationship is independent of diet and milk yield. In the present study there was a weak (p < 0.10)
negative correlation between average milk citrate and SMCFA concentrations reported in [2].
Milk and dairy products can be a significant source of Se and Zn in the Australian diet.
For example, based on this study, milk from northern Victoria would provide women between 19 and
50 years of age consuming about 930 g/day or about 900 mL/day about 19% of the recommended
dietary intake for Se and 40% of the recommended dietary intake for Zn. Importantly, the variation in
the concentration of Se in milk was much greater than that for Zn.
With Se, it was apparent that management strategies on farms, such as time of calving and
feeding concentrate and mineral supplements, can be used to manipulate concentrations in milk.
There were large variations in the concentrations of Se in milk between collection periods, that
were not fully explained by the effects of SOL. It is likely that the trace elements in mineral
supplements included inorganic and/or organic forms of Se and that the concentrates fed varied
in Se concentrations. Milk concentrations of this element are increased more by organic than
inorganic Se supplements [67] due to greater bioavailability of the former. Concentrations in milk
peak quite quickly, within 1 week, of introducing organic Se supplements into the diet [68–70] and
increase in a dose-dependent manner [69,71,72]. In addition to responses in milk concentrations
from supplementation with selenized yeast, [69] have shown Se concentration in milk of grazing
cows is affected by its concentrations in grain supplements. Understanding the causes of variation
in milk Se concentration is particularly important to companies producing infant formulae, where
the specifications in relation to trace element concentrations are stringent. It is also important to
understand the manner in which milk Se responds to dietary Se on farm for the production of dairy
products that exhibit physiological functional properties for human health [70]. In this context, dairy
protein bound Se is more bioavailable and efficacious than inorganic or yeast protein Se [73].
The management practices across these farms had no significant effect on the concentration
of Zn in milk, despite the near 2-fold range between minimum and maximum values observed.
In milk collected from 3 manufacturing and 5 retail outlets at 3-week intervals in Ireland, there
was little variation in Zn concentration with minimum concentrations of 3.52 mg/L and maximum
concentrations of 4.54 mg/L [31]. The average concentrations across all samples were about 10%
lower than those reported by Reference [31]. Other work also suggests that the concentration
of Zn in milk does not vary significantly with season and is only marginally affected by the
concentration of Zn in diet [74]. However, others have found that milk Zn is responsive to dietary
Zn sulphate or methionine [75]. Importantly, we found a positive association between milk protein
and Zn concentrations, indicating that strategies that increase protein in milk may also increase ZnAgriculture 2019, 9, 25 14 of 17
concentration. It is perhaps not surprising, then, that dairy supplementation can increase Zn status and
protein intake in elderly patients [76] and dietary strategies to increase milk Zn may benefit community
health status and immune function.
5. Conclusions
Our study indicated that dairy farmers can influence the concentrations of the macro-minerals
and citrate as well as Se and Zn concentrations in milk through the calving system they employ.
For example, milk produced by herds that calved in autumn had different concentrations of minerals
to that from herds that calved in spring, with these differences most apparent in early and late lactation.
The concentrations of minerals and citrate in bulk milk leaving these 24 farms were described by the
weighted average of milk from the spring- and autumn-calving herds and indicate that split calving
reduces seasonal variation in the concentrations of minerals and citrate in milk. Milk Ca concentration
was low possibly because of its strong association with milk protein and the low protein content of milk
from predominantly Holstein cattle. There is also potential to reduce short term seasonal variation in
the concentrations of milk minerals by changing calving patterns and nutritional management on farms.
Since the study, there have been large changes to the milk production systems on farms in the region,
and it is likely that calving and/or feeding practices have changed. This illustrates the importance of
milk processors to understand the production systems (including changes) of their suppliers.
Author Contributions: F.R.D., G.P.W. and P.T.D. conceived and designed the study; G.P.W. performed the
experiments; F.R.D. and G.P.W. analyzed the data; R.W. conducted protein and mineral analysis; F.R.D., G.P.W.
and P.T.D. wrote the paper.
Funding: The Department of Economic Development, Jobs, Transport and Resources and Dairy Australia funded
this work.
Acknowledgments: We acknowledge the capable technical support provided by Daryl Wilson, Pam Guerra
(Agriculture Victoria, Department of Economic Development, Jobs, Transport and Resources), Maike van der
Maat and Irene Van Dorp (Wageningen University, The Netherlands). We are also grateful to Robin Green for
statistical advice.
Conflicts of Interest: The authors declare no conflict of interest. The funding sponsors had no role in the design
of the study; in the collection, analyses, or interpretation of data; in the writing of the manuscript, and in the
decision to publish the results.
References
1. Walker, G.P.; Dunshea, F.R.; Doyle, P.T. Effects of nutrition and management on the production and
composition of milk fat and protein: A review. Aust. J. Agric. Res. 2004, 55, 1009–1028. [CrossRef]
2. Walker, G.P.; Wijesundera, C.; Dunshea, F.R.; Doyle, P.T. Seasonal and stage of lactation effects on milk fat
composition in northern Victoria. Anim. Prod. Sci. 2013, 53, 560–572. [CrossRef]
3. Walker, G.P.; Williams, R.; Doyle, P.T.; Dunshea, F.R. Seasonal variation in milk production and cheese
yield from commercial dairy farms located in northern Victoria is associated with pasture and grazing
management and supplementary feeding practices. Aust. J. Exp. Agric. 2007, 47, 509–524. [CrossRef]
4. Dunshea, F.R.; Walker, G.P.; Ostrowska, E.; Doyle, P.T. Seasonal variation in the concentrations of conjugated
linoleic and trans fatty acids in milk fat from commercial dairy farms is associated with pasture and grazing
management and supplementary feeding practices. Aust. J. Exp. Agric. 2008, 48, 1062–1075. [CrossRef]
5. Anonymous. Australian Dairy Industry in Focus 2016; Dairy Australia: Victoria, Australia, 2016.
6. Downey, L.; Doyle, P.T. Cow nutrition and dairy product manufacture—Implications of seasonal
pasture-based milk production systems. Aust. J. Dairy Tech. 2007, 62, 3–11.
7. Crosse, S.; O‘Brien, B.; Ryan, G. Production of quality milk for processing. Int. J. Dairy Tech. 2000, 53, 135–141.
[CrossRef]
8. Cheng, L.J.; Clarke, P.T.; Augustin, M.A. Seasonal variation in yogurt properties. Aust. J. Dairy Tech. 2002, 57,
187–191.
9. Roupas, P. On farm practices and post farm gate processing parameters affecting composition of milk for
cheesemaking. Aust. J. Dairy Tech. 2001, 56, 219–232.Agriculture 2019, 9, 25 15 of 17
10. Hillbrick, G.; Augustin, M.A. Milkfat characteristics and functionality: Opportunities for improvement.
Aust. J. Dairy Tech. 2002, 57, 45–51.
11. Williams, R.P.W. The relationship between the composition of milk and the properties of bulk milk products.
Aust. J. Dairy Tech. 2002, 57, 30–44.
12. Augustin, M.A.; Clarke, P.T. Effects of added salts on the heat stability of recombined concentrated milk.
J. Dairy Res. 1990, 57, 213–226. [CrossRef]
13. Anema, S.G.; Harjinder, S.; Creamer, L.K. The relative importance of protein and mineral concentrations on
the dissociation of kappa -casein from the micelles in heated reconstituted skim milk. Int. Dairy Fed. Spec. Iss.
1993, 9303, 227–235.
14. Solorza, F.J.; Bell, A.E. Effect of calcium on the minerals retention and cheesemaking parameters of milk.
Int. J. Dairy Tech. 1998, 51, 37–43. [CrossRef]
15. Udabage, P.; McKinnon, I.R.; Augustin, M.A. Mineral and casein equilibria in milk: Effects of added salts
and calcium-chelating agents. J. Dairy Res. 2000, 67, 361–370. [CrossRef] [PubMed]
16. Boland, M.; MacGibbon, A.; Hill, J. Designer milks for the new millennium. Livestock Prod. Sci. 2001, 72,
99–109. [CrossRef]
17. Hu, Y.; McIntosh, G.H.; Le Leu, R.K.; Woodman, R.; Young, G.P. Suppression of colorectal oncogenesis by
selenium-enriched milk proteins: Apoptosis and k-ras mutations. Cancer Res. 2008, 68, 4936–4944. [CrossRef]
18. Hu, Y.; McIntosh, G.H.; Le Leu, R.K.; Upton, J.M.; Woodman, R.J.; Young, G.P. The influence of
selenium-enriched milk proteins and selenium yeast on plasma selenium levels and rectal selenoprotein
gene expression in human subjects. Br. J. Nutr. 2011, 106, 572–582. [CrossRef]
19. Hu, Y.; McIntosh, G.H.; Young, G.P. Selenium-rich foods: A promising approach to colorectal cancer
prevention. Curr. Pharm. Biotechnol. 2012, 13, 165–172. [CrossRef] [PubMed]
20. Earle, D.F.; McGowan, A.A. Evaluation and calibration of a rising plate meter for estimating pasture dry
matter yield. Aust. J. Exp. Agric. Anim. Husbandry 1979, 19, 337–343. [CrossRef]
21. Heard, J.W.; Cohen, D.C.; Doyle, P.T.; Wales, W.J.; Stockdale, C.R. Diet check: A tactical decision support tool
for feeding decisions with grazing dairy cows. Anim. Feed Sci. Tech. 2004, 112, 177–194. [CrossRef]
22. Stockdale, C.R. The productivity of dairy cows fed irrigated subterranean clover herbage. Aust. J. Agric. Res.
1992, 43, 1281–1295. [CrossRef]
23. Stockdale, C.R. Persian clover and maize silage. I. Silage as a supplement for lactating dairy cows offered
herbage of different quality. Aust. J. Agric. Res. 1994, 45, 1751–1765. [CrossRef]
24. Barbano, D.M.; Lynch, J.M.; Fleming, J.R. Direct and indirect determination of true protein content of milk
by Kjeldahl analysis: Collaborative study. J. Assoc. Off. Anal. Chem. 1991, 73, 281–288.
25. Lynch, J.M.; Barbano, D.M.; Fleming, J.R. Indirect and direct determination of the casein content of milk by
Kjeldahl nitrogen analysis: Collaborative study. J. Assoc. Off. Anal. Chem. 1998, 81, 763–774.
26. Baird, D.L.; Syrette, J.; Hendrie, G.A.; Riley, M.D.; Bowen, J.; Noakes, M. Dairy food intake of Australian
children and adolescents 2–16 years of age: 2007 Australian national children’s nutrition and physical activity
survey. Pub. Health Nutr. 2012, 15, 2060–2073. [CrossRef] [PubMed]
27. Riley, M.D.; Baird, D.L.; Hendrie, G.A. Dairy food at the first occasion of eating is important for total dairy
food intake for Australian children. Nutrients 2014, 6, 3878–3894. [CrossRef]
28. Holt, C. The milk salts. In Developments in Dairy Chemistry; Fox, P.F., Ed.; Elsevier Applied Science Publishers:
New York, NY, USA, 1985; Volume 3, pp. 143–181.
29. Bijl, E.; van Valenberg, H.J.F.; Huppertz, T.; van Hooijdonk, A.C.M. Protein, casein, and micellar salts in milk:
Current content and historical perspectives. J. Dairy Sci. 2013, 96, 5455–5464. [CrossRef]
30. Holland, R.F. Milk composition and its effect on nutritional labeling. Am. Dairy Rev. 1974, 36, 37–39.
31. O’Brien, B.; Mehra, R.; Connolly, J.F.; Harrington, D. Seasonal variation in the compositionn of Irish
manufacturing and retail milks 4. Minerals and trace elements. Irish J. Agric. Food Res. 1999, 38, 87–99.
32. Fulkerson, B.; Doyle, P. The Australian Dairy Industry; Department of Natural Resources and Environment:
Victoria, Australia, 2001; p. 56.
33. ADHIS. Australian Dairy Herd Improvement Report 2010; Australian Dairy Herd Improvement Scheme:
Victoria, Australia, 2010.
34. Holt, C. An equilibrium thermodynamic model of the sequestration of calcium phosphate by casein micelles
and its application to the calculation of the partition of salts in milk. Europ. Biophys. J. 2004, 33, 421–434.
[CrossRef]Agriculture 2019, 9, 25 16 of 17
35. Auldist, M.J.; Johnston, K.A.; White, N.J.; Fitzsimons, W.P.; Boland, M.J. A comparison of the composition,
coagulation characteristics and cheesemaking capacity of milk from Friesian and Jersey dairy cows.
J. Dairy Res. 2004, 71, 51–57. [CrossRef] [PubMed]
36. Davis, S.R.; Farr, V.C.; Knowles, S.O.; Lee, J.; Kolver, E.; Auldist, M.J. Sources of variation in milk calcium
content. Aust. J. Dairy Tech. 2001, 56, 156.
37. Nogalska, A.; Momot, M.; Sobczuk-Szu, L.M.; Pogorzelska-Przybyłek, P.; Nogalski, Z. Calcium and
magnesium contents in the milk of high-yielding cows. J. Element. 2017, 22, 809–815. [CrossRef]
38. Caroli, A.; Poli, A.; Ricotta, D.; Banfi, G.; Cocchi, D. Invited review: Dairy intake and bone health:
A viewpoint from the state of the art. J. Dairy Sci. 2011, 94, 5249–5262. [CrossRef] [PubMed]
39. Bonjour, J.P.; Kraenzlin, M.; Levasseur, R.; Warren, M.; Whiting, S. Dairy in adulthood: From foods to nutrient
interactions on bone and skeletal muscle health. J. Am. Coll. Nutr. 2013, 32, 251–263. [CrossRef]
40. Auldist, M.J.; Coats, S.; Sutherland, B.J.; Mayes, J.J.; McDowell, G.H.; Rogers, G.L. Effects of somatic cell count
and stage of lactation on raw milk composition and the yield and quality of cheddar cheese. J. Dairy Res.
1996, 63, 269–280. [CrossRef]
41. Begum, I.; Azim, A.; Akhter, S.; Anjum, M.I.; Afzal, M. Mineral dynamics of blood and milk in dairy buffaloes
fed on calcium and phosphorus supplementation. Pak. Vet. J. 2010, 30, 105–109.
42. Carroll, S.M.; DePeters, E.J.; Taylor, S.J.; Rosenberg, M.; Perez-Monti, H.; Capps, V.A. Milk composition of
Holstein, Jersey, and Brown Swiss cows in response to increasing levels of dietary fat. Anim. Feed Sci. Tech.
2006, 131, 451–473. [CrossRef]
43. Ceballos, L.S.; Morales, E.R.; de la Torre Adarve, G.; Castgro, J.D.; Martinez, L.P.; Remedios, M.;
Sampelayo, S. Composition of goat and cow milk produced under similar conditions and analyzed by
identical methodology. J. Food Comp. Anal. 2009, 22, 322–329. [CrossRef]
44. Devold, T.G.; Brovold, M.J.; Langsrud, T.; Vegarud, G.E. Size of native and heated casein micelles, content of
protein and minerals in milk from Norwegian Red cattle—Effect of milk protein polymorphism and different
feeding regimes. Int. Dairy J. 2000, 10, 313–323. [CrossRef]
45. Frederiksen, P.D.; Andersen, K.K.; Hammershoj, M.; Poulsen, H.D.; Sorensen, J.; Bakman, M.; Qvist, K.B.;
Larsen, L.B. Composition and effect of blending of noncoagulating, poorly coagulating, and well-coagulating
bovine milk from individual Danish Holstein cows. J. Dairy Sci. 2011, 94, 4787–4799. [CrossRef]
46. Glantz, M.; Mansson, H.L.; Paulsson, M.; Stalhammar, H. Genomic selection in relation to bovine milk
composition and processability. J. Dairy Res. 2012, 79, 53–59. [CrossRef] [PubMed]
47. Griinari, J.M.; McGuire, M.A.; Dwyer, D.A.; Bauman, D.E.; Barbano, D.M.; House, W.A. The role of insulin in
the regulation of milk protein synthesis in dairy cows. J. Dairy Sci. 1997, 80, 2361–2371. [CrossRef]
48. Hussain, I.; Bell, A.E.; Grandison, A.S. Comparison of the rheology of mozzarella-type curd made from
buffalo and cows‘ milk. Food Chem. 2011, 128, 500–504. [CrossRef] [PubMed]
49. Hussain, I.; Yan, J.; Grandison, A.S.; Bell, A.E. Effects of gelation temperature on mozzarella-type curd made
from buffalo and cows‘ milk: 2. Curd yield, overall quality and casein fractions. Food Chem. 2012, 135,
1404–1410. [CrossRef]
50. Jensen, H.B.; Poulsen, N.A.; Andersen, K.K.; Hammershoj, M.; Poulsen, H.D.; Larsen, L.B. Distinct
composition of bovine milk from Jersey and Holstein-Friesian cows with good, poor, or noncoagulation
properties as reflected in protein genetic variants and isoforms. J. Dairy Sci. 2012, 95, 6905–6917. [CrossRef]
[PubMed]
51. Lindmark-Mansson, H.; Fonden, R.; Pettersson, H.E. Composition of Swedish dairy milk. Int. Dairy J. 2003,
13, 409–425. [CrossRef]
52. O’Brien, B.; Mehra, R.; Connolly, J.F.; Harrington, D. Seasonal variation in the composition of Irish
manufacturing and retail milks: 1. Chemical composition and renneting properties. Irish J. Agric. Food Res.
1999, 38, 53–64.
53. Malossini, F.; Bovolenta, S.; Piras, C.; DallaRosa, M.; Ventura, W. Effect of diet and breed on milk composition
and rennet coagulation properties. Annales de Zootechnie 1996, 45, 29–40. [CrossRef]
54. Mapekula, M.; Chimonyo, M.; Mapiye, C.; Dzama, K. Fatty acid, amino acid and mineral composition of
milk from nguni and local crossbred cows in South Africa. J. Food Comp. Anal. 2011, 24, 529–536. [CrossRef]
55. Mitchell, G.E.; Lyall, H.A.; Shackel, D.K. Milk composition in Queensland. Aust. J. Dairy Tech. 1978, 33,
80–84.You can also read