Groundwater Arsenic-Attributable Cardiovascular Disease (CVD) Mortality Risks in India
←
→
Page content transcription
If your browser does not render page correctly, please read the page content below
water
Article
Groundwater Arsenic-Attributable Cardiovascular Disease
(CVD) Mortality Risks in India
Ruohan Wu *, Lingqian Xu and David A. Polya *

                                          Department of Earth and Environmental Sciences, School of Natural Sciences and Williamson Research Centre for
                                          Molecular Environmental Sciences, University of Manchester, Manchester M13 9PL, UK;
                                          lingqian.xu@postgrad.manchester.ac.uk
                                          * Correspondence: ruohan.wu@postgrad.manchester.ac.uk (R.W.); david.polya@manchester.ac.uk (D.A.P.)

                                          Abstract: Cardiovascular diseases (CVDs) have been recognized as the most serious non-carcinogenic
                                          detrimental health outcome arising from chronic exposure to arsenic. Drinking arsenic contaminated
                                          groundwaters is a critical and common exposure pathway for arsenic, notably in India and other
                                          countries in the circum-Himalayan region. Notwithstanding this, there has hitherto been a dearth
                                          of data on the likely impacts of this exposure on CVD in India. In this study, CVD mortality risks
                                          arising from drinking groundwater with high arsenic (>10 µg/L) in India and its constituent states,
                                          territories, and districts were quantified using the population-attributable fraction (PAF) approach.
                                          Using a novel pseudo-contouring approach, we estimate that between 58 and 64 million people
                                          are exposed to arsenic exceeding 10 µg/L in groundwater-derived drinking water in India. On an
                                          all-India basis, we estimate that 0.3–0.6% of CVD mortality is attributable to exposure to high arsenic
                                          groundwaters, corresponding to annual avoidable premature CVD-related deaths attributable to
                                          chronic exposure to groundwater arsenic in India of between around 6500 and 13,000. Based on
                                the reported reduction in life of 12 to 28 years per death due to heart disease, we calculate value of

                                          statistical life (VSL) based annual costs to India of arsenic-attributable CVD mortality of between
Citation: Wu, R.; Xu, L.; Polya, D.A.     USD 750 million and USD 3400 million.
Groundwater Arsenic-Attributable
Cardiovascular Disease (CVD)
                                          Keywords: arsenic; groundwater; cardiovascular disease (CVD); population-attributable fraction
Mortality Risks in India. Water 2021,
                                          (PAF); geospatial statistical
13, 2232. https://doi.org/10.3390/
w13162232

Academic Editor: Aldo Fiori
                                          1. Introduction
Received: 21 July 2021                          Geogenic or anthropogenic arsenic has long been recognized as an important human
Accepted: 12 August 2021                  carcinogen [1,2]. Globally, and notably, particularly in India, the utilization of high arsenic
Published: 17 August 2021                 hazard groundwaters as drinking and irrigation water has posed, and still does pose, a
                                          serious threat to public health [3–5]. The major human exposure pathways to groundwater
Publisher’s Note: MDPI stays neutral      arsenic are drinking arsenic-contaminated groundwaters and consuming inorganic arsenic-
with regard to jurisdictional claims in   bearing crops, notably including rice [6,7], due, albeit only in part, to irrigation with high
published maps and institutional affil-   arsenic groundwater [8]. Chronic exposure to inorganic arsenic may give rise to internal
iations.                                  cancers (bladder, lung, kidney, and liver), skin cancers, skin lesions, and, importantly,
                                          cardiovascular diseases (CVDs), which are considered as the most serious non-carcinogenic
                                          detrimental health outcome [9–12].
                                                In India, arsenic contamination of groundwaters takes place mainly in the alluvial
Copyright: © 2021 by the authors.         deposits of major rivers (e.g., Ganges and Brahmaputra) flowing from the Himalayas and
Licensee MDPI, Basel, Switzerland.        Tibetan plateau [13–15]. The dominant mechanism of arsenic enrichment and mobilization
This article is an open access article    in these groundwaters in alluvial aquifers is the microbially mediated reductive dissolution
distributed under the terms and           of arsenic-bearing Fe(III) oxide (oxyhydroxide, hydroxide, and oxide) minerals [16,17].
conditions of the Creative Commons        Other processes, including complexation of arsenic by dissolved humic substances, com-
Attribution (CC BY) license (https://     petitive desorption, oxidation of sulfide minerals, geothermal activities, and mining-related
creativecommons.org/licenses/by/          activities, may also influence arsenic concentrations in groundwaters [18,19].
4.0/).

Water 2021, 13, 2232. https://doi.org/10.3390/w13162232                                                        https://www.mdpi.com/journal/water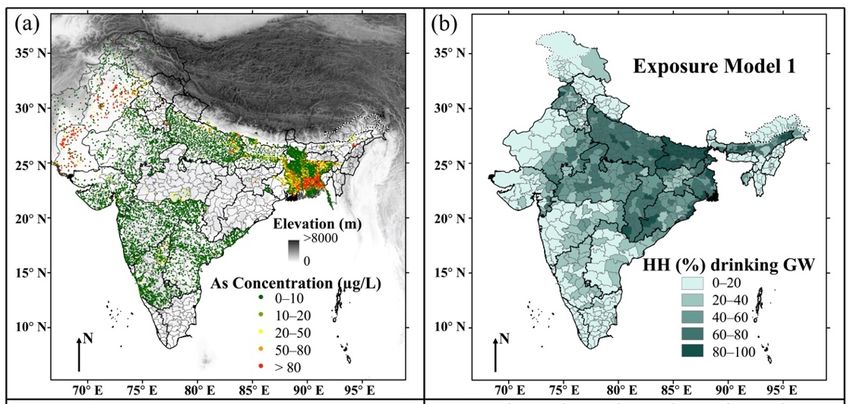
Water 2021, 13, 2232                                                                                          2 of 16

                             Spatial geostatistical models of the distribution of groundwater arsenic have been
                       produced at both state (Gujarat [20], Uttar Pradesh [21]) and national scales [22,23] to help
                       better fully understand the distribution of groundwater arsenic hazard in India, particularly
                       given the lack of all-India systematic groundwater arsenic testing. Podgorski et al. [22]
                       generated a random forest model with over a hundred thousand arsenic concentration
                       observations and over two dozen environmental parameter predictors to identify high
                       groundwater arsenic (>10 µg/L) in well-known arsenic-contaminated areas in the alluvial
                       sediments along the Ganges and Brahmaputra plains and in Gujarat and Punjab states
                       and to capture less-known or previously unrecorded areas. Estimates of the population
                       numbers in India exposed to high arsenic through drinking groundwaters range from 18 to
                       30 million [22] to 90 million [23].
                             Notwithstanding recent spatial distribution models of groundwater arsenic for India,
                       a country-wise and country-specific public health risk model, notably for cardiovascular
                       diseases has not yet been created. The association of CVDs with chronic exposure to arsenic
                       in drinking water have been widely discussed [24–28]. Meta-analysis is a recommended
                       method to quantify the dose–response relationship between CVDs and arsenic exposure,
                       suitably weighting the results of a range of studies [24,29]. Meanwhile, the population-
                       attributable fraction (PAF) approach is a common method used to quantify potential disease
                       burden reduction in population by eliminating a certain risk factor [30,31].
                             The aim of this study was to estimate the magnitude of groundwater arsenic-attributable
                       cardiovascular disease (CVD) mortality in India. These aims were achieved by (i) gener-
                       ating machine learning models of the probability distribution of groundwater arsenic
                       concentrations exceeding four different thresholds (10, 20, 50, 80 µg/L); (ii) thereby
                       creating a pseudo-contour map of groundwater arsenic concentrations; (iii) estimating
                       the state/district-level population exposed to these four arsenic concentration ranges
                       (10–20, 20–50, 50–80, >80 µg/L) based on simple exposure models; (iv) determining the
                       state/district-level population-attributable fraction (PAF) of CVD mortality attributable to
                       exposure to groundwater arsenic; and hence (v) determining the state-level CVD mortality
                       attributable to groundwater arsenic. Lastly, (vi) the costs of arsenic-attributable CVD
                       mortality were estimated for the whole of country.

                       2. Materials and Methods
                       2.1. Hazard Models of Groundwater Arsenic
                            A pseudo-contour map of groundwater arsenic concentrations for the whole of India
                       was produced, based on the machine learning approach of Podgorski et al. [22] incorporat-
                       ing the novel pseudo-contour approach of Wu et al. [20]. The reader is referred to those
                       studies [20,22] and the references therein for a brief account of the advantages, disadvan-
                       tages, and limitations of machine learning models. In this study, four random forest models,
                       encompassing 1001 trees, were conducted to comprehensively characterize the distribution
                       of groundwater arsenic by setting four different thresholds (10, 20, 50, and 80 µg/L) and
                       using the package ‘Random Forest’ in R statistical software. The prediction results of
                       the four machine learning models were applied to map the probability of groundwater
                       arsenic concentrations exceeding 10, 20, 50, and 80 µg/L in India. The cross-validations
                       of the random forest models were executed by area (AUC) under the receiver operating
                       characteristic (ROC) curve (0.5 for random model, 1 for perfect model) [32–34] calculated
                       on the testing dataset, while, the importance of the predictors in random forest models was
                       assessed by considering the decrease in accuracy as well as in Gini node impurity.
                            Compared with the random forest model of groundwater arsenic exceeding 10 µg/L
                       for India conducted by Podgorski et al. [22], 716 more geolocated (longitude/latitude)
                       groundwater arsenic concentration measurements [35–47] (Figure 1a and Table S1) and
                       5 more potential environmental predictors (Table S2) were included in the dataset; then,
                       the averaged 24,297 arsenic data were classified into 0–10 (59%, n = 14,192), 10–20 (9%,
                       n = 2233), 20–50 (14%, n = 3456), 50–80 (6%, n = 1536), and >80 (12%, n = 2880) µg/L
                       concentration categories (Figure S1). Considering the five arsenic concentration categories,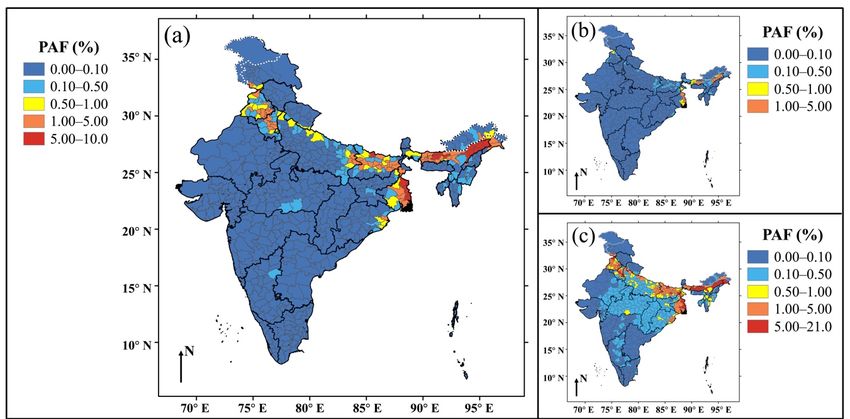
water arsenic concentrations by using a default probability cutoff value of 0.5. Such a ma-
                       chine learning approach may give rise to maps in which the areas ascribed to higher con-
                       centration categories may not entirely map within those ascribed to lower concentration
                       categories. In this study, this was minimized by appropriate stratified sampling on split-
Water 2021, 13, 2232                                                                                                  3 of 16
                       ting the overall dataset into training and testing datasets, but in the limited number                 of
                       areas for which this still arose, higher concentration areas were still recognized to exist for
                       the purposes of modelling arsenic-attributable health risks.
                       whichTheare district-wise
                                   different fromproportion
                                                    the arsenicof areas with groundwater
                                                                classification of Podgorski etarsenic
                                                                                               al. [22],concentration   ranges
                                                                                                         the entire dataset
                       of 10–20,
                       was         20–50,
                            randomly       50–80,
                                         split intoand  >80 μg/L
                                                    training  (80%)were
                                                                    andcalculated    based
                                                                          testing (20%)    on theby
                                                                                        datasets    pseudo-contour      map of
                                                                                                      stratified sampling
                       groundwater
                       to ensure that arsenic
                                        the same concentrations,   and the
                                                   ratios of the arsenic     error boundaries
                                                                          concentration        of thewere
                                                                                         categories    area present
                                                                                                            proportion
                                                                                                                     in thewere
                       entire, training,
                       estimated          and testing
                                    by Monte     Carlo datasets.
                                                       simulations (1000 times) [48].

                        Figure 1.
                       Figure   1. District-wise
                                   District-wise mapmap ofofspatial
                                                             spatialdistribution
                                                                     distributionofofIndia
                                                                                      Indiagroundwater
                                                                                              groundwaterarsenic
                                                                                                            arsenicand
                                                                                                                    andexposure
                                                                                                                         exposuredata
                       data utilized in this study. (a) District averaged arsenic concentrations and topographic elevation. (b)
                        utilized in  this study.   (a) District averaged   arsenic  concentrations    and topographic   elevation.
                        Exposure
                       (b) Exposure model
                                       model1:1:district-wise
                                                 district-wisepercentage
                                                                percentage of  households(HH)
                                                                            of households     (HH)drinking
                                                                                                    drinking  groundwater
                                                                                                            groundwater   viavia hand
                                                                                                                              hand
                        pumps   and   tube wells/boreholes.    (c) Exposure  model   2: district-wise percentage of
                       pumps and tube wells/boreholes. (c) Exposure model 2: district-wise percentage of households households   (HH)
                        drinking
                       (HH)        groundwater
                              drinking  groundwater via via
                                                         covered/uncovered
                                                            covered/uncovered  wells,  hand
                                                                                  wells,  handpumps,
                                                                                                 pumps,and
                                                                                                        andtube
                                                                                                             tubewells/boreholes.
                                                                                                                 wells/boreholes. (d)
                        Difference (expressed as percentage of households) between exposure models 1 and 2.
                       (d) Difference (expressed as percentage of households) between exposure models 1 and 2.

                            Then, these probability maps were converted into a pseudo-contour map of ground-
                       water arsenic concentrations by using a default probability cutoff value of 0.5. Such a
                       machine learning approach may give rise to maps in which the areas ascribed to higher
                       concentration categories may not entirely map within those ascribed to lower concentration
                       categories. In this study, this was minimized by appropriate stratified sampling on splitting
                       the overall dataset into training and testing datasets, but in the limited number of areas
                       for which this still arose, higher concentration areas were still recognized to exist for the
                       purposes of modelling arsenic-attributable health risks.
                            The district-wise proportion of areas with groundwater arsenic concentration ranges
                       of 10–20, 20–50, 50–80, and >80 µg/L were calculated based on the pseudo-contour map of
                       groundwater arsenic concentrations, and the error boundaries of the area proportion were
                       estimated by Monte Carlo simulations (1000 times) [48].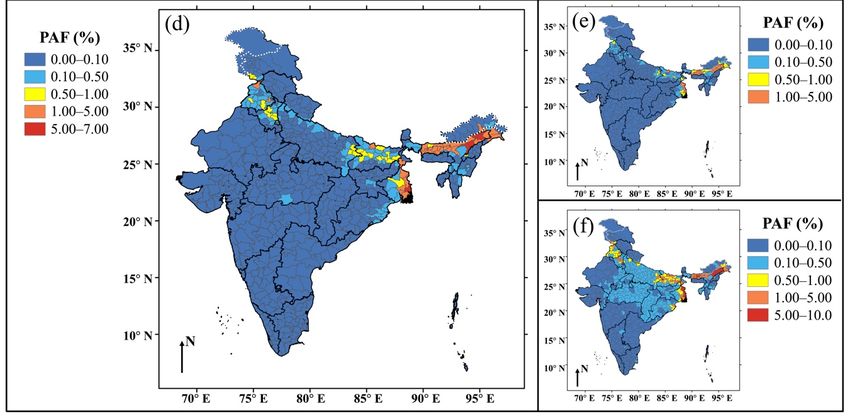
Water 2021, 13, 2232                                                                                                     4 of 16

                       2.2. Hazard and Population Exposure Maps
                             The district-wise proportion of areas with various groundwater arsenic concentration
                       ranges was combined with total/rural/urban population [49] and household proportion
                       of using groundwater as drinking water [50] to estimate district-wise total/rural/urban
                       population exposed to arsenic concentration ranges of 10–20, 20–50, 50–80, and >80 µg/L by
                       drinking groundwaters. The proportion of using groundwater as drinking water were cal-
                       culated by two model approaches: (exposure model 1) regarding water from hand pumps
                       and tube wells/boreholes as groundwater and (exposure model 2) considering water from
                       wells (covered + uncovered), hand pumps, and tube wells/boreholes as groundwater [51].
                       The spatial distribution of these values, together with that of the difference between two
                       values, is shown in Figure 1b–d.
                                                                           A                    A
                             Assuming that the fraction of district rural ( Ad,r,` ) and urban ( Ad,u,` ) areas with ground-
                                                                               d                    d
                       water arsenic level ` (` = 1 (0–10 µg/L), 2 (10–20 µg/L), 3 (20–50 µg/L), 4 (50–80 µg/L),
                        and 5 (> 80 µg/L)) are equal, the fraction of the district rural (Fd,r,gw,n,` ) and urban
                       (Fd,u,gw,n,` ) populations exposed to groundwater arsenic exposure levels were calculated
                       using Equations (1) and (2):

                                                                             Ad,r,l
                                                             Fd,r,gw,n,` =          × Xd,r,gw,n                             (1)
                                                                              Ad

                                                                             Ad,u,l
                                                             Fd,u,gw,n,` =          × Xd,u,gw,n                             (2)
                                                                              Ad
                       where Xd,r,gw,n and Xd,u,gw,n are the fraction of the households drinking groundwater in
                       rural and urban areas of a district, respectively, and n is the exposure model approach num-
                       ber to calculate proportion of using groundwater as drinking water, n = 1 (groundwater =
                       hand pump + tube well/borehole) or 2 (groundwater = well (covered + uncovered) + hand
                       pump + tube well/borehole).
                            The fraction of the total district population exposed to groundwater arsenic exposure
                       level ` (Fd,t,gw,n,` ) was then calculated by:

                                                                  Fd,r,gw,n,` × Pd,r + Fd,u,gw,n,` × Pd,u
                                             Fd,t,gw,n,` =                                                                  (3)
                                                                                   Pd,t

                       where Pd,t , Pd,r , Pd,u are the total, rural, and urban population respectively of a district.
                            Thus, district-wise rural (Pd,r,gw,n,` ), urban (Pd,u,gw,n,` ), and total (Pd,t,gw,n,` ) population
                       exposed to groundwater arsenic exposure level ` were estimated by Equations (4)–(6),
                       respectively:
                                                           Pd,r,gw,n,` = Fd,r,gw,n,` × Pd,r                                  (4)
                                                             Pd,u,gw,n,` = Fd,u,gw,n,` × Pd,u                               (5)
                                                 Pd,t,gw,n,` = Fd,r,gw,n,` × Pd,r + Fd,u,gw,n,` × Pd,u                      (6)

                       2.3. Pooled Relative Risks of Cardiovascular Disease (CVD) Related to Arsenic Concentrations in
                       Drinking Water
                            Incorporating the dose–response relationships between CVD mortality risk and arsenic
                       in drinking water from a recent meta-analysis by Xu et al. [24], the pooled log-linear and
                       non-linear relative risks for each CVD endpoint were calculated for arsenic concentrations
                       of 15 µg/L (mid-point of the 10–20 µg/L category), 35 µg/L (mid-point; 20–50 µg/L),
                       65 µg/L (mid-point; 50–80 µg/L), and 131 µg/L (a weighted mid-point for the >80 µg/L
                       category), using a drinking water arsenic concentration of 5 µg/L (mid-point for the
                       0–10 µg/L category) as the reference exposure. The goodness-of-fit of the model was
                       evaluated using deviance tests, coefficient of determination (R2 and adjusted R2 ) and
                       Akaike’s information criterion (AIC) values. The heterogeneity was illustrated by P-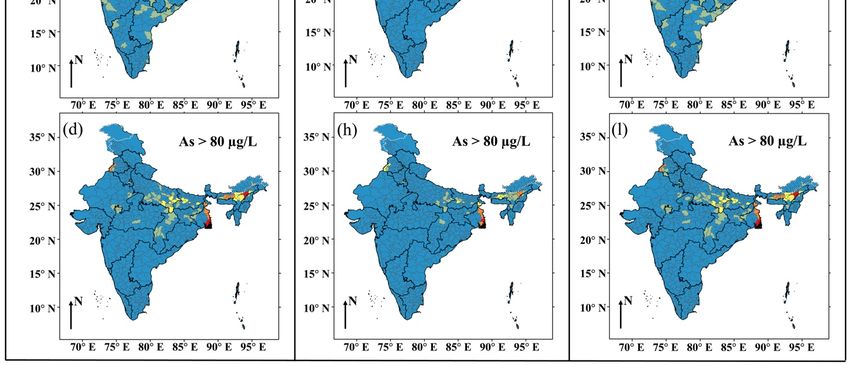
Water 2021, 13, 2232                                                                                              5 of 16

                       heterogeneity (p < 0.05 for significant), I2 -statistics (50% for high) and Cochran’s Q-statistic [52].

                       2.4. Cardiovascular Disease (CVD) Health Risk Estimation
                            The contribution of drinking groundwater with high arsenic (>10 µg/L) to CVD
                       mortality was quantified using the population-attributable fraction (PAF) approach. The
                       state-wise and district-wise PAFs of high groundwater arsenic-attributable CVD mortality
                       were calculated by combining the population exposure distribution and dose–response
                       relationship using Equation (7) based on the formula given by Rockhill et al. [30] and
                       Mondal et al. [31]:

                                                      ∑`= 5                   `=5 0
                                                       `=1 Fd,t,gw,n,` RR` − ∑`=1 Fd,t,gw,n,` RR`
                                             PAFn =                                                                  (7)
                                                                  ∑`= 5
                                                                   `=1 Fd,t,gw,n,` RR`

                       where RR` is the relative (to reference exposure level, ` =1, (0–10 µg/L)) risk of CVD
                       mortality at groundwater arsenic exposure level `; ` = 1 (0–10 µg/L), 2 (10–20 µg/L),
                                                                                                  0
                       3 (20–50 µg/L), 4 (50–80 µg/L), and 5 (> 80 µg/L); Fd,t,gw,n,` and Fd,t,gw,n,      ` are the frac-
                       tion of the total district population exposed to groundwater arsenic exposure level ` for
                       actually current situation and ideal situation, respectively; and n is the number of the
                       exposure model for calculating fraction of the population drinking groundwater. The error
                       boundaries of the PAF values were estimated by 1000 Monte Carlo simulations.
                             The PAF of groundwater arsenic-attributable CVD mortality was combined with pub-
                       lished data [53] on CVD mortality in India on a state-wise basis to quantify the state-wise
                       annual CVD mortality due to consuming high groundwater arsenic. Finally, the total
                       annual hospitalization costs due to high groundwater arsenic-attributable CVD mortality
                       were estimated for the whole of country based on the estimated PAFs, cost of hospitaliza-
                       tion [54], prevalent cases [55], and deaths [55] for CVDs. Value of statistical life (VSL)-based
                       annual costs of arsenic-attributable CVD mortality were estimated for India based on our
                       estimated CVD mortality, reported Indian individual VSL [56], and estimates of years of
                       life lost due to heart diseases [57,58].

                       3. Results and Discussion
                       3.1. Random Forest Models for Hazard Maps
                             The assembled dataset of 24,297 averaged arsenic concentration with potential en-
                       vironmental predictors were utilized to create four random forest models of probability
                       of groundwater arsenic exceeding 10, 20, 50, and 80 µg/L for the whole of India. The
                       optimal numbers with the smallest out-of-bag (OOB) error of predictors at individual tree
                       branch in random forest models were 16, 18, 22, and 21, separately (Table S3). There was
                       no predictor with negative mean decreases in both accuracy and Gini node impurity, so all
                       predictors benefited the models and so were retained in the models. The cross-validation
                       of the models on their testing dataset showed that the area (AUC) under the ROC curves
                       were 0.84, 0.84, 0.83, and 0.83, indicating good model prediction performance (Figure S2).
                       The importance of the predictors in the four random forest models is shown in Figure S3,
                       showing that some climate (e.g., temperature, actual evapotranspiration, aridity, precipita-
                       tion) and soil (e.g., fluvisols) predictors tend to have relatively higher importance and rank
                       than others.
                             The probability maps (Figure 2a–d) of arsenic concentration exceeding 10, 20, 50, and
                       80 µg/L in groundwaters were transformed into a pseudo-contour map (Figure 2e) of
                       groundwater arsenic concentrations using a probability cutoff value of 0.5. The concen-
                       tration map captured a significantly high hazard of groundwater arsenic in the north and
                       northeast India, particularly in Assam and West Bengal, mainly consistent with previously
                       well-known documented high hazard areas [22]. The district-wise proportions of areas
                       with various groundwater arsenic concentration ranges were calculated (Figure 3, and
                       Table S4), showing over 50% of areas of several districts in the Ganges and Brahmaputra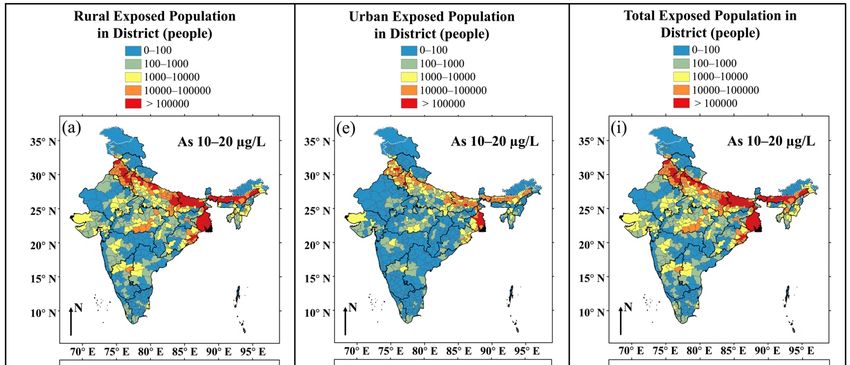
ated with greater errors than those at the state and country levels; however, most of those
                       districts having high groundwater arsenic listed by India Central Ground Water Board
                       (CGWB) [60] were captured by our models. The produced random forest models are only
                       2D models, not 3D models, and common limitations of such 2D models are illustrated by
Water 2021, 13, 2232   Podgorski et al. [22]), and Wu et al. [20,61]. Clearly, in areas where there are multiple
                                                                                                               6 of 16
                       aquifers, substantial differences between the arsenic concentrations between aquifers may
                       exist, indicating the requirement for detailed local studies and tests. However, the models
                       here may broadly reflect the relative sampling densities in these different aquifers, so they
                       alluvial plains, in
                       could arguably    bePunjab,
                                            used to and  in less
                                                     estimate    known
                                                               current    areas of Haryana
                                                                        exposures. However,and
                                                                                             as NCT   of Delhi
                                                                                                the balance  of with
                                                                                                                sam-
                       groundwater    arsenic  greater than 10  µg/L,  the provisional guideline value of arsenic
                       pling/supply between different aquifers changes, then these 2D models would necessarily      in
                       drinking  water  recommended     by
                       become dated and unrepresentative.  the  World  Health  Organization (WHO)   [59].

                       Figure 2.
                       Figure  2. Modelled
                                  Modelledhazard
                                             hazardmaps
                                                    mapsofofgroundwater
                                                              groundwater  arsenic in India.
                                                                              arsenic        Probability
                                                                                      in India.          of groundwater
                                                                                                Probability             arse-
                                                                                                              of groundwater
                       nic exceeding  (a) 10 μg/L, (b) 20  μg/L, (c) 50 μg/L,  and  (d) 80 μg/L. (e) Pseudo-contour   map
                       arsenic exceeding (a) 10 µg/L, (b) 20 µg/L, (c) 50 µg/L, and (d) 80 µg/L. (e) Pseudo-contour map of of
                       groundwater arsenic concentrations defined here using a probability cutoff value of 0.5.
                       groundwater arsenic concentrations defined here using a probability cutoff value of 0.5.

                            The district-wise statistics of modelled high groundwater arsenic areas were associated
                       with greater errors than those at the state and country levels; however, most of those
                       districts having high groundwater arsenic listed by India Central Ground Water Board
                       (CGWB) [60] were captured by our models. The produced random forest models are only
                       2D models, not 3D models, and common limitations of such 2D models are illustrated
                       by Podgorski et al. [22]), and Wu et al. [20,61]. Clearly, in areas where there are multiple
                       aquifers, substantial differences between the arsenic concentrations between aquifers may
                       exist, indicating the requirement for detailed local studies and tests. However, the models
                       here may broadly reflect the relative sampling densities in these different aquifers, so
                       they could arguably be used to estimate current exposures. However, as the balance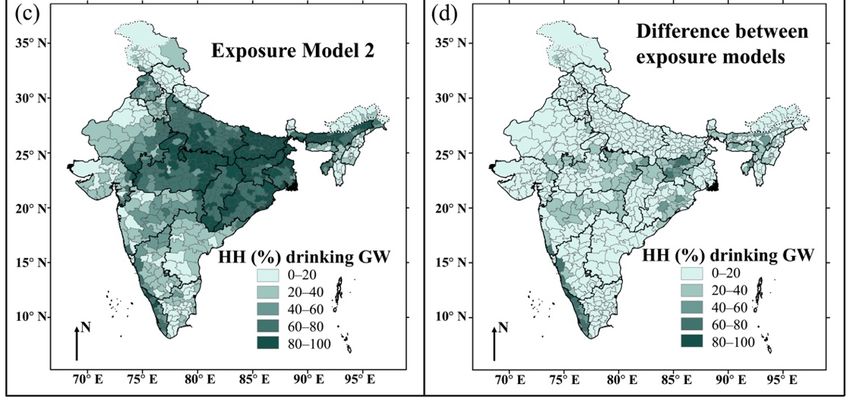
Water 2021, 13, 2232 7 of 16
of
Water 2021, 13, x FOR PEER REVIEW sampling/supply between different aquifers changes, then these 2D models would
7 of 16
necessarily become dated and unrepresentative.
Figure
Figure 3. 3.District-wise
District-wisedistribution
distributionofofmodelled
modelledpercentage
percentage of district areas
areas with
with groundwater
groundwaterarsenic
arsenicininthe
theconcentration
concentration
ranges of (a) 10 to 20 μg/L, (b) 20 to 50 μg/L, (c) 50 to 80 μg/L, and (d) >80
ranges of (a) 10 to 20 µg/L, (b) 20 to 50 µg/L, (c) 50 to 80 µg/L, and (d) >80 µg/L.μg/L.
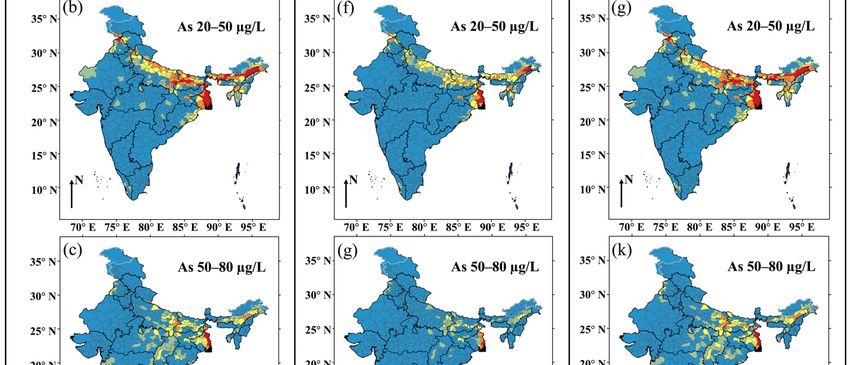
3.2.Population
3.2. Population Exposure
Exposure Maps
Maps
Thedistrict-wise
The district-wise total/rural/urbanpopulation
total/rural/urban population exposed
exposed to arsenic
to arsenic concentration
concentration ranges
ranges of 10–20, 20–50, 50–80, and >80 μg/L by drinking groundwater
of 10–20, 20–50, 50–80, and >80 µg/L by drinking groundwater are shown in Figure 4 (ex- are shown in Figure
4 (exposure
posure modelmodel 1), Figure
1), Figure S4 (exposure
S4 (exposure model model
2), and2),Table
and Table S4 (exposure
S4 (exposure model model
1). In1). In
India,
India, totally, we estimated that between 58 (exposure model 1) and
totally, we estimated that between 58 (exposure model 1) and 64 (exposure model 2) million 64 (exposure model
2) million inhabitants
inhabitants are exposedare exposedexceeding
to arsenic to arsenic10exceeding 10 μg/L in
µg/L in drinking drinking
water. This water.
estimationThisis
estimation is higher than the estimations of 31 million people by Ravenscroft
higher than the estimations of 31 million people by Ravenscroft et al. [62] and 18–30 million et al. [62]
and 18–30 million people by Podgorski et al. [22], whilst it is lower than
people by Podgorski et al. [22], whilst it is lower than the estimation of 90 million people the estimation of
90 million
exposed people
to high exposed
arsenic to high arsenic
in groundwater byinMukherjee
groundwater et al.by[23].
Mukherjee
We prefer et al.
our[23]. We
estimate
prefer our estimate of 58 million to 64 million as it is based on a more
of 58 million to 64 million as it is based on a more granular and detailed assessment granular and detailed
ofassessment of district-level
district-level exposures at exposures
a range at of aarsenic
range of arsenic concentration
concentration levels than levels
the than the
previous
previous estimates—we also note that this estimated range is consistent
estimates—we also note that this estimated range is consistent with the arithmetic mean with the arithme-
ofticthose
meanofofPodgorski
those of Podgorski
et al. [22] et
andal.Mukherjee
[22] and Mukherjee
et al. [23].etMeanwhile,
al. [23]. Meanwhile, about be-
about between 39.1
tween 39.1 (exposure model 1) and 43.4 (exposure model 2) million
(exposure model 1) and 43.4 (exposure model 2) million (i.e., 3.2–3.6% of the population (i.e., 3.2–3.6% of the
ofpopulation of India),
India), 15.1–17.0 15.1–17.0
million million (1.3–1.4%),
(1.3–1.4%), 1.5–1.6 million1.5–1.6 million
(0.1%), (0.1%),
and 2.3–2.4andmillion
2.3–2.4(0.2%)
mil-
lion (0.2%) people are exposed to high groundwater arsenic of
people are exposed to high groundwater arsenic of 10–20 µg/L, 20–50 µg/L, 50–80 µg/L, 10–20 μg/L, 20–50 μg/L,
50–80
and >80μg/L,
µg/L,and >80 μg/L, respectively,
respectively, with more ruralwith populations
more rural populations (32.9–36.6
(32.9–36.6 million for million for
10–20 µg/L;
10–20 μg/L;
12.3–13.8 12.3–13.8
million million
for 20–50 for 20–50
µg/L; μg/L; for
1.2 million 1.2 million for 50–80
50–80 µg/L; μg/L;
1.6–1.7 1.6–1.7
million formillion for
>80 µg/L)
>80 μg/L) currently consuming high arsenic in groundwaters than
currently consuming high arsenic in groundwaters than urban populations (6.1–6.8 millionurban populations (6.1–
6.810–20
for million for 10–20
µg/L; 2.9–3.1μg/L; 2.9–3.1
million millionµg/L;
for 20–50 for 20–50 μg/L; 0.3
0.3 million formillion for 50–80
50–80 µg/L; μg/L; 0.6
0.6 million for
million for >80 μg/L). A large number of districts in Assam, Bihar, and West Bengal states
>80 µg/L). A large number of districts in Assam, Bihar, and West Bengal states had a large
had a large population (>1 million people) drinking groundwater with high arsenic con-
population (>1 million people) drinking groundwater with high arsenic concentration
centration (>10 μg/L). The population exposures were based on two contrasting end-mem-
(>10 µg/L). The population exposures were based on two contrasting end-member as-
ber assumptions as to the arsenic status of shallow wells: (exposure model 1) shallow dug
sumptions as to the arsenic status of shallow wells: (exposure model 1) shallow dug wells
wells are largely groundwater arsenic-free and (exposure model 2) shallow dug wells con-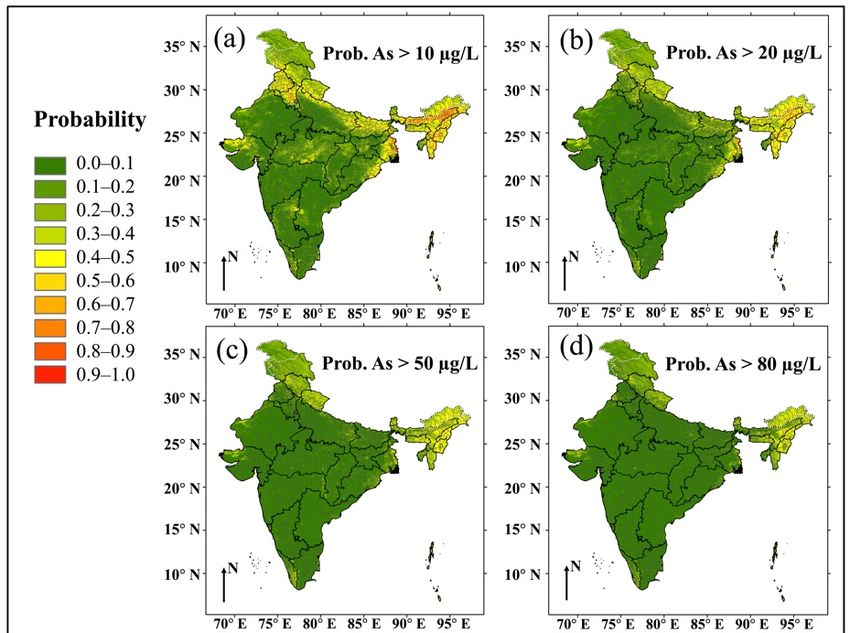
Water 2021, 13, 2232                                                                                                                   8 of 16

   Water 2021, 13, x FOR PEER REVIEW                                                                                                8 of 16

                                   are largely groundwater arsenic-free and (exposure model 2) shallow dug wells contain
                                   groundwater arsenic, posing a threat to human health. Thus, the range of values presented
                                     tain groundwater arsenic, posing a threat to human health. Thus, the range of values pre-
                                   here reflect in part uncertainties in the relative validities of exposure Models 1 and 2. It
                                     sented here reflect in part uncertainties in the relative validities of exposure Models 1 and
                                   is recognized both that (i) the validity of the models may be a function of geology and
                                     2. It is recognized both that (i) the validity of the models may be a function of geology and
                                   consumer behavior and (ii) the validity of the models may change with time, indeed may
                                     consumer behavior and (ii) the validity of the models may change with time, indeed may
                                   have
                                     havechanged
                                             changedmaterially
                                                      materially since  2011, the
                                                                 since 2011,   the date
                                                                                   dateofofthe
                                                                                            thebasis
                                                                                                basisofofthe
                                                                                                          thedistrict-wise
                                                                                                              district-wise  rural/urban
                                                                                                                           rural/urban
                                   population     data used in  this study  [49,50].
                                     population data used in this study [49,50].

         Figure
      Figure    4. Maps
             4. Maps  ofof modelleddistrict-wise
                         modelled    district-wisepopulation
                                                  population exposure
                                                               exposure to
                                                                         togroundwater
                                                                            groundwaterarsenic
                                                                                         arsenicininspecific concentration
                                                                                                      specific             ranges
                                                                                                               concentration      andand
                                                                                                                              ranges
         based on exposure model 1 (see text). District-wise rural (a–d), urban (e–h), and total (i–l) population exposed to arsenic
      based on exposure model 1 (see text). District-wise rural (a–d), urban (e–h), and total (i–l) population exposed to arsenic
         concentration ranges of 10 to 20 μg/L, 20 to 50 μg/L, 50 to 80 μg/L, and >80 μg/L by drinking groundwater.
      concentration ranges of 10 to 20 µg/L, 20 to 50 µg/L, 50 to 80 µg/L, and >80 µg/L by drinking groundwater.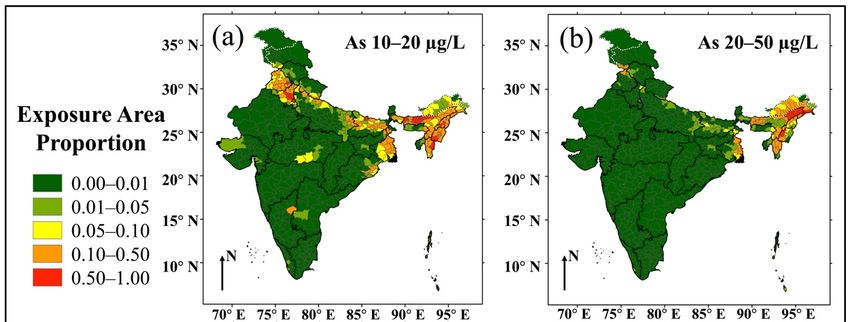
Water 2021, 13, 2232                                                                                                                     9 of 16

                                    3.3. Pooled Relative Risks of Cardiovascular Disease (CVD) Related to Arsenic Concentrations in
                                    Drinking Water
                                         The utilized linear and non-linear positive associations between mortality risk of car-
                                    diovascular diseases (CVDs) and arsenic concentrations in drinking water with significant
                                    overall trends (p < 0.05) were justified based on the recent meta-analysis by Xu et al. [24]
                                    (Table 1). The relative mortality risks of CVDs of arsenic concentration ranges of 10–20,
                                    20–50, 50–80, and >80 µg/L compared with the reference level of 0–10 µg/L are listed
                                    in Table 1. The association models have great heterogeneity due to considerable varia-
                                    tions of the selected studies in terms of study area, study design, exposure assessment,
                                    ascertainment of outcome, and adjustment of confounders.

      Table 1. Dose–response relationships between cardiovascular disease mortality and arsenic concentration in drinking water.
      Pooled relative risks (95% CIs) for cardiovascular disease (CVDs) mortality for the median concentration in each arsenic
      concentration category relative to the median concentration in the reference category of 0–10 µg/L. Calculations after Xu
      et al. [24]. Linear model: Coefficient for trend: 0.070; p-value for trend: 0.005; deviance: 22.58; AIC: −6.77; R2 : 0.258; adjusted
      R2 : 0.225; I2 : 77.9%; Cochran’s Q-statistic: 31.70; P-heterogeneity: 80 µg/L, respectively. Thus about 0.3–0.6% of CVD mortality in India could be eliminated
                                    if current exposure to groundwater with arsenic > 10 µg/L, the WHO provisional guideline
                                    value for drinking water arsenic, were eliminated.
                                          Based upon the PAF estimates by two exposure models and linear and non-linear
                                    dose–response relationships, recent annual hospitalization cost of USD 14.4 billion [54],
                                    prevalent cases of 54.5 million [55], and deaths of 2.8 million [55] for CVDs, annual total
                                    hospitalization costs due to high groundwater arsenic-attributable CVD mortality were
                                    estimated to be USD 1.95–3.74 million (exposure model 1) or USD 2.14–4.13 million (expo-
                                    sure model 2) in India. Meanwhile, the value of statistical life (VSL)-based annual costs of
                                    arsenic-attributable CVD mortality were estimated to be USD 749–3127 million (exposure
                                    model 1) or USD 813–3408 million (exposure model 2) in India, according to our estimated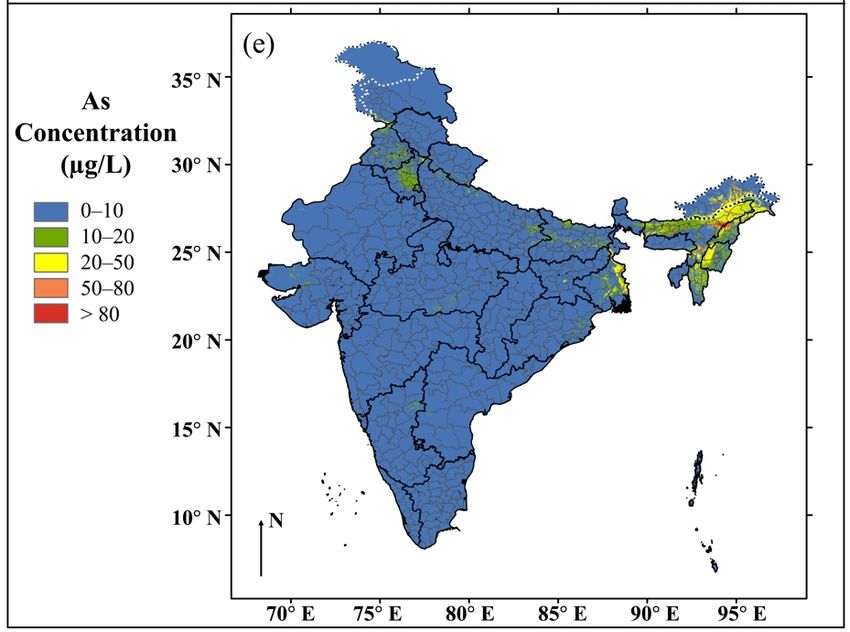
Water 2021, 13, 2232                                                                                            10 of 16

                       mortality, reported individual VSL of USD 0.64 million [56], and year of life lost due to heart
                       diseases per death of 12 years [58] or 28 years [57]. The produced VSL is much higher than
                       our estimated hospitalization costs—this may be because many people, notably in poorer
                       rural areas, do not get hospital treatments or only get limited and incomplete treatments
                       for their CVD. Although CVD cases that are untreated by hospitals do not give rise to
                       hospitalization costs, they still impact the country’s economy, this being more accurately
                       reflected in VSL-based cost estimates. Lastly, on this point, we note that the estimated costs
                       here are only in relation to CVD mortality—costs related otherwise to morbidity, though
                       not quantified here, are likely also to be very substantial.
                             At the state level, the PAFs (Tables S5 and S6) of groundwater arsenic-attributable
                       CVD mortality were calculated to be highest in Assam (2.5% to 5.7%) and West Bengal
                       (1.6% to 2.7%). The PAFs of most entire states were estimated to be below 1%. Combined
                       with recently reported disease burden of CVDs for India [53], the annual state-wise CVD
                       mortalities due to consuming high groundwater arsenic were estimated and are listed
                       in Table S7 (exposure model 1) and Table S8 (exposure model 2). For the whole of In-
                       dia, in total, the modelled annual CVD mortality attributable to chronic consumption of
                       high groundwater arsenic was estimated to be about 6510–12,132 (exposure model 1) or
                       7067–13,224 (exposure model 2). The country-wise cost and state-wise mortality estimates
                       were completed based on reported data of from somewhat different years (PAF: 2011;
                       hospitalization cost, death, and cases: 2016, disease burden: 2019), which may cause some
                       estimation bias; however, the magnitude of this bias is considerably less than the combined
                       uncertainties arising from hazard distribution, exposure and dose–response models, and
                       documented all-cause CVD disease burden in India.
                             At a district level (Figures 5 and S5 and Table S4), the estimated PAF of groundwa-
                       ter arsenic-attributable CVD mortality was as high as between 6.0 (exposure model 1,
                       non-linear dose–response relationship) and 9.8% (exposure model 1, linear dose–response
                       relationship) or between 6.5 (exposure model 2, non-linear dose–response relationship) and
                       10.7% (exposure model 2, linear dose–response relationship) in Dhemaji district (Assam),
                       indicating that drinking high arsenic groundwater is likely to be one of most important
                       factors causing CVD mortality in some Indian districts. Relatively higher PAF (>3%, about
                       5 or 10 times the country-wise overall PAF) was identified in some further districts in
                       Arunanchal Pradesh, Assam, Bihar, Punjab, Nagaland, and West Bengal states. This is
                       consistent with the recorded distribution of well-known relatively higher groundwater
                       arsenic [22]. District-wise PAF estimates exhibit a wider range of modelled CVD mortality
                       attributable to drinking high arsenic groundwater than state-wise PAF estimations, how-
                       ever, in part because of the greater number of districts than state, but further it is reiterated
                       that the reliability of the model decreases as it becomes more granular. Overall modelled
                       mean hazard and ultimately CVD risk for the whole of India are associated with smaller
                       relative errors than for the same estimates at the state level, more so at the district level,
                       whilst very substantial errors might be expected if the model were used to predict arsenic
                       concentrations at one well/household level, an application of the model that we do not
                       recommend unless supplemented by well-specific testing.
Water 2021, 13, 2232 11 of 16
Water 2021, 13, x FOR PEER REVIEW 11 of 16
Figure 5.
Figure 5. District-level
District-level maps
maps of
of India
India showing
showing (a,d)
(a,d) population-attributable
population-attributable fraction
fraction (PAF)
(PAF) of
of high
high groundwater
groundwater arsenic-
arsenic-
attributable CVD
attributable CVD mortality
mortality with
with error
error boundaries
boundaries (lower
(lower (b,e)
(b,e) and
and upper
upper (c,f)
(c,f) limits)
limits) based
based on
on exposure
exposure model
model 11 (see
(see text).
text).
PAF estimations were based on both linear (a–c) and non-linear (d–f) dose–response relationships between cardiovascular
PAF estimations were based on both linear (a–c) and non-linear (d–f) dose–response relationships between cardiovascular
disease mortality and arsenic concentration in drinking water.
disease mortality and arsenic concentration in drinking water.
4.
4. Conclusions
Conclusions
By
By combining
combining machine
machine learning
learning models
models of groundwater arsenic
of groundwater arsenic distribution
distribution with with
basic
basic exposure route models and CVD-specific dose–response models, we provide the
exposure route models and CVD-specific dose–response models, we provide for for
first timetime
the first an estimate of both
an estimate of boththe the
magnitude
magnitude andanddistribution
distributionof groundwater
of groundwater arsenic-at-
arsenic-
tributable
attributable CVDCVD mortality
mortalityrisks in India.
risks in India.TheThe
datadata
were mapped
were mappedat country, state,
at country, and and
state, dis-
trict scales, although the higher resolution (e.g., district-level) mapping
district scales, although the higher resolution (e.g., district-level) mapping and modelling and modelling is
likely to be associated with higher relative model
is likely to be associated with higher relative model errors. errors.
As
As the
the basis
basis of
of this,
this, we generated for
we generated the first
for the first time
time aa pseudo-contour
pseudo-contour map map of of model
model
groundwater
groundwater arsenicarsenicconcentrations
concentrationsfor forthe
thewhole
wholeofofIndia,
India, based
based upon
upon the
the machine
machine learn-
learning
ing approach
approach of Podgorski
of Podgorski et al.and
et al. [22] [22]the
and the pseudo-contour
pseudo-contour approach approach
of Wu etofal.Wu etIncorpo-
[20]. al. [20].
Incorporation
ration of CVD of CVD dose–response
dose–response relationships
relationships aftermeta-analysis
after a recent a recent meta-analysis
by Xu et al.by Xuus-
[24], et
al. [24], using the PAF approach rather than an absolute risk vs. dose–response
ing the PAF approach rather than an absolute risk vs. dose–response (cf. Mondal et al. [31]) (cf. Mondal
et
has al.enabled
[31]) hasmajor
enabled major spatially
spatially variable variable
drivers of drivers
CVD of in CVD
India,into India, to aextent,
a large large extent,
to be
to be implicitly
implicitly takentaken into account
into account in thein the health-risk
health-risk modelling.
modelling.Water 2021, 13, 2232 12 of 16
On a country-wise basis, groundwater arsenic is calculated to contribute to around
0.3–0.6% of all CVD mortality, but this figure is much higher (>3%) for many individual
districts in Arunanchal Pradesh, Assam, Bihar, Punjab, Nagaland, and West Bengal and
indicates that the continued focusing of government and NGO resources on mitigation
of groundwater-derived drinking water supplies in these areas is indicated to protect
public health.
On a country-wise basis, we estimate around 6500 to 13,000 premature avoidable CVD
deaths may be ascribed to chronic exposure from groundwater-derived drinking water
supplies with high arsenic concentrations. The cost of this on a VSL (value of a statistical
life) basis is conservatively estimated to be at least on the order of USD 750 million to
USD 3400 million per annum. These costs could be used to inform what magnitude of
investment might reasonably be warranted to mitigate high arsenic groundwater-derived
drinking water supplies in India.
Lastly, we note that the models presented are also limited both in terms of data
availability and the nature of the models themselves. In particular, (i) the hazard models
are dependent on the quality of the published data upon which they are based [20,22,61];
(ii) the geospatial hazard models produced here are 2D models, not 3D models, that
do not consider comprehensively the often substantial differences between the arsenic
concentrations in shallow aquifers often exploited via dug wells and deeper aquifers
often exploited by tube wells or boreholes [22,61]; (iii) in the absence of more detailed
readily available public domain data, the exposure models make plausible but untested
assumptions about the distribution of groundwater arsenic concentrations within districts
and in particular between areas dominated by rural and urban populations; (iv) the data
on district-wise drinking water supply resources and total/rural/urban populations were
produced in 2011 [49,50] and so the exposure and health risk estimates may be dated
as a result of changes in population distribution and water supply type since that time;
(v) model imprecision is likely to be greater at higher spatial resolutions—thus country-wise
estimates are likely to be more precise than, in turn, state-wise and district-wise estimates,
and extending the model to individual wells and households is not recommended—indeed,
for the latter, any material decision-making would be best advised to be based on due
consideration by appropriate professionals of individual/household level circumstances
and data.
Supplementary Materials: The following are available online at https://www.mdpi.com/article/
10.3390/w13162232/s1, Figure S1: Frequency distribution of averaged groundwater arsenic con-
centrations used in this study, Figure S2: Cross-validation results. ROC curves and AUC values
of random forest models of groundwater arsenic exceeding (a) 10, (b) 20, (c) 50, and (d) 80 µg/L,
Figure S3: Normalized importance of predictors in terms of mean decrease values in accuracy and
in Gini node impurity in the random forest models of groundwater arsenic exceeding (a) 10, (b) 20,
(c) 50, and (d) 80 µg/L. Both mean decrease in accuracy and mean decrease in Gini node impurity
were normalized by their largest values, respectively, Figure S4: Maps of modelled district-wise
population exposure to groundwater arsenic in specific concentration ranges and based on exposure
model 2 (see text). District-wise rural (a–d), urban (e–h), and total (i–l) population exposed to arsenic
concentration ranges of 10 to 20 µg/L, 20 to 50 µg/L, 50 to 80 µg/L, and >80 µg/L by drinking
groundwater, Figure S5: District-level maps showing (a,d) population-attributable fraction (PAF)
of high groundwater arsenic-attributable CVD mortality with error boundaries (lower (b,e) and
upper (c,f) limits), based on exposure model 2 (see text). PAF estimations were based on both linear
(a–c) and non-linear (d–f) dose–response relationships between cardiovascular disease mortality and
arsenic concentration in drinking water, Table S1: Groundwater arsenic concentration measurements
in random forest models. Existing arsenic measurements taken from over 50 sources, mainly from
India but also some neighboring South Asian countries. Summaries are given for before and after
spatial averaging (geometric mean of arsenic concentrations within a 1 km2 pixel), Table S2: Potential
predictors used in the machine learning models. Brief descriptions and data sources are listed, Table
S3: Comparison of out-of-bag (OOB) errors as a function of number of available predictors at each
branch in random forest models (note 31 is the total number of potential predictors). The numberWater 2021, 13, 2232 13 of 16
shown in grey shadow is the optimum number of predictors at each branch in the model, Table S4:
Modelled district-wise exposures and cardiovascular disease (CVD) health risk. District-wise rural,
urban, and total population exposed to arsenic concentration ranges of 10 to 20, 20 to 50, 50 to 80,
and >80 µg/L by drinking groundwater. Population-attributable fraction (PAF) of high groundwater
arsenic-attributable CVD mortality. The estimations were based on exposure model 1 regarding
water from hand pumps and tube wells/boreholes as groundwater, and both linear and non-linear
dose–response relationships between cardiovascular disease mortality and arsenic concentration in
drinking water, Table S5: Modelled state-wise cardiovascular disease (CVD) health risk. State-wise
rural, urban, and total population exposed to arsenic concentration ranges of 10 to 20, 20 to 50,
50 to 80, and >80 µg/L by drinking groundwater. Population-attributable fraction (PAF) of high
groundwater arsenic-attributable CVD mortality. The estimations were based on exposure model
1 regarding water from hand pumps and tube wells/boreholes as groundwater, and both linear
and non-linear dose–response relationships between cardiovascular disease mortality and arsenic
concentration in drinking water, Table S6: Modelled state-wise cardiovascular disease (CVD) health
risk. State-wise rural, urban, and total population exposed to arsenic concentration ranges of 10 to 20,
20 to 50, 50 to 80, and >80 µg/L by drinking groundwater. Population-attributable fraction (PAF)
of high groundwater arsenic-attributable CVD mortality. The estimations were based on exposure
model 2 considering water from wells (covered + uncovered), hand pumps, and tube wells/boreholes
as groundwater, and both linear and non-linear dose–response relationships between cardiovascular
disease mortality and arsenic concentration in drinking water, Table S7: India state-wise modelled
annual CVD mortality attributable to chronic consumption of high groundwater arsenic in India
based on exposure model 1, including total CVD mortality for all high arsenic concentrations and
CVD mortality for four different arsenic concentration categories (10–20, 20–50, 50–80, and >80 µg/L).
These mortality estimations were based on both linear and non-linear dose–response relationships
between cardiovascular disease mortality and arsenic concentration in drinking water. By definition
only there is no modelled arsenic-attributable CVD mortality in the reference arsenic concentration
category. Exposure model 1 assumes that modelled groundwater arsenic hazard data apply to and
exposure arises from only hand pumps, tube wells, and boreholes. Although modelled mortalities
for model 1 are somewhat lower than for model 2, these differences are of the same order as the
uncertainties in baseline all-cause CVD mortality data for the states, Table S8: India state-wise
modelled annual CVD mortality attributable to chronic consumption of high groundwater arsenic in
India based on exposure model 2, including total CVD mortality for all high arsenic concentrations
and CVD mortality for four different arsenic concentration categories (10–20, 20–50, 50–80, and
>80 µg/L). These mortality estimations were also based on both linear and non-linear dose–response
relationships between cardiovascular disease mortality and arsenic concentration in drinking water.
By definition only there is no modelled arsenic-attributable CVD mortality in the reference arsenic
concentration category. Exposure model 2 assumes that modelled groundwater arsenic hazard data
apply to and exposure arises from covered/uncovered hand pumps, tube wells, and boreholes.
Although modelled mortalities for model 1 are somewhat lower than for model 2, these differences
are of the same order as the uncertainties in baseline all-cause CVD mortality data for the states.
Author Contributions: Conceptualization, D.A.P., R.W. and L.X.; methodology, software, validation,
formal analysis in relation to As–CVD dose–response relationships: L.X.; all other methodology,
software, validation, formal analysis, R.W.; data curation, R.W.; writing—original draft preparation,
R.W.; writing—review and editing R.W., D.A.P. and L.X.; supervision and project administration,
D.A.P.; funding acquisition, D.A.P. and L.X. All authors have read and agreed to the published
version of the manuscript.
Funding: This research was funded in part by the Newton Fund, Natural Environmental Research
Council (UK) (NE/R003386/1), and Department of Science and Technology (India) (DST/TM/INDO-
UK/2K17/55(C) & 55(G)) and a University of Manchester President’s Doctoral Scholarship to L.X.
Institutional Review Board Statement: Not applicable.
Informed Consent Statement: Not applicable.
Data Availability Statement: Data presented in this study not otherwise available from the references
and organizations indicated in the text may be available on request from the corresponding authors.Water 2021, 13, 2232 14 of 16
Acknowledgments: We thank and acknowledge the Newton Fund, NERC (UK), and DST (India)
for their joint funding of the Indo-UK Water Quality project, FAR-GANGA (www.farganga.org,
(accessed on 20 February 2021)). L.X. acknowledges with thanks the receipt of a University of
Manchester President’s Doctoral Scholarship. We thank Biswajit Chakravorty, Himanshu Joshi,
Debapriya Mondal, Abhijit Mukherjee, Joel Podgorski, Peter Ravenscroft, and Dipankar Saha for
discussions. The opinions expressed in this paper however do not necessarily reflect those of any
of the organizations or individuals whom we acknowledge here. This paper is dedicated to the
memory of Sanjay Bajpai, former Head of Technology Mission Division at the DST and to whom we
are indebted for his support and advice for the Indo-UK FAR-GANGA project and more widely for
the development of applied research in water and energy in India (https://www.psa.gov.in/article/
memory-dr-sanjay-bajpai/2868, (accessed on 20 February 2021)).
Conflicts of Interest: The authors declare no conflict of interest. The funders had no role in the design
of the study; in the collection, analyses, or interpretation of data; in the writing of the manuscript; or
in the decision to publish the results. We note that no jurisdictional claims are made or implied in the
boundaries presented in figures in this article.
References
1. Pinto, S.S.; Bennett, B. Effect of arsenic trioxide exposure on mortality. Arch. Environ. Health Int. J. 1963, 7, 583–591. [CrossRef]
2. Currie, A. The role of arsenic in carcinogenesis. Br. Med. Bull. 1947, 4, 402–405. [CrossRef]
3. Rodell, M.; Velicogna, I.; Famiglietti, J.S. Satellite-based estimates of groundwater depletion in India. Nature 2009, 460, 999.
[CrossRef]
4. Famiglietti, J.S. The global groundwater crisis. Nat. Clim. Chang. 2014, 4, 945–948. [CrossRef]
5. Polya, D.A.; Sparrenbom, C.; Datta, S.; Guo, H. Groundwater arsenic biogeochemistry–Key questions and use of tracers to
understand arsenic-prone groundwater systems. Geosci. Front. 2019, 10, 1635–1641. [CrossRef]
6. Mondal, D.; Polya, D.A. Rice is a major exposure route for arsenic in Chakdaha block, Nadia district, West Bengal, India: A
probabilistic risk assessment. Appl. Geochem. 2008, 23, 2987–2998. [CrossRef]
7. Williams, P.N.; Islam, M.R.; Adomako, E.E.; Raab, A.; Hossain, S.A.; Zhu, Y.G.; Feldmann, J.; Meharg, A.A. Increase in rice
grain arsenic for regions of Bangladesh irrigating paddies with elevated arsenic in groundwaters. Environ. Sci. Technol. 2006, 40,
4903–4908. [CrossRef] [PubMed]
8. Dittmar, J.; Voegelin, A.; Roberts, L.C.; Hug, S.J.; Saha, G.C.; Ali, M.A.; Badruzzaman, A.B.M.; Kretzschmar, R. Spatial distribution
and temporal variability of arsenic in irrigated rice fields in Bangladesh. 2. Paddy soil. Environ. Sci. Technol. 2007, 41, 5967–5972.
[CrossRef]
9. Polya, D.A.; Middleton, D.R. Arsenic in drinking water: Sources & human exposure. In Best Practice Guide on the Control of Arsenic
in Drinking Water, 1st ed.; Bhattacharya, P., Polya, D.A., Draganovic, D., Eds.; International Water Association Publishing: London,
UK, 2017; Chapter 1; ISBN 9781843393856.
10. Ferreccio, C.; Smith, A.H.; Duran, V.; Barlaro, T.; Benitez, H.; Valdes, R.; Aguirre, J.J.; Moore, L.E.; Acevedo, J.; Vasquez, M.I.; et al.
Case-Control Study of Arsenic in Drinking Water and Kidney Cancer in Uniquely Exposed Northern Chile. Am. J. Epidemiol.
2013, 178, 813–818. [CrossRef] [PubMed]
11. Chen, Y.; Graziano, J.H.; Parvez, F.; Liu, M.; Slavkovich, V.; Kalra, T.; Argos, M.; Islam, T.; Ahmed, A.; Rakibuzzaman, M. Arsenic
exposure from drinking water and mortality from cardiovascular disease in Bangladesh: Prospective cohort study. Brit. Med. J.
2011, 342, d2431. [CrossRef]
12. Farzan, S.F.; Chen, Y.; Rees, J.R.; Zens, M.S.; Karagas, M.R. Risk of death from cardiovascular disease associated with low-level
arsenic exposure among long-term smokers in a US population-based study. Toxicol. Appl. Pharmcol. 2015, 287, 93–97. [CrossRef]
[PubMed]
13. Ahmed, K.M.; Bhattacharya, P.; Hasan, M.A.; Akhter, S.H.; Alam, S.M.; Bhuyian, M.H.; Iman, M.B.; Khan, A.A.; Sracek, O. Arsenic
enrichment in groundwater of the alluvial aquifers in Bangladesh: An overview. Appl. Geochem. 2004, 19, 181–200. [CrossRef]
14. Chakraborti, D.; Rahman, M.M.; Das, B.; Nayak, B.; Pal, A.; Sengupta, M.K.; Hossain, M.A.; Ahamed, S.; Sahu, M.; Saha, K.C.; et al.
Groundwater arsenic contamination in Ganga–Meghna–Brahmaputra plain, its health effects and an approach for mitigation.
Environ. Earth Sci. 2013, 70, 1993–2008. [CrossRef]
15. McArthur, J.M.; Ravenscroft, P.; Safiulla, S.; Thirlwall, M.F. Arsenic in groundwater: Testing pollution mechanisms for sedimentary
aquifers in Bangladesh. Water Resour. Res. 2001, 37, 109–117. [CrossRef]
16. Islam, F.S.; Gault, A.G.; Boothman, C.; Polya, D.A.; Charnock, J.M.; Chatterjee, D.; Lloyd, J.R. Role of metal-reducing bacteria in
arsenic release from Bengal delta sediments. Nature 2004, 430, 68–71. [CrossRef] [PubMed]
17. Berg, M.; Stengel, C.; Trang, P.T.K.; Viet, P.H.; Sampson, M.L.; Leng, M.; Samreth, S.; Fredericks, D. Magnitude of arsenic pollution
in the Mekong and Red River Deltas—Cambodia and Vietnam. Sci. Total Environ. 2007, 372, 413–425. [CrossRef] [PubMed]
18. Guo, H.; Zhang, B.; Li, Y.; Berner, Z.; Tang, X.; Norra, S.; Stüben, D. Hydrogeological and biogeochemical constrains of arsenic
mobilization in shallow aquifers from the Hetao basin, Inner Mongolia. Environ. Pollut. 2011, 159, 876–883. [CrossRef]Water 2021, 13, 2232 15 of 16
19. Mladenov, N.; Zheng, Y.; Simone, B.; Bilinski, T.M.; McKnight, D.M.; Nemergut, D.; Radloff, K.A.; Rahman, M.M.; Ahmed, K.M.
Dissolved organic matter quality in a shallow aquifer of Bangladesh: Implications for arsenic mobility. Environ. Sci. Technol. 2015,
49, 10815–10824. [CrossRef]
20. Wu, R.; Podgorski, J.; Berg, M.; Polya, D.A. Geostatistical model of the spatial distribution of arsenic in groundwaters in Gujarat
State, India. Environ. Geochem. Health 2020, 43, 2649–2664. [CrossRef]
21. Bindal, S.; Singh, C.K. Predicting groundwater arsenic contamination: Regions at risk in highest populated state of India. Water
Res. 2019, 159, 65–76. [CrossRef]
22. Podgorski, J.E.; Wu, R.; Chakravorty, B.; Polya, D.A. Groundwater Arsenic Distribution in India by Machine Learning Geospatial
Modeling. Int. J. Environ. Res. Public Health 2020, 17, 7119. [CrossRef]
23. Mukherjee, A.; Sarkar, S.; Chakraborty, M.; Duttagupta, S.; Bhattacharya, A.; Saha, D.; Bhattacharya, P.; Mitra, A.; Gupta, S.
Occurrence, predictors and hazards of elevated groundwater arsenic across India through field observations and regional-scale
AI-based modeling. Sci. Total Environ. 2021, 759, 143511. [CrossRef]
24. Xu, L.; Mondal, D.; Polya, D.A. Positive association of Cardiovascular Disease (CVD) with chronic exposure to drinking water
Arsenic (As) at concentrations below the WHO provisional guideline value: A systematic review and meta-analysis. Int. J.
Environ. Res. Public Health 2020, 17, 2536. [CrossRef]
25. Rahman, M.; Sohel, N.; Yunus, M.; Chowdhury, M.E.; Hore, S.K.; Zaman, K.; Bhuiya, A.; Streatfield, P.K. A prospective cohort
study of stroke mortality and arsenic in drinking water in Bangladeshi adults. BMC Public Health 2014, 14, 174. [CrossRef]
[PubMed]
26. Wu, F.; Jasmine, F.; Kibriya, M.G.; Liu, M.; Wójcik, O.; Parvez, F.; Rahaman, R.; Roy, S.; Paulbrutus, R.; Segers, S. Association
Between Arsenic Exposure from Drinking Water and Plasma Levels of Cardiovascular Markers. Am. J. Epidemiol. 2012, 175,
1252–1261. [CrossRef] [PubMed]
27. Chen, Y.; Wu, F.; Liu, M.L.; Parvez, F.; Slavkovich, V.; Eunus, M.; Ahmed, A.; Argos, M.; Islam, T.; Rakibuz-Zaman, M.; et al.
A Prospective Study of Arsenic Exposure, Arsenic Methylation Capacity, and Risk of Cardiovascular Disease in Bangladesh.
Environ. Health Perspect. 2013, 121, 832–838. [CrossRef] [PubMed]
28. Islam, M.S.; Mohanto, N.C.; Karim, M.R.; Aktar, S.; Hoque, M.M.; Rahman, A.; Jahan, M.; Khatun, R.; Aziz, A.; Salam, K.A.;
et al. Elevated concentrations of serum matrix metalloproteinase-2 and-9 and their associations with circulating markers of
cardiovascular diseases in chronic arsenic-exposed individuals. Environ. Health 2015, 14, 92. [CrossRef] [PubMed]
29. National Research Council. Critical Aspects of EPA’s IRIS Assessment of Inorganic Arsenic: Interim Report; The National Academies
Press: Washington, DC, USA, 2013; p. 127, ISBN 978-0-309-29706-6.
30. Rockhill, B.; Newman, B.; Weinberg, C. Use and misuse of population attributable fractions. Am. J. Public Health 1998, 88, 15–19.
[CrossRef]
31. Mondal, D.; Adamson, G.C.; Nickson, R.; Polya, D.A. A comparison of two techniques for calculating groundwater arsenic-related
lung, bladder and liver cancer disease burden using data from Chakdha block, West Bengal. Appl. Geochem. 2008, 23, 2999–3009.
[CrossRef]
32. Breiman, L. Random forests. Mach. Learn. 2001, 45, 5–32. [CrossRef]
33. Ho, T.K. Random decision forests. In Proceedings of the 3rd International Conference on Document Analysis and Recognition,
Montreal, QC, Canada, 14–16 August 1995; Volume 1, pp. 278–282. [CrossRef]
34. Fawcett, T. An introduction to ROC analysis. Pattern Recognit. Lett. 2006, 27, 861–874. [CrossRef]
35. Sharma, P. A Study on the Groundwater Quality of a Part of Brahmaputra Floodplain in Nalbari District Assam with Special
Reference to Arsenic and Fluoride. 2011. Available online: http://hdl.handle.net/10603/114375 (accessed on 2 May 2019).
36. Satyapal, G.K.; Mishra, S.K.; Srivastava, A.; Ranjan, R.K.; Prakash, K.; Haque, R.; Kumar, N. Possible bioremediation of arsenic
toxicity by isolating indigenous bacteria from the middle Gangetic plain of Bihar, India. Biotechnol. Rep. 2018, 17, 117–125.
[CrossRef] [PubMed]
37. Dubey, C.S.; Mishra, B.K.; Shukla, D.P.; Singh, R.P.; Tajbakhsh, M.; Sakhare, P. Anthropogenic arsenic menace in Delhi Yamuna
flood plains. Environ. Earth Sci. 2012, 65, 131–139. [CrossRef]
38. Mishra, B.K.; Dubey, C.S.; Shukla, D.P.; Bhattacharya, P.; Usham, A.L. Concentration of arsenic by selected vegetables cultivated
in the Yamuna flood plains (YFP) of Delhi, India. Environ. Earth Sci. 2014, 72, 3281–3291. [CrossRef]
39. Tirkey, P.; Bhattacharya, T.; Chakraborty, S. Arsenic and other metals in the groundwater samples of Ranchi city, Jharkhand, India.
Curr. Sci. 2016, 110, 76. [CrossRef]
40. Kaur, T.; Bhardwaj, R.; Arora, S. Assessment of groundwater quality for drinking and irrigation purposes using hydrochemical
studies in Malwa region, southwestern part of Punjab, India. Appl. Water Sci. 2017, 7, 3301–3316. [CrossRef]
41. Coyte, R.; Singh, A.; Furst, K.; Mitch, W.; Vengosh, A. Co-occurrence of geogenic and anthropogenic contaminants in groundwater
from Rajasthan, India. Sci. Total Environ. 2019, 688, 1216–1227. [CrossRef] [PubMed]
42. Singh, C.K.; Kumar, A.; Bindal, S. Arsenic contamination in Rapti River basin, Terai region of India. J. Geochem. Explor. 2018, 192,
120–131. [CrossRef]
43. Mukherjee, A.; Fryar, A.E. Deeper groundwater chemistry and geochemical modeling of the arsenic affected western Bengal
basin, West Bengal, India. Appl. Geochem. 2008, 23, 863–894. [CrossRef]You can also read