Akhand Pratap Singh - Axis Direct
←
→
Page content transcription
If your browser does not render page correctly, please read the page content below
Akhand Pratap Singh
akhand.singh@axissecurities.in
11 Jan 2017 Thematic Report
Contents Sector: Textile
Page
Executive Summary 3
Business overview and triggers 5
China – Leader in textile export loosing its shine 13
Structural changes in T&A in favor of India 17
Indian textile business overview 23
Our picks
KPR Mill Ltd 29
Siyaram Silk Mills Ltd 35
Ambika Cotton Mills Ltd 39
Annexure 44
2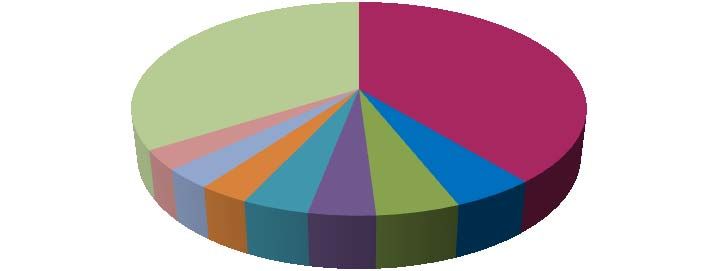
11 Jan 2017 Thematic Report
Executive Summary Sector: Textile
The Textile & Apparel (T&A) industry is dynamic and has witnessed multiple shifts throughout its
history. T&A production was earlier located in developed economies such as the US and UK but
over the years manufacturing has shifted to developing economies like China, Bangladesh etc.
Industry transformation due to the cost advantage offered by these countries.
in the making Currently China (the largest producer and exporter of T&A) is creating a space in T&A export (on
account of loosing competitive advantage and becoming self consuming economy) which is
resulting in another geographical shift in T&A. Structural changes in Chinese T&A industry has
created opportunities for other countries to exploit.
Trade partners in T&A are largely driven by lower capital and labor intensity . On account of low
Cost reduction , a key cost base, developing countries produce half the world’s textile exports and nearly three-quarters
driver for the shift of the world’s clothing exports. Buyers interest has increased in moving production/outsourcing
from China to other Asian countries due to increased cost in China.
Growing domestic market and increasing opportunities in global trade on account of declining
Structural changes in share of Chinese export will create enormous scope for Indian players. In addition to favorable
T&A in favor of India demographic dividend, stable economic conditions, increasing disposable income, growing
population, increased urbanization and higher brand consciousness are acting as growth drivers
for India’s domestic market.
3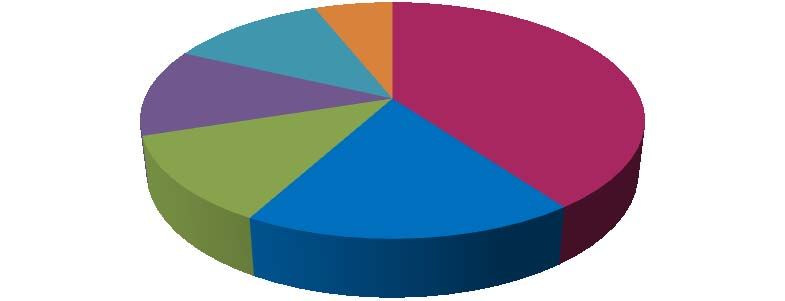
11 Jan 2017 Thematic Report
Executive Summary Sector: Textile
India is one of the most cost competitive textile manufacturing base for entire value chain of T&A.
India a key beneficiary Labour cost in India is lower than most of the competing countries except Bangladesh, Ethiopia
of loss of China’s and Kenya. Although power cost is on the higher side but still cheaper than China and
share in global trade Cambodia. Importers look at India as an alternative of China due to quality, its cost
competitiveness, better adherence to compliance and political stability.
Export to report a India’s textile and apparel exports reported a CAGR of 8.1% over 2005-2016 and stood at
CAGR growth of ~USD 40 bn in 2015-2016. Going forward, according to Alok Industries report, India’s T&A
19% by 2025 exports are projected to reach to USD 185 bn 2025, a CAGR growth of 19% over 2016-2025.
4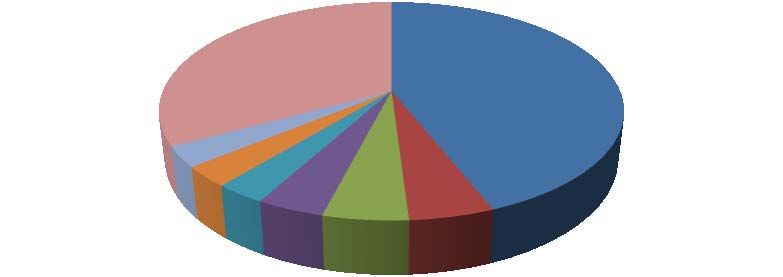
Business overview and triggers
11 Jan 2017 Thematic Report
Global Textile and Apparel (T&A) trade Sector: Textile
Textile Market growth
World textile and apparel (T&A) export market was worth USD 745 bn in 2015 and is expected to reach to USD 1600 Bn by
2025E, with a CAGR of 7.9%.
The global textile trade was worth USD 319 billion (43% global textile trade share) in 2015, while the global apparel trade
was worth USD 426 billion (57% share). In coming years, growth of the trade in knit fabric and apparel is likely to remain
higher than that for the woven counterparts. Going forward, textile and apparel demand will be fueled by population
growth, urbanization and higher incomes that will substantially increase household purchasing power. GDP per capita is
expected to keep rising with a rate of 3-4% over next four years.
Major T&A export countries
China is largest T&A exporter in the world with a market share of ~37% in 2015. India, Bangladesh, Vietnam etc. are the
other major T&A exporters. In 2015, India was second largest exporter with 5.2% share in T&A export.
Over 2005-2013, Vietnam has delivered a tremendous CAGR of 17.5% in T&A export while T&A export of China and India
have grown at a CAGR of 12.9% and 11.3% respectively.
Textile export: China, the European Union and India remained the top three exporters of textiles in 2015. Altogether, they
accounted for almost two-thirds of world exports. Highest declines in exports was seen in the European Union (-14%) and
Turkey (-13%) while China reported an export decline of (-2%)
Apparel export: In 2015, the top ten apparel exporter countries accounted for 87% of world exports of clothing. Among the
top ten 2015 apparel exporters, increases in export values were recorded by Vietnam (+10%), Cambodia
(+8%), Bangladesh (+6%) and India (+2%).
Apparel is the largest exported category for major T&A exporter countries with a share of 94% in Bangladesh, 61% in
China, 39% in India and 78% in Vietnam. Apparel’s export contribution in India’s overall T&A export is on lower side which is
likely to improve going forward. Value addition by apparel is higher than yarn and fabrics.
6
11 Jan 2017 Thematic Report
Global Textile and Apparel (T&A) trade Sector: Textile
Major T&A import countries:
The largest importers of T&A are USA (17% import share), China-Hong Kong (9% share), Germany (8% share), Japan (7%
share), UK (5.1% share), France (4% share) and Italy (3.8% share).
US and EU continued to account for 52% of global imports. Japan’s imports grew at a fast pace of 9% in 2005-2013
Developed countries continue to be the major importers although new markets such as Russia, Brazil, Poland, Australia, South
Korea etc are also showing tremendous growth in T&A import.
Global T&A export
From 2006 to 2015, the global textile and apparel trade has grown at a rate of 4% per annum to USD 745 bn
900
797
800 766 745
706 708
700 618
588 602
600 530 527
500
400
300
200
100
0
2006 2007 2008 2009 2010 2011 2012 2013 2014 2015
USD Billion
Source: Company, Axis Securities
7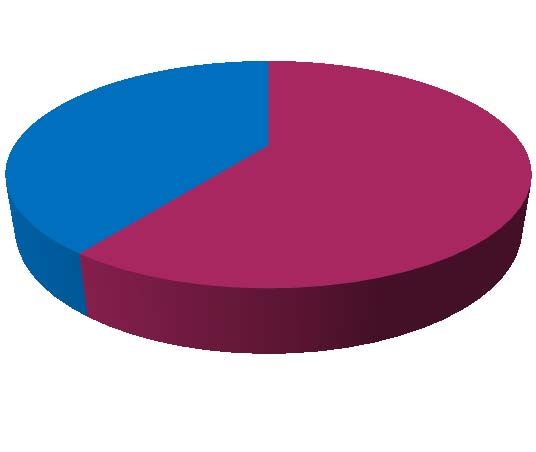
11 Jan 2017 Thematic Report
Global T&A trade Sector: Textile
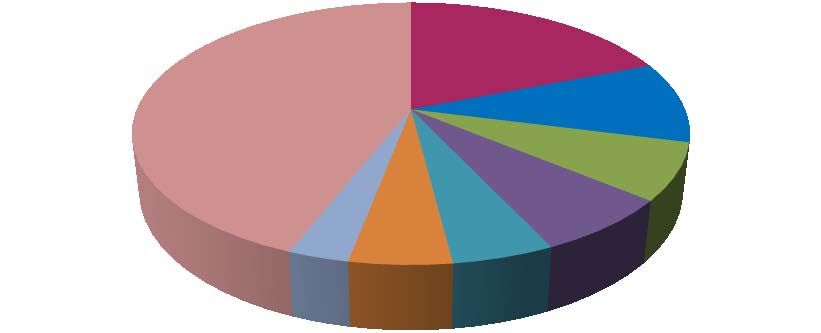
Market share of major exporting nations (2013) Major markets for Indian textile and apparel exports (2015)
The top 5 textile and apparel exporting nations are China, India, Italy, Germany
and Turkey. China, the largest exporter, has a share of 39% while India is distant
second with 5% share.
19%
44%
10%
Others, 34% China, 39%
7%
7%
3% 5% 5%
Vietnam, 3%
India, 5%
Bangladesh, Italy, 5%
3% USA, 3% Turkey, 4% Germany, 4%
USA UAE UK China Bangladesh Germany France Others
Source: Textile Ministry , Axis Securities
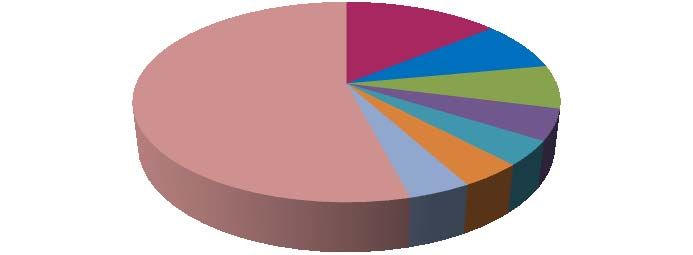
Market share of importing nations (2013) India’s positioning
The top 5 textile and apparel importing nations are USA, China, Germany, Japan India is the second largest exporter of textile & apparel in
and United Kingdom. USA is the single largest importer with a share of approx.
14% of the total global trade. the world after China, with a share of approx. 5.2% of
USA, 14%
China & global textile and apparel trade. Indian export for textile
HK, 8%
and apparel has grown from US$ 31 billion in 2010-11 to
Others, 54% Germany, 7% US$ 40 billion in 2015-16 registering a CAGR of 5.2%. In
Japan, 5%
2015-16, India’s domestic consumption stood at
France, 4% USD 97 bn.
United
Italy, 4%
Kingdom, 4%
Source: Textile Ministry, Axis Securities
811 Jan 2017 Thematic Report
Growth Drivers Sector: Textile
Per capita spend on apparel Rising income and changing lifestyles
Per capita apparel consumption in developing countries Growing urbanization and rising per capita income of India
like India and China is expected to increase by more than & China would result in increased purchasing power and
2 times in next 10 years (CAGR of 9-11%) and will make change in lifestyle. China & India will be key markets for the
developing countries the drivers of incremental growth of textile and apparel. The expenditure on apparel
growth, while the developed markets will still remain never goes down in absolute terms and increased
important because of their large size. purchasing power will lead to higher spend on apparels.
The growth rate is likely to remain higher for developing
1116 countries while developed countries will show a moderate
978 growth. But developed markets will provide huge
855 846 766
736 768 opportunity to textile exporters on account of their large size
711 683 693
despite moderate growth in demand.
USD
435 Global apparel consumption to grow at a CAGR of 4.4% in
404 390
270 282 next 10 years
172
123
45 Global Apparel consumption will become USD 2600 Bn
Region ( USD Bn) 2015 2025 CAGR (%)
Brazil
Australia
China
India
Russia
Japan
Canada
USA
EU 28
EU 28 350 390 1.1%
USA 315 385 2.0%
China 237 615 10.0%
2015 2025F
Japan 93 105 1.2%
Source: Company, Textile Ministry Report, Axis Securities
India 59 180 11.8%
India’s per capita apparel consumption is just 4.6% of US Brazil 56 90 4.9%
consumption, which has highest apparel consumption in RoW 575 835 3.8%
the world. Total 1685 2600 4.4%
Source: Alok Industries, Axis Securities
911 Jan 2017 Thematic Report
Growth Drivers Sector: Textile
India and China’s apparel market to be bigger than USA and Europe by 2025
China and India are expected to be the major growth centers for apparel consumption. According to Alok Industries report, the
combined apparel market size of India and China is likely to reach to a level of USD 795 Bn ( CAGR of 10.4% over next ten
years) by 2025 while USA and Europe are expected to have a combined market size of USD 775 bn by 2025 ( CAGR of 1.5%
over 2015-2025).
Export from low manufacturing cost countries to get a boost
In search of low cost manufacturing base, the textile and apparel manufacturing industry has continued to move from one part of
the world to the other
China’s loss of share in global T&A export will provide opportunities for emerging exporters such as
Vietnam, Ethiopia, Kenya, Myanmar, Bangladesh and India.
1011 Jan 2017 Thematic Report
Challenges for Indian players Sector: Textile
Trans - Pacific Partnership (TPP): The Trans - Pacific Partnership Agreement (TPP) is a regional free -trade agreement (FTA)
signed by trade ministers of 12 member countries, Including the United States, on February 4, 2016, but is not yet
implemented due to pending negations. These 12 countries collectively cover half of the global output and ~40% of world
trade. TPP countries constitute important destination for Indian products as around 25% of Indian exports are destined for TPP
nations. USA alone is the destination for 16% of India’s textile exports and 22% of India’s apparel exports. TPP is likely to
impact the T&A export of India in adverse manner as TPP countries will get benefit of low or nil duties to export to the US
market as well as member countries. India is not a part of TPP, hence duties levied on Indian products would be higher than TPP
members which will make Indian products expensive as compared to TPP members and would make Indian T&A exports less
competitive. Vietnam is likely to benefit the most.
Profitability undermined by volatile raw material prices and rising wages
Fierce competition weighing on margins and further stressed by e-commerce activities
Changing consumer behavior (e.g. fast fashion) forcing T&A manufacturers to become more flexible
India does not have duty free access to EU and US markets, which gives other competing countries a major competitive
advantage over India.
1111 Jan 2017 Thematic Report
Industry’s dramatic geographical shifts Sector: Textile
T&A industry chases cheap labor
Driven by the importance of cheap labor to the competitiveness of T&A industry participants, the search for low wages underpins a history of
dramatic geographic shifts in the T&A industry. Three such shifts have occurred historically and recent increased consumption and wages in
China would lead to another shift in the base of T&A trade/ manufacturing to other South Asian countries.
Late 18th century : Origin of T&A
First revolution started in Britain in the late 18th century and was based on imported cotton. The modern form of textile manufacturing using
factories with machinery driven by artificial motive power. It expanded in North America and Western Europe.
First shift in T&A (1950 – 1960): From North America and Western Europe to Japan
Initially based on British spinning machinery and later (post world war II) based on its own indigenously developed state of the art
equipment, Japan became the most preferred destination.
Second shift (1970-80): Japan to Hong Kong, Taiwan and South Korea
The second shift was from Japan to Hong Kong, Taiwan and the Republic of Korea. These countries dominated textile and clothing exports in the
1970’s and early 1980’s.
Third shift (1980 -90) : Hong Kong, Taiwan & South Korea to China
The third migration was a move to other developing countries in Asia. In the 1980’s production moved principally to mainland China, but also to
Indonesia, Malaysia, the Philippines, Sri Lanka and Thailand.
Fourth Shift (2012-13): China to India, Vietnam, Cambodia, Bangladesh
Rising labor costs coupled with increased consumption of T&A in China, volatility in Chinese currency and loosing competitiveness in
manufacturing is leading to fourth geographical shift in T&A industry. The immediate beneficiaries are India, Vietnam, Bangladesh etc.
12China – Leader in textile export loosing its shine
11 Jan 2017 Thematic Report
China’s dominance in textile export set to come down Sector: Textile
The T&A export growth rate of China has fallen from 11.4% in 2013 to -4.9% in 2015 and from 2015
onwards, China’s T&A exports are continuously delivering a negative growth.
In 2015, China’s textile export was down -2% to USD 109 bn, while apparel export was down by -6% to
USD 175 bn.
China’s T&A exports are expected to contract further and as per industry estimates, the apparel exports’ growth is
expected to reduce to 4% CAGR over the next decade vs. a 12% CAGR growth for last 10 years.
China’s T&A export Growth rate of China’s T&A exports
Steady growth of domestic demand but severe export situation Growth rate shows a slow down in Chinese T&A industry
350 14%
298.5 11.4%
300 284.1 283.9 12%
248 255
10%
250
8%
200 5.1%
6%
150 128.4 125
4%
100 2%
50 0%
0 -2%
-4% -2.6%
2011 2012 2013 2014 2015 H12015 H12016 -3.1%
-6% -4.9%
USD Bn 2013 2014 2015 H12015 H12016
Source: Weiqiao Textile presentation , Axis Securities Ltd.
Source: Weiqiao Textile presentation , Axis Securities Ltd.
1411 Jan 2017 Thematic Report
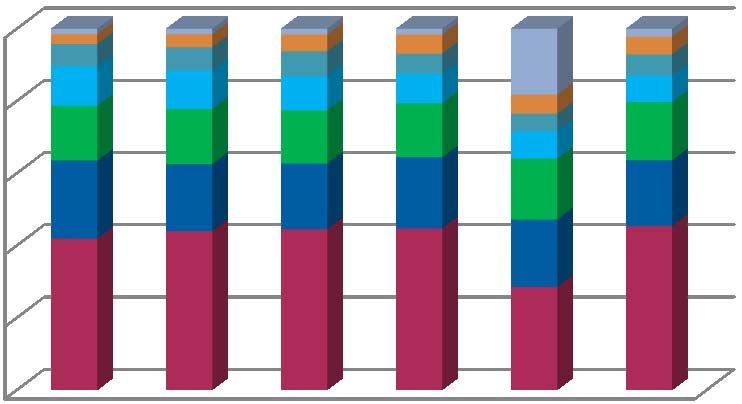
China’s T&A exports (by regions) Sector: Textile
China’s Textile and Apparel Exports (by regions) Global cotton consumption forecast
100%
29% 31%
80% 29% 31% 2016-17
60%
3%
3%
6%
6%
40% 9% 22%
9% 22% 2015-16
20%
0% China India Pakistan Turkey US Others
2011 2012 2013 2014 2015 H12016 Source: Weiqiao Textile presentation , Axis Securities Ltd.
Others EU US Japan Hong Kong Vietnam Bangladesh
Global cotton supply forecast
Source: Weiqiao Textile presentation , Axis Securities Ltd.
21%
Growth rate shows a slow down in Chinese T&A industry 23%
24% 23%
In 1H2016, China’s textile and apparel exports were 2016-17
USD 125 billion, down 2.6% YoY 13%
16%
In 1H2016, China’s textile and apparel were exported to 6%
27%26%
7%
6%
USA (down 5% Y-o-Y), Japan (down 5.1% Y-o-Y), EU 8% 2015-16
(4.4% Y-o-Y), Vietnam (down 9.1% Y-o-Y). Exports to
other regions delivered a de-growth of 2.3% China India Pakistan Brazil US Others
Source: Weiqiao Textile presentation , Axis Securities Ltd.
1511 Jan 2017 Thematic Report
…China’s slow down in T&A export to benefit India Sector: Textile
The growth of domestic demand of T&A in China is expected to surpass exports growth. While on the supply side, higher
manufacturing cost and shift to value added sectors may result in slowdown of T&A manufacturing growth. Consequently .
China’s market share in global T&A trade may reduce from the current levels.
China’s share in global T&A export to reduce from present level due to two major factors –
Increased growth in China’s domestic demand driven by higher incomes and increased per capita spend on apparel
On supply side, China’s shift towards service economy and manufacturing of value added sectors to result in a changing
supply chain landscape; this will benefit of South East Asian countries
Rising per capita income making China a self consuming economy (domestic consumption growing at 13% CAGR) likely to
impact its ability to export
Chinese export becoming uncompetitive:
Chinese manufacturing becoming less competitive due to rising labor and power cost which has resulted in decline in T&A
exports from China. Wages in China have doubled over the past five years. Monthly manufacturing wages in Shanghai
were about $ 500-550, about three times higher than those in Hanoi, Vietnam's capital.
Currency volatility: Appreciation of Chinese Yuan against the Dollar created an adverse effect on the costs for Chinese
exports
Indian products are design lead compared to commoditized products of China
16Structural changes in T&A in favor of India
11 Jan 2017 Thematic Report
Competitive advantage to Indian textile manufacturers Sector: Textile
Cost advantage to India amongst the competing nations
Country India Bangladesh China Vietnam Cambodia Ethiopia Kenya
Labour cost US$/ month 140-160 100 500-550 180 190 50-60 125-150
Power cost US cents / Kwh 10-12 9-12 15-16 8 22 4 9
Lending rate % 10-12% 13% 5-6% 6-7% 15% 8.5-9.5% 16-18%
Water cost US Cents / m3 18 20.5 57 50-80 70-90 30-40 150-180
Backward India and China have complete value chain of textile business i.e. from fibre to finished products. Bangladesh and Vietnam have
integration strong garment manufacturing capacity but very limited backward linkages to support the competitiveness
Source: Alok Industries annual report, Axis Securities
India is one of the most cost competitive textile manufacturing base for entire value chain of T&A. Labour cost in India
is lower than most of the competing countries except Bangladesh, Ethiopia and Kenya. Although power cost is on the
higher side but still cheaper than China and Cambodia. Importers look at India as an alternative of China due to
quality, its cost competitiveness, better adherence to compliance and political stability.
1811 Jan 2017 Thematic Report
Change in cost matrix Sector: Textile
Structural changes in favor of India
China, earlier known for low production costs and a stable currency, has experienced a record rise in production costs
(21% over 2013-2015) and trying to mitigate the volatility of the Yuan. Chinese market share is showing an ongoing
decrease in textile export.
Chinese textiles manufacturers have lost competitive advantages of lower cost of production in the last few years.
China’s competitiveness in cotton textiles dropping rapidly while India’s competitiveness is steadily improving.
This has offered an opportunity for Indian textiles sector to grab the market share of China in the developed
world, especially the European Union and the United States, which cumulatively comprise around 60% of the global
export market.
China move towards a service economy to result in a changing supply chain landscape, will benefit South East Asian
countries. The Indian textiles industry, currently estimated at around USD137 billion, is expected to reach USD 470
billion by 2025 with domestic and export size of USD 285 bn and USD 185 bn respectively.
Rising per capita income making China a self consuming economy (domestic consumption growing at 13% CAGR) likely to
impact its ability to export
1911 Jan 2017 Thematic Report
Structural change: Manifests in higher market share for India Sector: Textile
India’s textile and apparel exports reported a CAGR of India’s market share in textile and apparel trade has
8.1% over 2005-2016 and stood at ~USD 40 bn in increased from 3.7% in 2006 to 5.2% in 2015. India’s
2016. Going forward India’s T&A exports are projected share in world textile export in 2015 increased to 7%
to grow at a CAGR of 18.5% over 2016-2025E to reach while in apparel export, it was reported at 4.1%.
USD 185 bn by 2025.
Potential for India to grow in T&A exports is immense
Apparel exports with an expected CAGR of 21% are particularly as the China, the global leader is facing
likely to play a major role in deriving the higher growth higher cost of production with increase in wages and
in T&A export. focusing on a shift to services, and some of the other
competing countries like Turkey, Bangladesh etc witnessing
India’s T&A export market share is likely to increase from political instability, high inflation, currency appreciation
5.2% in 2015 to 12% in 2023E and concerns over workplace conditions
T&A export growth rate to accelerate CAGR
19%
India’s share in global textile export to rise
185 1400 14%
200 12.0%
1200 11.0% 12%
10.0%
CAGR 9.1%
150 16% CAGR 1000 8.3% 10%
21% 7.6%
800 6.9% 8%
USD Bn
6.3%
90 95 600 6%
USD Bn
100
400 4%
50 40 200 2%
17 23 17 861 904 949 996 1046 1098 1153 1211
9 8 0 0%
0 2016E 2017E 2018E 2019E 2020E 2021E 2022E 2023E
2005 2016 2025E World textile export (USD Bn) India's textile export (USD Bn)
Total T&A Textiles Apparel India's share
Source: Alok Industries , Axis Securities Ltd. Source: Industry reports, Axis Securities Ltd.
2011 Jan 2017 Thematic Report
Indian textile industry set to grow Sector: Textile
Domestic demand to grow at a CAGR of 13% over 2016-2025E The Indian textiles industry is set for strong growth, buoyed
300 285 by strong domestic consumption as well as export demand.
250
198 Rising per capita income, growing middle classes and shift
200
in preference to branded products to boost domestic
150
97 83 demand of textile and apparels
USD Bn
87
100
50 28 23 14 According to World Bank, urban population accounts for
5
0 32.7% of the total population of India. This works as
2005 2016 2025E
demand driver due to changing taste and preferences in
the urban part of India
Total Household consumption Technical textiles
Source: Alok Industries, Wazir Advisors, Handlooms.nic.in, Axis Securities Ltd. India’s per capita consumption on garment is expected to
increase from USD 37 in 2013 to USD 129 by 2025. The
Indian Textile Market growth rate of per capita spend on garment is highest for
2016 2025 India and China at ~11%
Domestic 97 13% 285 Domestic market’s 74% T&A demand comes from
apparel, 7% from home textile and 19% from Technical
textiles. Apparel and technical textiles are likely to grow at
a rate of 15-20% over next few years.
Exports 40 19% 185
Increasing outsourcing over the years as Indian players
moved up the value chain from being mere converters to
vendor partners of global retail giants. With global retail
Total 137 15% 470 brands assured of a domestic foothold, outsourcing will
also rise significantly.
Source: Alok Industries, Wazir Advisors, Handlooms.nic.in, Axis Securities Ltd.
2111 Jan 2017 Thematic Report
Raw material availability Sector: Textile
World cotton production ( mn bales) India is the largest producer of cotton with a share of
26.5% of the world cotton production. China ranks second
140
with a share of 24%. The production of cotton in
120
Bangladesh and Vietnam is miniscule and both rely on
100
80
imports of cotton to fulfill their demand for textile and
60 apparel sector.
40
20
India is the second largest exporter of cotton after USA.
0 China with its huge domestic demand is left with limited
quantities for export while Bangladesh and Vietnam with
2012/13 2013/14 2014/15 2015/16
limited cotton production are not exporting cotton at all.
India China United States Pakistan Brazil Others
China is the world’s largest cotton importer. However, it is
currently not adding to its stock position and therefore
World cotton consumption ( mn metric tons) imports have dropped significantly. Vietnam is the second
30 largest cotton importer and its imports have surged
25
significantly indicating strong yarn spinning capacity
growth.
20
15 In China, the area under cotton harvest has decreased by
10 30% over the last 3 years. Cotton productivity in China is
5 almost 3 times that of India.
0
Abundant availability of raw materials such as
2012/13 2013/14 2014/15 2015/16 cotton, wool, silk, jute and skilled workforce have made
India a sourcing hub. It is the world's second largest
China India Pakistan Turkey Bangladesh Others
producer of textiles and garments.
Source: Cotton inc, Axis Securities Ltd.
22Indian textile business overview
11 Jan 2017                Thematic Report

  Indian Textile Market                                                                                                                          Sector: Textile

                                                                                    Total market size (FY16)
                                                                                           US$ 137 billion

                                               Domestic consumption                                                                      Exports
                                                    US$ 97 bn.                                                                        US$ 40 bn.

                                       Household
                                                                  Tech. textiles                                           Textiles                       Apparel
                                      consumption
                                                                  US$ 14 bn.                                           US$ 23 bn.                   US$ 17 bn.
                                       US$ 83 bn.
Source: Handlooms.nic.in Textile Ministry, Axis Securities

Growth pattern of domestic market                                                                 Growth pattern of Indian T&A exports
                                                                                      68
                                             12%                        63                                                                           8.6%                                       40
                                                             57                                                                                                            35.8 36.1 35.4
                                            50                                        13                                                                   29.4 29.1
                            44                                          14            5
                39                                           13         4                                                     22 20.6 23.9

                                                                                                    USD bn
                                            11               4                                                      19.5 19.7
                            10
  USD bn

                     9                      4                                                                16.1
                                 3
           3                                                                          50
                                                             40         45
                            31              35
                27

                                                                                                             2005

                                                                                                                    2006

                                                                                                                           2007

                                                                                                                                  2008

                                                                                                                                          2009

                                                                                                                                                   2010

                                                                                                                                                            2011

                                                                                                                                                                    2012

                                                                                                                                                                           2013

                                                                                                                                                                                  2014

                                                                                                                                                                                         2015

                                                                                                                                                                                                2016
               2008       2009              2010        2011           2012         2013

                Technical Textiles          Home Textiles          Apparel         Total
Source: Textile Ministry, Axis Securities                                                           Source: Himatsingka, Handlooms.nic.in, Axis Securities

                                                                                                                                                                                                   24
11 Jan 2017 Thematic Report
Textiles Value Additions Through Supply Chain Sector: Textile
Fully integrated companies to benefit more
Cotton Fiber Yarn Grey Fabric Processed Fabric Garment Retailing
1.20 kg 0.84 KG 2.67 meter 2.40 meter 2 Trousers
Rs. 90/ KG Rs 200/ KG Rs. 80/m Rs 145/m (FOB)
US$ 1.66 US$ 2.58 US$ 3.28 US$ 5.35 US$ 13.00
To sell finished garment rather than raw material is always better for an exporter. If 1 kg of yarn is processed and sold as
finished garment, it generates ~four times more revenue. If 1 kg of cotton fibre is sold as finished garment, it generates 6-8
times more revenue. India exports USD 9 billion/annum of raw cotton fibre and yarn to China, which it uses in making
garments and then exports to other countries. So China’s ~USD 20 - 24 Bn exports comes with the help of India.
Source: Vardhman Textiles Ltd.
Yarn: 30 combed yarn Fabric: Twirl bottom weight fabric Exchange Rate: Rs 65/$
Presence of our picks in the value chain
Yarn Fabric Apparel Retail
Ambika cotton
Siyaram silk mills
KPR Mill
2511 Jan 2017 Thematic Report
Indian Textile Market Sector: Textile
Industry on a higher growth trajectory Contribution of textiles and apparels in 2014 T&A export
500 470
450
400
350
300
USD Bn
40%
250 60%
200
150 137
89 99
100 70 78
50
0 Textiles apparels
2009 2010 2011 2014 2016 2025E
Source: IBEF, Alok Industries. Source: Himatsingka annual report
Indian textile industry is likely to grow at a CAGR of 14.7% over 2016-2025E v/s 10.1% CAGR over 2009-2016
India is second largest exporter of textiles and apparel in the world.
In 2014, textiles contributed 60% in T&A export while remaining 40% was contributed by apparels
2611 Jan 2017 Thematic Report
Key global markets for Indian Textile & apparel products Sector: Textile
Key market for Indian textile export (2014-2015) Indian Textile Industry - Strengths
Constitute 14% of Global production of textile fibres and
19%
yarn
44%
10% Largest producer and 2nd largest consumer & exporter of
5%
cotton
7%
25% market share in Global cotton yarn exports
7%
3% 5% The second biggest exporter of textile & apparel
USA UAE UK China Cost effective manufacturing facilities (Indian spinning
Bangladesh Germany France Others
sector most efficient in the world)
Key T&A importers for India ( 2014- 15) Break up of India’s Textile exports ( 2013 - 14)
Made
Others, 6%
ups, 12%
33% 44%
Fibre, 12% Apparel, 40%
3% 5% 5%
Yarn, 18%
3%
3% 4% Fabric, 12%
China Bangladesh USA
Australia Taiwan Korea Apparel Yarn Fabric Fibre Made ups Others
Thailand Others
Source: Textile Ministry , Axis Securities Source: Textile ministry, Axis securities
27Our picks
11 Jan 2017 Thematic Report
KPR Mill Ltd
KPR Mill Ltd Sector: Textile
KPR Mill, a vertically integrated apparel manufacturing company has a cumulative capacity of
Stock Data
3,53,568 spindles to produce 90,000 MT of yarn/annum , knitting facility of 27,000 MT of fabrics
CMP (10 Jan 2017) Rs 573 /annum and garmenting facility to produce 95 mn pieces of readymade knitted apparel per annum.
KPR also owns 9000 MT embedded fabric processing unit, 61.9 MW wind based power generation
No. of shares 7.53 Cr
capacity and sugar power plant having capacity of 5,000 TCD with 30 MW co-gen plant.
Market cap (Rs) 4314 Cr
Investment Rationale
52 week high/low (Rs) 637/ 310 Vertical integration to increase competitiveness: KPR Mill is a vertically integrated company having presence from
manufacturing yarn to garments leading to better margins. The captive consumption of yarn is likely to increase from
Avg. daily vol. (6 mths) 62274
current consumption of 35-40% to 60% in next 2-3 years which will drive the margins.
Bloomberg code KPR IN
Capacity expansion to capture growing demand: Growth trend in Knitwear sector is expected to continue for a long
Reuters code KPRM.BO term. Encouraging demand from the existing Buyers and enquiries from new markets, the company has set up a Green
field manufacturing facility of 36 Million garments per annum at a cost of Rs.175 Crores in Thekkalur, Tirupur. The
Price Performance company is also expanding its dyeing capacity from current level of 9000 MT to 18000 MT. The company is targeting
170 for a revenue of Rs 1000 Cr from garment business.
150
130
Value addition in yarn to improve profitability: The company has converted its conventional yarn capacity to value
110 added yarn, carrying premium prices resulting in better margins than the conventional yarn by ~2%. Value added
90
yarn consists compact, melange and colour melange yarn.
70
50
Dec-15 Apr-16 Aug-16 Dec-16
Financial Summary (Consolidated)
K P R Mill Ltd BSE_SENSEX
Sales PAT EPS* Change PE RoE RoCE DPS *
Source: Axis Securities Ltd, Capitaline. Y/E March
(Rs cr) (Rs Cr) (Rs) (%) (x) (%) (%) (Rs)
FY14 2371 142 18.8 37.5 - 18.3 12.8 3.5
FY15 2566 174 23.0 22.5 - 19.4 13.7 4.5
FY16 2591 210 27.9 21.1 20.5 20.2 13.5 5.0
• Source: Axis Securities Ltd, Capitaline.
• *: Adjusted for stock split
2911 Jan 2017 Thematic Report
KPR Mill Ltd
KPR Mill Ltd
Investment Rationale (Cont’d)
To secure power supply, KPR Mill acquired sugar Mill: In 2012-13, to secure uninterrupted and cheap power supply, the company
acquired a sugar company in Karnataka which had a co-gen power capacity of 30 MW. The company receives 10 crore units of power
from sugar mill at a cost of Rs 2.5-3/unit (including bagasse) which results in an annual saving of ~ Rs 40 Cr in power cost for the
company. Sugar business of the company is debt free.
Key milestones: Moving towards value added products
1984 – Started business at Coimbatore
1995•– Export of knitted garments
1995-1999 – Set up spinning capacity of 30240 spindles • 16128 spindles for Melange Yarn
• Co-gen (30 MW) cum sugar plant (5000 TCD)
Increased spinning capacity to 212064 spindles • 2015-16 – Established 36 mn pieces garment capacity
Set up knitting facility, garment and wind mills • 2016-17 – Doubling processing capacity
1984-1999 2000-05 2008 -11 2012 -13 2014- 15 2015- 17
Fabric processing unit with capacity of 9000 MT • 2014 – Expended 10 mn pcs garment capacity at Arasur
103680 spindles capacity (compact) and wind mills • 2015 – 12 mn pcs garment capacity at Thekkalur
3011 Jan 2017 Thematic Report
KPR Mill Ltd
KPR Mill Ltd Sector: Textile
Investment Rationale (Cont’d)
Sugar inventory to add value due to favorable sugar prices: The company has a sugar inventory of 37000 metric ton at
the end of Q2FY17. The rising trend in sugar prices is expected to sustain in FY17 which will generate a good cash
flow for the company.
Supplying to marquee clients: The company has relationship with about 1,200 regular domestic clients for yarn &
fabric and around 50 leading international brands for garments. Its garment business is 100% export oriented with
major revenue coming from Europe. In garment business, around 50% revenues come from top 10 clients while in yarn
and fabric business, the sales is fragmented and single client don’t contribute more than 1-2% of overall revenue of
yarn and fabric segment.
Plans to be debt free: Management targets to make KPR Mill debt free in next three years. Increased earnings from
textile business will be used in retiring the debt of the company.
Capex: Capex is an ongoing process and company will keep increasing its capacities of yarn and garments business
gradually. But for next 1-2 years, it doesn’t has any plan for capacity expansion. The maintenance capex of the
company is ~Rs 50 Cr/annum. After 2-3 years, it can go for a capex of Rs 100 Cr for spinning business and Rs 200
Cr for garments’ capacity expansion.
Jahnvi Motor private Ltd: The company is the business of selling Audi cars (dealership of Audi). It sold 271 Audi cars in
FY16 and generated revenues of Rs 131.6 Cr. The margins in the business are 9-10% which are lower than the
margins of textile business. On overall basis, Audi dealership adversely impacts the margins of the company.
3111 Jan 2017 Thematic Report
KPR Mill Ltd
KPR Mill Ltd Sector: Textile
Segmental Revenue Break-up - Contribution of higher margin garments segment is on rise
YE March FY14 FY15 FY16 H1FY17
Yarn & Fabric 63.8% 59.8% 59.0% 57.2%
Garments 16.5% 20.5% 23.7% 24.6%
Sugar 10.2% 11.3% 8.4% 10.6%
Others 9.5% 8.4% 8.9% 7.6%
Geography wise revenue break up
80%
71.1%
70% 67.4%
63.3%
60%
50%
40%
30%
17.2% 17.6%
20% 14.9% 14.8%
11.8% 11.5%
10% 3.7% 3.5%
2.3% 0.8%
0.0% 0.1%
0%
FY14 FY15 FY16
Asia Europe USA Others India
3211 Jan 2017 Thematic Report
KPR Mill Ltd
KPR Mill Ltd Sector: Textile
Profit & Loss A/c (Consolidated) (Rs Cr) Balance sheet (Rs Cr)
YE March (Rs. Cr) FY12 FY13 FY14 FY15 FY16 YE March (Rs. Cr) FY12 FY13 FY14 FY15 FY16
Net Sales 1269 1665 2371 2566 2591 Share Capital 56 53 53 53 38
Reserves Total 575 654 762 893 1,057
Other Income 7 6 31 24 23 Total Shareholders Funds 631 706 815 945 1,094
Stock Adjustments -51 185 2 23 14 Total Debt 799 1,008 962 824 887
Total Income 1225 1855 2404 2613 2628 Other Liabilities
171 147 - 55 54
Total Liabilities 1,601 1,862 1,777 1,824 2,035
Raw Materials 842 1146 1589 1697 1598
Power & Fuel Cost 36 65 71 108 129 APPLICATION OF FUNDS :
Gross Block 1,551 1,951 2,020 2,122 2,220
Employee Cost 83 117 151 183 218
Less: Accumulated Depreciation 460 612 764 915 1,063
Other Manufacturing Expenses 43 88 75 95 118 Net Block 1,091 1,339 1,256 1,206 1,157
Selling and Administration Expenses 27 42 56 62 67 Capital Work in Progress
75 - 6 2 35
Miscellaneous Expenses 8 5 9 7 7 Investments - 66 63 61 2
Inventories 187 358 405 516 506
Total Expenditure 1038 1462 1951 2152 2135
Sundry Debtors 137 159 238 282 425
EBIDTA 187 393 453 461 493 Cash and Bank 59 76 99 40 46
Loans and Advances 79 60 87 65 107
Interest 48 98 105 84 57
Total Current Assets 462 652 829 903 1,083
Depreciation 104 151 157 154 152 Current Liabilities 47 148 309 310 283
Profit Before Tax 35 144 192 223 283 Provisions 24 18 19 37 19
Total Current Liabilities 71 166 328 348 302
Tax -3 26 53 50 74 Net Current Assets 391 486 502 556 781
Deferred Tax 5 15 -2 0 -1 Net Deferred Tax -47 -62 -60 -60 -59
Other Assets 91 32 11 58 120
Net Profit 33 103 142 174 210 Total Assets 1,601 1,862 1,777 1,824 2,035
Source: Axis Securities Ltd, Capitaline.
3311 Jan 2017 Thematic Report
KPR Mill Ltd
KPR Mill Ltd Sector: Textile
Key ratios (%) Quarterly financials (Rs Cr)
Q4 Q1F Q2 Q3 Q4 Q1 Q2
YE March FY13 FY14 FY15 FY16 YE March (Rs. Cr)
FY15 Y16 FY16 FY16 FY16 FY17 FY17
Raw Material / Sales (%) 57.6% 63.5% 61.7% 55.4%
Net Sales 655.3 603.4 587.3 619.5 693.4 638.8 734
Other Income/EBT(%) 4.0% 16.2% 10.8% 8.1%
Other Operating
EBITDA Margin (%) 23.3% 17.8% 17.0% 18.1% 21.5 23.1 20.6 20.5 26.6 27.2 21
Income
Tax / PBT (%) 28.5% 26.2% 22.3% 25.8%
Other Income 6.3 6.4 4.7 5.3 6.8 6.8 7.5
Net Profit Margin (%) 6.2% 6.0% 6.8% 8.1%
RoE (%) 28.3% 18.3% 19.4% 20.2% Total Income 683 632.8 612.5 645.3 726.8 672.8 762.9
RoCE (%) 20.4% 12.8% 13.7% 13.5%
Total Expenditure 570.2 504.1 486.7 524.2 609.7 534.4 600.6
Debt/ Equity (x) 1.3 1.0 0.8 0.7
Interest Coverage (x) 4.0 4.0 5.2 8.2
EBIDTA 112.8 128.7 125.8 121 117.1 138.4 162.3
Interest / Debt (%) 21.7% 11.9% 10.6% 7.4%
Growth in Gross Block (%) - 3.5% 5.1% 4.6% Interest 21.3 18.2 14.5 11.9 12.8 20.2 16.6
Sales Growth (%) - 42.4% 8.2% 1.0%
PBDT 91.5 110.5 111.3 109.2 104.2 118.2 145.7
EBITDA Growth (%) - 9.0% 3.6% 7.4%
Net Profit Growth (%) - 37.5% 22.5% 21.1% Depreciation 36.9 37.6 38.6 38.6 37.3 37.2 37.6
Debtors (Days of net sales) 35 36 40 60
PBT 54.6 73 72.8 70.6 66.9 81 108.1
Creditors (Days of Raw Materials) 33 52 48 44
Inventory (Days of Optg. Costs) 102 76 89 87 Tax 4.5 22.5 20.6 17.6 12.4 18.1 26.9
Current Ratio (x) 1.6 1.9 1.9 2.8
Net Current Assets/Capital Employed (%) 15.9% 23.1% 26.5% 39.4%
PAT 50.1 50.5 52.2 53 54.5 62.9 81.2
Source: Axis Securities Ltd, Capitaline.
3411 Jan 2017 Thematic Report
Siyaram Silk Mills Ltd
Siyaram Silk Mills Ltd Sector: Textile
Siyaram Silk Mills Ltd. is an integrated textile manufacturer with a domestic focus mainly in tier II and
Stock Data
Tier III cities. Over the past few years, Siyaram is strategically transforming itself from a textile
CMP (10 Jan 2017) Rs 1400 manufacturer to a garmenting and brand house with portfolio of brands such as Oxemberg, J.
Hampstead, Mistair, MSD, Royal Linen, Moretti etc. Also in FY14, Siyaram entered the ladies’ salwar
No. of shares 0.937 Cr
kameez and ethnic wear segment with the brand Siya.
Market cap (Rs) 1312 Cr
Investment Rationale
52 week high/low (Rs) 1690/ 925
A strong bouquet of brands coupled with entry into ladies ethnic wear: In the Fabric Space, it has Brands like
Avg. daily vol. (6 mths) 5490 Siyaram’s, J.Hampstead, Mistair. In the readymade space, it has brands like Oxemberg, MSD and in the premium
Bloomberg code SIYA.IN ready to wear space, it has J.Hampstead and Cadini (Italian brand). Other key brands in the company’s portfolio
Reuters code SIYR.BO include Oxemberg, MSD, etc, which has a strong presence in value brands category. Siyaram entered the ladies’
salwar kameez and ethnic wear segment with the brand Siya in FY14.
Price Performance
160
Focus on franchise based asset light model for retailing of brands: The company has a network on around 250
140 franchise stores and plans to expand to 500 stores over next two to three years. The company has 1600 dealers and
120
presence in around 3 lakh multi brand outlets.
100
80 The company is aggressively monetizing its brands through high-margin RMG business, which has helped to improve its
60
EBITDA margin and ROCEs from 8% and 6% in FY09 to 12% and 18%, respectively in FY15
Dec-15 Apr-16 Aug-16 Dec-16
Siyaram Silk BSE_SENSEX Financial Summary
Source: Axis Securities Ltd, Capitaline.
Sales PAT EPS Change PE RoE RoCE DPS
Y/E March
(Rs cr) (Rs Cr) (Rs) (%) (x) (%) (%) (Rs)
FY14 1610 67.1 66.5 - - 19 18.6 8
FY15 1902 77.9 82.0 23.3% - 20 19.6 10
FY16 2078 89.3 91.2 11.2% 15.4 19 18.5 11
* CMP Source: Axis Securities Ltd, Capitaline.
3511 Jan 2017 Thematic Report
Siyaram Silk Mills Ltd
Siyaram Silk Mills Ltd Sector: Textile
Investment Rationale (Cont’d)
Manufacturing capacity: The company is one of the major producer of polyester viscose blended fabrics with
manufacturing facilities to produce 68 million meters fabric/annum, 3.6 million kg of dyed yarn and 4.3 million nos of
garments.
Garment segment to drive growth: Revenue of the company has grown at a CAGR of 16.7 % over FY12- FY16 with
earnings growth of 12.6% over the same period.
3611 Jan 2017 Thematic Report
Siyaram Silk Mills Ltd
Siyaram Silk Mills Ltd Sector: Textile
Profit & Loss A/c (Rs Cr) Balance sheet (Rs Cr)
YE March (Rs. Cr) FY12 FY13 FY14 FY15 FY16 YE March (Rs. Cr) FY12 FY13 FY14 FY15 FY16
Net Sales 1,112 1,292 1,610 1,902 2,077 Share Capital 9 9 9 9 9
Reserves Total 258 305 360 426 501
Other Income 11 19 16 16 17
Total Shareholders Funds 267 314 370 435 511
Stock Adjustments 27 18 2 5 70 Secured Loans 155 208 258 231 212
Total Income 1,150 1,329 1,628 1,923 2,164 Unsecured Loans 83 71 56 79 184
Total Debt 237 278 314 309 396
Raw Materials 487 550 674 799 880
Other Liabilities 27 28 31 38 44
Power & Fuel Cost 17 20 28 30 32 Total Liabilities 531 620 715 782 951
Employee Cost 63 89 108 123 144 APPLICATION OF FUNDS :
Other Manufacturing Expenses 158 169 203 217 248 Gross Block 403 499 570 589 648
Selling and Administration Expenses 285 354 436 543 632 Less : Accumulated Depreciation 173 194 220 258 296
Net Block 230 305 349 332 353
Miscellaneous Expenses 13 18 24 20 23
Capital Work in Progress 15 16 3 7 4
Total Expenditure 1,022 1,200 1,472 1,732 1,960 Investments 3 0 0 0 46
EBIDTA 128 129 156 190 205 Inventories 188 222 225 238 326
Sundry Debtors 177 200 260 335 361
Interest 24 25 29 31 31
Cash and Bank 2 3 6 5 6
Depreciation 22 22 29 41 42 Loans and Advances 78 33 39 48 58
Profit Before Tax 81 82 98 119 133 Total Current Assets 445 458 531 626 751
Current Liabilities 104 139 149 166 202
Tax 26 24 31 43 44
Provisions 62 10 10 13 2
Deferred Tax -1 3 3 -3 1 Total Current Liabilities 166 149 159 180 204
Reported Net Profit 57 55 64 79 88 Net Current Assets 279 310 371 447 547
Net Deferred Tax -16 -19 -22 -19 -20
Extraordinary Items 1 0 -4 1 -2
Other Assets 20 8 13 15 21
APAT 56 55 67 78 89 Total Assets 531 620 715 782 951
Source: Axis Securities Ltd, Capitaline.
3711 Jan 2017 Thematic Report
Siyaram Silk Mills Ltd
Siyaram Silk Mills Ltd Sector: Textile
Key ratios (%) Quarterly financials (Rs Cr)
FY12 FY13 FY14 FY15 FY16
YE March (Rs. Cr) Q1FY16 Q2FY16 Q3FY16 Q4FY16 Q1FY17 Q2FY17
Debt-Equity Ratio 1.03 0.89 0.87 0.77 0.75
Long Term Debt-Equity Ratio 0.31 0.31 0.27 0.18 0.11 Net Sales 297 397.4 415.4 504.1 280.4 421.1
Current Ratio 1.21 1.32 1.31 1.34 1.35 Other Operating
0.5 0.6 0.3 0.8 0.9 0.6
Income
Turnover Ratios Other Income 4.4 3.8 4.7 4.2 5.6 7.2
Fixed Assets 2.84 2.88 3.01 3.28 3.36
Total Income 301.9 401.8 420.4 509.2 286.9 428.9
Inventory 6.66 6.34 7.2 8.21 7.36
Debtors 6.02 6.88 6.99 6.39 5.97 Total Expenditure 266.4 348.2 368.9 444.7 251.7 368.2
Total Asset Turnover Ratio 2.16 2.26 2.41 2.54 2.4
Interest Cover Ratio 4.38 4.25 4.41 4.89 5.35 EBIDTA 35.5 53.6 51.5 64.5 35.3 60.7
PBIDTM (%) 11.37 9.91 9.68 10.01 9.86
Interest 6.8 7.2 8.1 8.4 9 8.4
CPM (%) 7.05 5.91 5.76 6.29 6.22
APATM (%) 5.06 4.23 3.95 4.14 4.22 PBDT 28.7 46.4 43.4 56.1 26.3 52.3
ROCE (%) 20.26 18.58 18.99 19.97 18.84
Depreciation 9.7 10.8 10.5 10.6 10.9 11
RONW (%) 23.3 18.93 18.6 19.59 18.52
PBT / EBIT (X) 0.77 0.76 0.77 0.8 0.81 PBT 19 35.6 32.9 45.6 15.4 41.3
EBIT / Sales (X) 0.09 0.08 0.08 0.08 0.08
Tax 6.8 10.9 12.5 13.9 6.6 14.5
Sales / Assets (X) 2.14 2.25 2.41 2.54 2.4
Assets / Equity (X) 2.13 1.98 1.95 1.86 1.83 Deferred Tax -0.7 1.6 -0.4 -0.4 -1.2 -
ROE (X) 0.23 0.19 0.19 0.2 0.19
Market Cap/Sales 0.22 0.17 0.17 0.43 0.44 Reported PAT 12.9 23.1 20.9 32.1 10 26.8
Source: Axis Securities Ltd, Capitaline.
3811 Jan 2017 Thematic Report
Ambika Cotton Mills Ltd
Ambika Cotton Mills Ltd Sector: Textile
Ambika Cotton Mills Limited is engaged in manufacturing and selling specialty cotton yarn catering to
Stock Data
the needs of manufacturers of premium branded shirts and t-shirts. The company has installed 27.4 MW
CMP (10 Jan 2017) Rs 1044 wind power capacity for captive consumption of spinning segment. The Spinning Plants are located at
Kanniyapuram, Dindigul with a total capacity of 1,08,288 spindles and Windmills are located in
No. of shares 0.587 Cr
Tirunelveli, Dharapuram and Theni in the State of Tamilnadu.
Market cap (Rs) 613 Cr
Investment Rationale
52 week high/low (Rs) 1095/ 735 Focus on profitability: Ambika Cotton has not increased its capacity since FY07 but its earnings have improved from Rs
17.3 Cr in FY07 to Rs 44.5 Cr in FY16. The increased profitability was primarily on account of change in product mix
Avg. daily vol. (6 mths) 8531
driven by R&D.
Bloomberg code ACML IN Capacity expansion: The company is planning to enter into manufacturing of knitted fabric (only grey fabric). The
Reuters code AMBK BO
company has already invested Rs 8.5 Cr and another planned capex for grey colour knitted fabric manufacturing is Rs
35-40 Cr which is likely to be invested over next few months. Apart from that, the company is also expanding spinning
Price Performance capacity by 30000 spindles with an capex of around Rs 100 Cr. The planned capex is likely to be funded through
140 internal accruals.
120 Debt has reduced Y-o-Y: Given healthy cash flow of the company, debt of the company has reduced from Rs 152 Cr in
100
FY12 to Rs 20 Cr in FY16.
Planning for acquisition: Operating cash flow of the company in FY16 stood at Rs 67 Cr, which is likely to remain in
80
that range in coming two to three years. The strong cash flow generation will accumulate huge cash in the balance
60
sheet of the company. To utilize the cash, management is planning to acquire a company in related business and wants
Dec-15 Apr-16 Aug-16 Dec-16
to grow inorganically. Current capacities of the company are operating at 90-95% utilizations.
Ambika Cotton BSE_SENSEX Financial Summary
Source: Axis Securities Ltd, Capitaline. Sales PAT EPS Change PE RoE RoCE DPS
Y/E March
(Rs cr) (Rs Cr) (Rs) (%) (x) (%) (%) (Rs)
FY14 477 48 79.8 - - 20 21.5 12.5
FY15 495 51 84.3 5.6% - 18.2 19.6 14
FY16 492 43.2 73.6 (12.7%) 14.2 14 18.0 15
* CMP Source: Axis Securities Ltd, Capitaline.
3911 Jan 2017 Thematic Report
Ambika Cotton Mills Ltd
Ambika Cotton Mills Ltd Sector: Textile
Investment Rationale (Cont’d)
Specialized yarn: The company is engaged in manufacturing specialized yarn having average realization of Rs.400 –
450/ Kg V/s average realization of Rs. 250 per Kg for normal yarn. The company is actively engaged in R&D and
innovation which helps in making specialty yarn from superior cotton. The company's primary focus is to improve
EBIDTA/spindle which is on the higher side in comparison to its peers. The yarn produced by the company is supplied
to selected customers which are focused on quality products. Around 60% revenues comes from export business.
Concern
Huge dependency on imported raw material such as Giza and Pima cotton from Egypt and US respectively. Availability
of quality raw material at right price can create concern for the company.
Inability to pass on the increased raw material cost to customers can impact the margins. Also competition exists from
Chinese and Hong Kong players.
Demand slowdown in European countries
Product mix coupled with volume growth are key for the future growth of the company. But the company’s focus is on
product mix having high margin and not on volume growth. So after a point, saturation can lead to adverse impact on
the earnings of the company. We feel that the company is facing the similar situation since last two years.
4011 Jan 2017 Thematic Report
Ambika Cotton Mills Ltd
Ambika Cotton Mills Ltd Sector: Textile
Profit & Loss A/c (Rs Cr) Balance sheet (Rs Cr)
YE March (Rs. Cr) FY12 FY13 FY14 FY15 FY16 YE March (Rs. Cr) FY12 FY13 FY14 FY15 FY16
Share Capital 6 6 6 6 6
Net Sales 389 399 477 495 492
Reserves Total 190 215 254 295 329
Other Income 0.7 0.3 0.2 0.6 1.8 Total Shareholders Funds 196 220 260 301 335
Stock Adjustments 0.2 3.1 8.4 -10.9 4.5 Secured Loans 121 94 100 63 20
Unsecured Loans 31 - - - -
Total Income 390 401 486 485 499
Raw Materials 238 238 286 294 306 Total Debt 152 94 100 63 20
Power & Fuel Cost 14 21 26 25 33 Total Liabilities 348 314 360 364 355
Gross Block 457 466 484 494 507
Employee Cost 20 21 24 24 25
Less : Accumulated Depreciation 147 174 195 224 252
Other Manufacturing Expenses 8 15 12 12 12 Net Block 310 291 289 270 255
Selling and Administration Expenses 19 14 24 26 26
Inventories 83 92 133 145 124
Miscellaneous Expenses 13 5 10 3 2 Sundry Debtors 11 7 6 6 19
Total Expenditure 311 314 381 385 404 Cash and Bank 2 2 3 3 5
EBIDTA 79 88 104 100 95 Loans and Advances 15 20 15 15 17
Total Current Assets 110 121 156 169 165
Interest 20 19 13 7 6
Current Liabilities 39 56 44 35 32
Depreciation 27 27 32 29 30 Provisions 3 7 10 10 0
Profit Before Tax 32 41 60 64 59 Total Current Liabilities 42 64 53 45 32
Net Current Assets 68 57 103 124 133
Tax 8 13 15 13 18
Deferred Tax Liability 48 45 41 41 37
Deferred Tax 0 -3 -4 0 -4 Net Deferred Tax -48 -45 -41 -41 -37
Reported Net Profit 24 31 48 51 45
Other Assets 18 10 9 11 4
Adjusted PAT 24 31 48 51 43 Total Assets 348 314 360 364 355
Source: Axis Securities Ltd, Capitaline.
4111 Jan 2017 Thematic Report
Ambika Cotton Mills Ltd
Ambika Cotton Mills Ltd Sector: Textile
Key ratios (%) Quarterly Financials
FY12 FY13 FY14 FY15 FY16 YE March (Rs. Cr) Q1FY16 Q2FY16 Q3FY16 Q4FY16 Q1FY17 Q2FY17
Debt-Equity Ratio 1.1 0.6 0.4 0.3 0.1 Net Sales 121.7 121.1 122.2 118.4 123.6 130.5
Long Term Debt-Equity Ratio 0.6 0.4 0.2 0.1 0.0
Other Operating Income 2.5 2.3 2.1 2.0 2.0 2.5
Current Ratio 0.8 0.8 0.9 1.1 1.4
Turnover Ratios Other Income 0.1 0.1 0.1 1.5 0.1 0.22
Fixed Assets 0.9 0.9 1.0 1.0 1.0
Total Income 124.3 123.5 124.4 121.9 125.6 133.2
Inventory 3.3 4.6 4.2 3.6 3.7
Total Expenditure 99.4 100.7 101.3 98.6 100.2 106.2
Debtors 24.6 46.6 78.0 84.4 40.1
Total Asset Turnover Ratio 1.0 1.2 1.4 1.4 1.4 EBIDTA 24.9 22.8 23.1 23.4 25.4 27.0
Interest Cover Ratio 2.6 3.1 5.6 9.9 11.0
Interest 1.5 1.2 1.1 1.5 1.4 1.1
PBIDTM (%) 20.3 22.0 21.8 20.3 19.3
PBITM (%) 13.4 15.1 15.2 14.3 13.2 PBDT 23.4 21.6 22.0 21.9 24.0 25.9
APATM (%) 6.1 7.8 10.1 10.3 9.0
Depreciation 7.4 7.5 7.5 7.6 7.2 7.2
ROCE (%) 13.3 18.1 21.5 19.6 18.0
PBT 16.0 14.1 14.5 14.3 16.8 18.7
RONW (%) 12.9 14.9 20.0 18.2 14.0
Payout (%) 12.6 18.6 15.7 16.6 20.7 Tax 4.1 3.7 3.2 7.1 5.2 4.5
Sales / Assets (X) 1.0 1.2 1.4 1.4 1.4
Deferred Tax -0.1 -0.1 0.0 -3.4 -0.9 -0.7
Assets / Equity (X) 2.1 1.6 1.4 1.3 1.1
Market Cap/Sales 0.2 0.3 0.4 0.9 1.0 Reported PAT 12.1 10.6 11.3 10.5 12.5 14.8
Source: Axis Securities Ltd, Capitaline.
42Annexure
11 Jan 2017 Thematic Report
Trans – Pacific Partnership (TPP): Unfavorable to India Sector: Textile
Trans-Pacific Partnership (TPP)
TPP is a free trade agreement being negotiated between 12 member states which are the
US, Japan, Malaysia, Vietnam, Singapore, Brunei, Australia, New Zealand, Canada, Mexico, Chile and Peru.
Textile makers are shifting upstream processes to other countries before the TPP is ratified by its member nations. China is not
among those countries.
TPP countries will not be able to benefit from eliminated tariffs if they source material imported from nonmember countries. This is
one reason China's textile industry is in flux.
The TPP marks the first FTA (free trade agreement) for the United States Since the complete end of quotas on textile and apparel
trade in 2005. Duty - free access to the U.S. market under TPP could be of considerable benefit to Asian manufacturers, which
now face U.S. import duties on textiles and apparel of up to 32 %. It also could change the competitive position of Western
Hemisphere apparel suppliers in the U.S. market.
Zero duty access from a country to a major market is an important reason for relocation of manufacturing base to that country.
Countries such as Bangladesh, Turkey, Cambodia, etc. have successfully developed textile and apparel sectors leveraging their
duty free status to EU or USA which are the largest consumption bases.
Among the Asian countries in the proposed TPP, Vietnam is the only one with significant apparel trade with the United States.
4411 Jan 2017 Thematic Report
Disclaimer Sector: Textile
Disclosures:
The following Disclosures are being made in compliance with the SEBI Research Analyst Regulations 2014 (herein after referred to as the Regulations).
1. Axis Securities Ltd. (ASL) is a SEBI Registered Research Analyst having registration no. INH000000297. ASL, the Research Entity (RE) as defined in the Regulations, is engaged in the business of
providing Stock broking services, Depository participant services & distribution of various financial products. ASL is a subsidiary company of Axis Bank Ltd. Axis Bank Ltd. is a listed public
company and one of India’s largest private sector bank and has its various subsidiaries engaged in businesses of Asset management, NBFC, Merchant Banking, Trusteeship, Venture
Capital, Stock Broking, the details in respect of which are available on www.axisbank.com.
2. ASL is registered with the Securities & Exchange Board of India (SEBI) for its stock broking & Depository participant business activities and with the Association of Mutual Funds of India (AMFI) for
distribution of financial products and also registered with IRDA as a corporate agent for insurance business activity.
3. ASL has no material adverse disciplinary history as on the date of publication of this report.
4. I/We, Akhand Pratap Singh – Sr Manager, Research, MBA (Finance), author/s and the name/s subscribed to this report, hereby certify that all of the views expressed in this research report
accurately reflect my/our views about the subject issuer(s) or securities. I/We (Research Analyst) also certify that no part of my/our compensation was, is, or will be directly or indirectly related to
the specific recommendation(s) or view(s) in this report. I/we or my/our relative or ASL does not have any financial interest in the subject company. Also I/we or my/our relative or ASL or its
Associates may have beneficial ownership of 1% or more in the subject company at the end of the month immediately preceding the date of publication of the Research Report. Since associates of
ASL are engaged in various financial service businesses, they might have financial interests or beneficial ownership in various companies including the subject company/companies mentioned in
this report. I/we or my/our relative or ASL or its associate does not have any material conflict of interest. I/we have not served as director / officer, etc. in the subject company.
Any holding in stock – No
5. ASL has not received any compensation from the subject company in the past twelve months. ASL has not been engaged in market making activity for the subject company.
6. In the last 12-month period ending on the last day of the month immediately preceding the date of publication of this research report, ASL or any of its associates may have:
i. Received compensation for investment banking, merchant banking or stock broking services or for any other services from the subject company of this research report and / or;
ii. Managed or co-managed public offering of the securities from the subject company of this research report and / or;
iii. Received compensation for products or services other than investment banking, merchant banking or stock broking services from the subject company of this research report;
ASL or any of its associates have not received compensation or other benefits from the subject company of this research report or any other third-party in connection with this report.
Term& Conditions:
This report has been prepared by ASL and is meant for sole use by the recipient and not for circulation. The report and information contained herein is strictly confidential and may not be altered in
any way, transmitted to, copied or distributed, in part or in whole, to any other person or to the media or reproduced in any form, without prior written consent of ASL. The report is based on the
facts, figures and information that are considered true, correct, reliable and accurate. The intent of this report is not recommendatory in nature. The information is obtained from publicly available
media or other sources believed to be reliable. Such information has not been independently verified and no guaranty, representation of warranty, express or implied, is made as to its
accuracy, completeness or correctness. All such information and opinions are subject to change without notice. The report is prepared solely for informational purpose and does not constitute an
offer document or solicitation of offer to buy or sell or subscribe for securities or other financial instruments for the clients. Though disseminated to all the customers simultaneously, not all customers
may receive this report at the same time. ASL will not treat recipients as customers by virtue of their receiving this report.11 Jan 2017 Thematic Report Disclaimer Sector: Textile Disclaimer: Nothing in this report constitutes investment, legal, accounting and tax advice or a representation that any investment or strategy is suitable or appropriate to the recipient’s specific circumstances. The securities and strategies discussed and opinions expressed, if any, in this report may not be suitable for all investors, who must make their own investment decisions, based on their own investment objectives, financial positions and needs of specific recipient. This report may not be taken in substitution for the exercise of independent judgment by any recipient. Each recipient of this report should make such investigations as it deems necessary to arrive at an independent evaluation of an investment in the securities of companies referred to in this report (including the merits and risks involved), and should consult its own advisors to determine the merits and risks of such an investment. Certain transactions, including those involving futures, options and other derivatives as well as non-investment grade securities involve substantial risk and are not suitable for all investors. ASL, its directors, analysts or employees do not take any responsibility, financial or otherwise, of the losses or the damages sustained due to the investments made or any action taken on basis of this report, including but not restricted to, fluctuation in the prices of shares and bonds, changes in the currency rates, diminution in the NAVs, reduction in the dividend or income, etc. Past performance is not necessarily a guide to future performance. Investors are advice necessarily a guide to future performance. Investors are advised to see Risk Disclosure Document to understand the risks associated before investing in the securities markets. Actual results may differ materially from those set forth in projections. Forward-looking statements are not predictions and may be subject to change without notice. ASL and its affiliated companies, their directors and employees may; (a) from time to time, have long or short position(s) in, and buy or sell the securities of the company(ies) mentioned herein or (b) be engaged in any other transaction involving such securities or earn brokerage or other compensation or act as a market maker in the financial instruments of the company(ies) discussed herein or act as an advisor or investment banker, lender/borrower to such company(ies) or may have any other potential conflict of interests with respect to any recommendation and other related information and opinions. Each of these entities functions as a separate, distinct and independent of each other. The recipient should take this into account before interpreting this document. ASL and / or its affiliates do and seek to do business including investment banking with companies covered in its research reports. As a result, the recipients of this report should be aware that ASL may have a potential conflict of interest that may affect the objectivity of this report. Compensation of Research Analysts is not based on any specific merchant banking, investment banking or brokerage service transactions. ASL may have issued other reports that are inconsistent with and reach different conclusion from the information presented in this report. Neither this report nor any copy of it may be taken or transmitted into the United State (to U.S. Persons), Canada, or Japan or distributed, directly or indirectly, in the United States or Canada or distributed or redistributed in Japan or to any resident thereof. If this report is inadvertently sent or has reached any individual in such country, especially, USA, the same may be ignored and brought to the attention of the sender. This report is not directed or intended for distribution to, or use by, any person or entity who is a citizen or resident of or located in any locality, state, country or other jurisdiction, where such distribution, publication, availability or use would be contrary to law, regulation or which would subject ASL to any registration or licensing requirement within such jurisdiction. The securities described herein may or may not be eligible for sale in all jurisdictions or to certain category of investors. The Disclosures of Interest Statement incorporated in this document is provided solely to enhance the transparency and should not be treated as endorsement of the views expressed in the report. The Company reserves the right to make modifications and alternations to this document as may be required from time to time without any prior notice. The views expressed are those of the analyst(s) and the Company may or may not subscribe to all the views expressed therein. Copyright in this document vests with Axis Securities Limited. Axis Securities Limited, Corporate office: Unit No. 2, Phoenix Market City, 15, LBS Road, Near Kamani Junction, Kurla (west), Mumbai-400070, Tel No. – 18002100808/022-61480808, Regd. off.- Axis House, 8th Floor, Wadia International Centre, Pandurang Budhkar Marg, Worli, Mumbai – 400 025. Compliance Officer: Anand Shaha, Email: compliance.officer@axisdirect.in, Tel No: 022-42671582.
You can also read