3Q19 Earnings Call Presentation - October 23, 2019
←
→
Page content transcription
If your browser does not render page correctly, please read the page content below
3Q19 Earnings Call Presentation
        October 23, 2019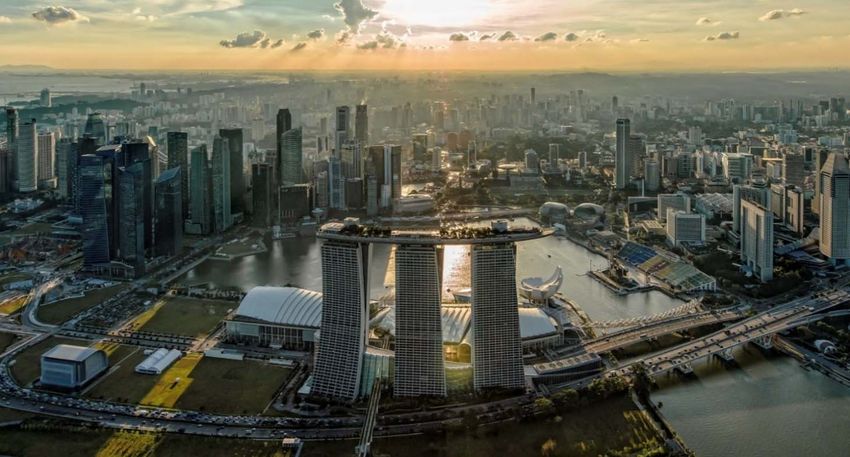
Forward Looking Statements
This presentation contains forward-looking statements made pursuant to the Safe Harbor Provisions of the Private
Securities Litigation Reform Act of 1995. Forward-looking statements involve a number of risks, uncertainties or other
factors beyond the company’s control, which may cause material differences in actual results, performance or other
expectations. These factors include, but are not limited to, general economic conditions, competition, new development,
construction and ventures, substantial leverage and debt service, fluctuations in currency exchange rates and interest
rates, government regulation, tax law changes and the impact of U.S. tax reform, legalization of gaming, natural or man-
made disasters, terrorist acts or war, outbreaks of infectious diseases, insurance, gaming promoters, risks relating to our
gaming licenses and subconcession, infrastructure in Macao, our subsidiaries’ ability to make distribution payments to us,
and other factors detailed in the reports filed by Las Vegas Sands with the Securities and Exchange Commission.
Readers are cautioned not to place undue reliance on these forward-looking statements, which speak only as of the date
thereof. Las Vegas Sands assumes no obligation to update such information.

Within this presentation, the company may make reference to certain non-GAAP financial measures including “adjusted
net income,” “adjusted earnings per diluted share,” and “consolidated adjusted property EBITDA,” which have directly
comparable financial measures presented in accordance with accounting principles generally accepted in the United
States of America ("GAAP"), along with “adjusted property EBITDA margin,” “hold-normalized adjusted property EBITDA,”
“hold-normalized adjusted property EBITDA margin,” “hold-normalized adjusted net income,” and “hold-normalized
adjusted earnings per diluted share,” as well as presenting these or other items on a constant currency basis. The specific
reasons why the company’s management believes the presentation of each of these non-GAAP financial measures
provides useful information to investors regarding Las Vegas Sands’ financial condition, results of operations and cash
flows, as well as reconciliations of the non-GAAP measures to the most directly comparable GAAP measures, are included
in the company’s Form 8-K dated October 23, 2019, which is available on the company’s website at www.sands.com.
Reconciliations also are available in the Reconciliation of Non-GAAP Measures and Other Financial Information section of
this presentation.

                                                                                                                              2
The Investment Case for Las Vegas Sands
The global leader in Integrated Resort development and operation
A unique MICE-based business model delivering industry-leading returns
Unmatched development and operating track record creates competitive advantage as we
pursue the world’s most promising Integrated Resort development opportunities
Proven history of delivering innovative growth in Asia
Industry-leading, investment grade balance sheet strength
Committed to maximizing shareholder returns
The industry’s most experienced leadership team: visionary, disciplined and dedicated to driving
long-term shareholder value
Maximizing Return to Shareholders by:
1. Delivering growth in current markets through investments in capacity expansion and strong
reinvestment in industry-leading property portfolio
2. Leveraging proven MICE-based Integrated Resort business model and balance sheet strength to
pursue global growth opportunities in new markets
3. Continuing to increase the return of capital to shareholders
3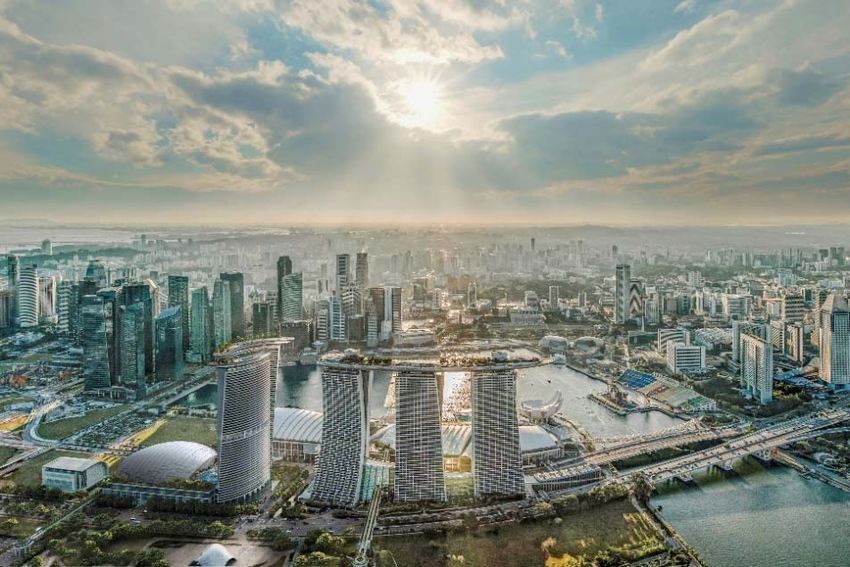
Third Quarter 2019 Highlights
Macao Property Portfolio:
− Mass market win grew 9.3% reaching a 3Q record $1.60 billion
− Delivered $755 million of Adjusted Property EBITDA
Marina Bay Sands:
− Delivered $435 million of Adjusted Property EBITDA ($387 million on a hold-normalized basis)
Las Vegas delivered $93 million of Adjusted Property EBITDA ($106 million on a hold-normalized basis)
The Company returned $691 million of capital to shareholders through $591 million of dividends ($0.77 per share) and
$100 million of repurchases (1.8 million shares at $54.90)
The LVS Board of Directors announced the increase of the LVS recurring dividend for the 2020 calendar year by $0.08 to
$3.16 per share ($0.79 per share payable quarterly)
Macao – Mass and Non-Gaming revenue growth…Implementing $2.2 billion investment program, featuring
expansion of premium suite capacity by ~two million SF, to drive future growth
Singapore – Delivered $435 million in Adjusted Property EBITDA…with $3.3 billion Marina Bay Sands
Expansion ahead to drive future growth
Pursuing New Development Opportunities while increasing Return of Capital to Shareholders
Note: The Company completed the sale of Sands Bethlehem on May 31, 2019.
4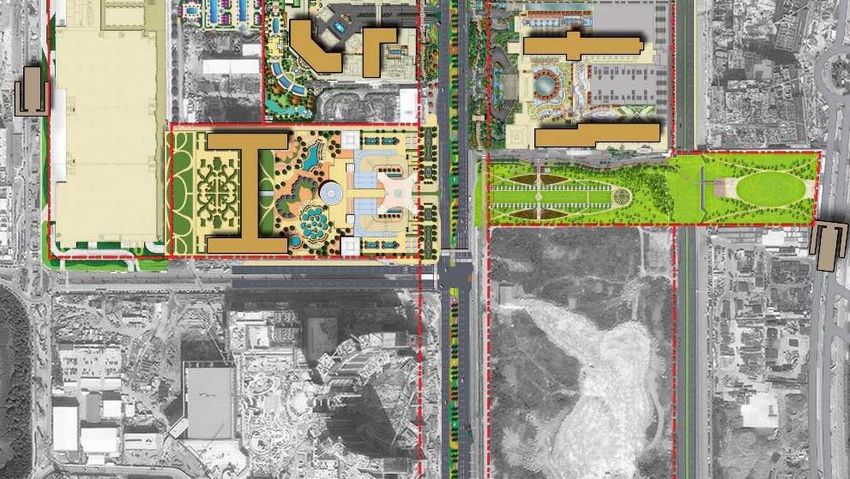
Geographically Diverse Sources of EBITDA
EBITDA Contribution by Geography in 3Q 2019
($ in US millions)

         LVS Consolidated Adjusted Property EBITDA1                                                                       LVS Consolidated Hold-Normalized Adj. Prop. EBITDA1

                                              $1,283M                                                                                                                   $1,248M

                 Las Vegas                                                                                                                Las Vegas
                    7%                                                                                                                       9%

                                                                                                                                                  Singapore
                        Singapore                                                                                                                    31%
                           34%
                                                                Macao                                                                                                                     Macao
                                                                 59%                                                                                                                       60%

1. The Macao region includes adjusted property EBITDA from The Venetian Macao, Sands Cotai Central, The Parisian Macao, The Plaza Macao and Four Seasons Hotel Macao, Sands Macao and Ferry Operations and Other. The Singapore region
   includes adjusted property EBITDA from Marina Bay Sands.

                                                                                                                                                                                                                                         5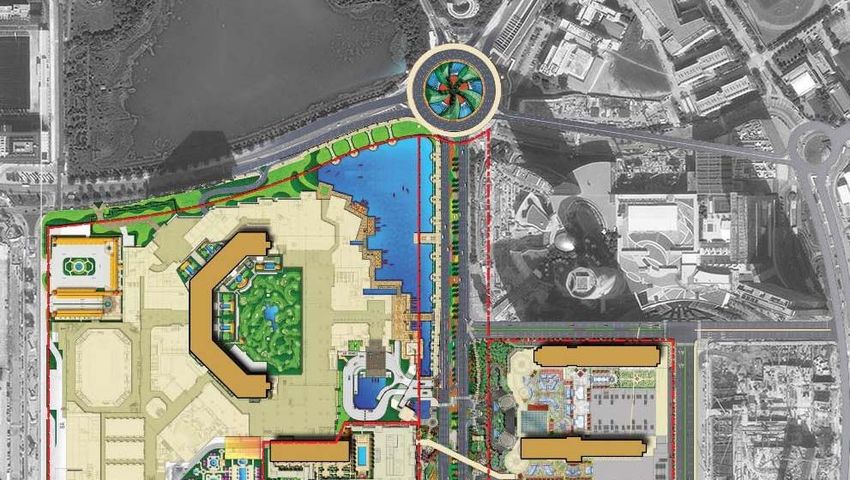
Geographically Diverse Sources of EBITDA
EBITDA Contribution by Geography in Trailing Twelve Months Ended September 30, 2019
($ in US millions)

                                                                        LVS Consolidated Adjusted Property EBITDA1

                                                                                                              $5,273M

                                                                                                     United
                                                                                                     States
                                                                                                      10%

                                                                                Singapore
                                                                                   30%
                                                                                                                                 Macao
                                                                                                                                  60%

1. The Macao region includes adjusted property EBITDA from The Venetian Macao, Sands Cotai Central, The Parisian Macao, The Plaza Macao and Four Seasons Hotel Macao, Sands Macao and Ferry Operations and Other. The Singapore region
   includes adjusted property EBITDA from Marina Bay Sands and the United States region includes adjusted property EBITDA from the Las Vegas Operating Properties and Sands Bethlehem.
Note: The Company completed the sale of Sands Bethlehem on May 31, 2019, and $76 million of Adjusted Property EBITDA generated by Sands Bethlehem is included in the United States segment above for the period from October 1, 2018 to the
sale on May 31, 2019.

                                                                                                                                                                                                                                              6
Third Quarter 2019 Financial Results
 Quarter Ended September 30, 2019 vs Quarter Ended September 30, 2018

   ($ in US millions, except per share information)
                                                                                                                 3Q18           3Q19          $ Change   % Change

   Net Revenue                                                                                                  $3,372         $3,250          ($122)      -3.6%
                                                                                                                         (1)            (2)
   Net Income                                                                                                    $699           $669            ($30)      -4.3%
   Adjusted Net Income Attributable to LVS                                                                       $604           $573            ($31)      -5.1%
   Adjusted Property EBITDA                                                                                     $1,282         $1,283             $1       0.1%
   Adjusted Property EBITDA Margin                                                                               38.0%          39.5%                     150 bps
                                                                                                                         (3)            (4)
   Diluted EPS                                                                                                   $0.73          $0.69          ($0.04)     -5.5%
   Adjusted Diluted EPS                                                                                          $0.77          $0.75          ($0.02)     -2.6%
   Dividends per Common Share                                                                                    $0.75          $0.77          $0.02       2.7%
   Hold-Normalized :
          Adjusted Property EBITDA                                                                              $1,287         $1,248           ($39)      -3.0%
          Adjusted Property EBITDA Margin                                                                        38.1%          38.9%                     80 bps
          Adjusted Diluted EPS                                                                                   $0.77          $0.71          ($0.06)     -7.8%

1. Includes $52 million loss on modification or early retirement of debt.
2. Includes $24 million loss on modification or early retirement of debt.
3. Includes approximately $0.06 per share impact related to loss on modification or early retirement of debt.
4. Includes approximately $0.03 per share impact related to loss on modification or early retirement of debt.
Note: The Company completed the sale of Sands Bethlehem on May 31, 2019.

                                                                                                                                                                    7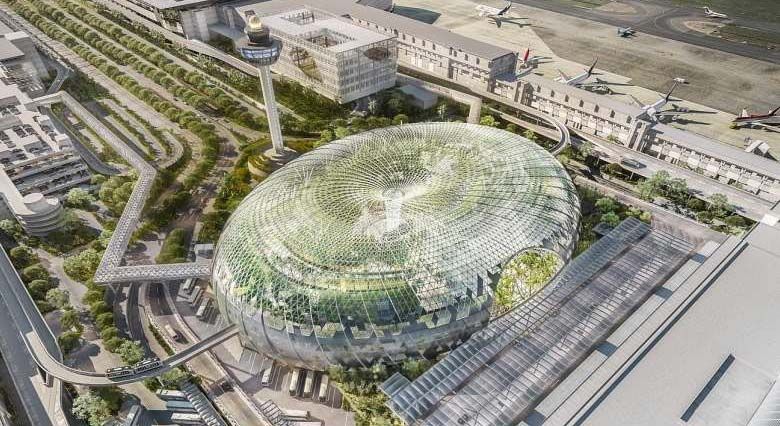
Strong Cash Flow, Balance Sheet and Liquidity
Investment Grade Balance Sheet Provides Flexibility for Future Growth Opportunities and Return of Capital
As of September 30, 2019: Trailing Twelve Months Ended September 30, 2019:
Cash Balance – $3.83 billion Cash Flow from Operations – $3.10 billion2
Debt1 – $11.93 billion Cash Flow from Operations excluding land premium payment
Net Debt1 – $8.10 billion for Marina Bay Sands Expansion – $4.06 billion
Net Debt1 to TTM EBITDA – 1.5x Adjusted Property EBITDA – $5.27 billion
LVS Dividends Paid – $2.36 billion; SCL Dividends Paid –
$616 million3
($ in US millions) Sands China U.S. LVS Corp. Total
Figures as of September 30, 2019 Ltd. Singapore Operations and Other Consolidated
Cash and Cash Equivalents4 $2,073 $275 $150 $1,334 $3,832
Debt 5,500 2,964 - 3,464 11,928
Net Debt (Cash) 3,427 2,689 (150) 2,130 8,096
5 6
Trailing Twelve Months Adjusted Property EBITDA 3,164 1,566 543 - 5,273
Gross Debt to TTM Adjusted Property EBITDA 1.7x 1.9x - - 2.3x
Net Debt to TTM Adjusted Property EBITDA 1.1x 1.7x - - 1.5x
Industry’s Strongest Balance Sheet and Cash Flow Create Ability to Reinvest in Current Portfolio, Return Capital to Shareholders and
Preserve The Flexibility to Make Investments in New Jurisdictions – Allows Potential Investments of $20 Billion or More in the Future
1. Debt balances shown here are net of deferred financing costs and original issue discounts of $91 million and exclude finance leases. SCL debt balance is net of a positive cumulative fair value adjustment of $45 million.
2. Includes the payment of $963 million made in April 2019 for the land premium related to the Marina Bay Sands Expansion.
3. Reflects only the public (non-LVS) portion of dividends paid by Sands China. Total dividends paid by Sands China in the TTM period ended September 30, 2019 were $2.05 billion.
4. Includes restricted cash of $15 million.
5. TTM Adjusted Property EBITDA for Sands China presented here reflects Adjusted Property EBITDA from our Macao Operations.
6. Includes $467 million of Adjusted Property EBITDA for Las Vegas operations, October 1, 2018 to September 30, 2019 and $76 million of Adjusted Property EBITDA for Sands Bethlehem operations, October 1, 2018 to sale of property completed on May 31, 2019.
8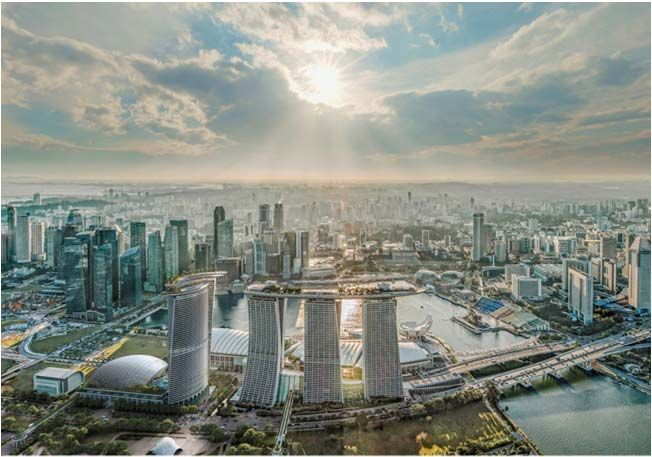
LVS Increasing Return of Capital to Shareholders
 $25.5 Billion of Capital Returned to Shareholders Since 2012

                                                                                Total Capital Returned to Shareholders

                      ($ in US millions)                                                                 Year Ended December 31,                         YTD
                                                                        2012             2013             2014       2015     2016     2017     2018     2019     Total

                      LVS Dividends Paid1                                $823           $1,153           $1,610      $2,074   $2,290   $2,310   $2,352   $1,779   $14,391

                      LVS Special Dividend Paid                         2,262                -                -         -        -        -        -        -       2,262
                      LVS Shares Repurchased                                -                570           1,665       205       -       375      905      454      4,174

                              Subtotal LVS                            $3,085            $1,723           $3,275      $2,279   $2,290   $2,685   $3,257   $2,233   $20,827
                      SCL Dividends Paid2                                  357               411              538      619      619      619      615      616      4,394

                      SCL Special Dividend Paid2                            -                -                239       -        -        -        -        -        239
                              Subtotal SCL                               $357              $411             $777      $619     $619     $619     $615     $616     $4,633

                      Total                                           $3,442            $2,134           $4,052      $2,898   $2,909   $3,304   $3,872   $2,849   $25,460

 LVS is Focused on Returning Capital to Shareholders While Maintaining a Strong Balance Sheet and the
 Financial Flexibility to Pursue Development Opportunities

1. Excludes dividends paid by Sands China and excludes the $2.75 per share special dividend paid in December 2012.
2. Reflects only the public (non-LVS) portion of dividends paid by Sands China.

                                                                                                                                                                            9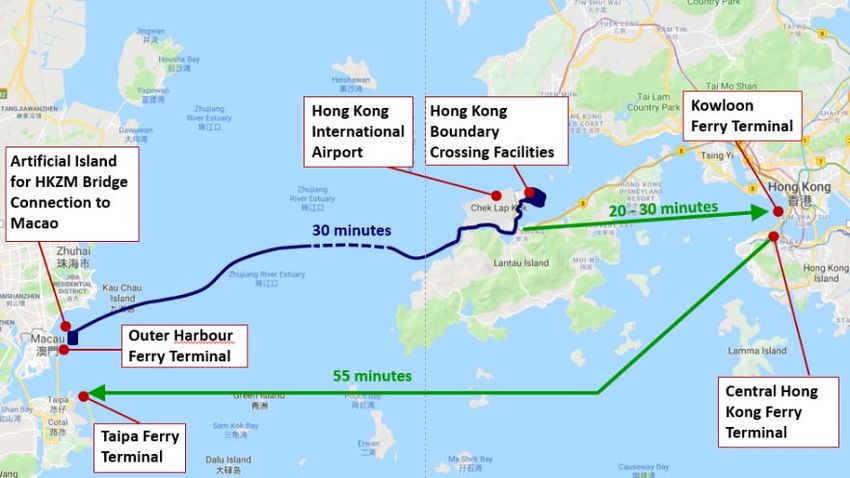
LVS Increasing Return of Capital to Shareholders (Cont’d)
$25.5 Billion of Capital Returned to Shareholders Since 2012
LVS Recurring Dividends per Share1
$3.08 $3.16
$2.88 $2.92 $3.00
$2.60
$2.00
$1.40
$1.00
2012 2013 2014 2015 2016 2017 2018 2019 2020
Dividends Repurchases
The LVS Board of Directors announced the increase of the LVS On June 7, 2018, the LVS Board of Directors authorized an
recurring dividend for the 2020 calendar year by $0.08 to $3.16 per increase in LVS’ share repurchase program to $2.5 billion and
share ($0.79 per share payable quarterly) extended the expiration date to November 2, 2020
Las Vegas Sands is committed to maintaining its recurring dividend During the third quarter of 2019, $100 million of common stock was
program and to increasing dividends in the future as cash flows repurchased (1.8 million shares at a weighted average price of
grow $54.90 per share)
The company currently has $1.22 billion available under its current
repurchase authorization
Since the inception of the company’s share repurchase program in
2013, the company has returned $4.17 billion to shareholders
through the repurchase of 64.4 million shares
LVS Remains Committed to Returning Capital Through Recurring Dividends and Share Repurchases
1. Excludes dividends paid by Sands China and excludes the $2.75 per share special dividend paid in December 2012.
10Macao Operations EBITDA Performance
Quarter Ended September 30, 2019 vs Quarter Ended September 30, 2018
Macao Operations Adjusted Property EBITDA and Adjusted Property EBITDA Margin
($ in US millions)
Adjusted Property EBITDA Hold-Normalized Adj. Prop. EBITDA
$900 60%
$800
50%
$700 $754 $755 $754 $755
$600 40%
$500
35.0% 35.7% 35.0% 35.7%
30%
$400
$300 20%
$200
10%
$100
$0 0%
3Q18 3Q19 3Q18 3Q19
Our Macao Property Portfolio Delivered $755 Million in Adjusted Property EBITDA During the Third Quarter
of 2019
11Macao Financial Performance
Quarter Ended September 30, 2019 vs Quarter Ended September 30, 2018
($ in US millions)
Net Revenue Adj. Property EBITDA Adj. Property EBITDA Margin
Growth Growth Growth
3Q18 3Q19 $ % 3Q18 3Q19 $ % 3Q18 3Q19 bps
The Venetian Macao $857 $851 ($6) -0.7% $344 $342 ($2) -0.6% 40.1% 40.2% 10
Sands Cotai Central 537 487 (50) -9.3% 188 169 (19) -10.1% 35.0% 34.7% (30)
The Parisian Macao 389 381 (8) -2.1% 122 120 (2) -1.6% 31.4% 31.5% 10
Four Seasons/Plaza Casino 167 196 29 17.4% 53 75 22 41.5% 31.7% 38.3% 660
Total Cotai 1,950 1,915 (35) -1.8% 707 706 (1) -0.1% 36.3% 36.9% 60
Sands Macao 160 171 11 6.9% 41 52 11 26.8% 25.6% 30.4% 480
Ferry Operations and Other 42 26 (16) -38.1% 6 (3) (9) -150.0% 14.3% -11.5% (2,580)
Total Macao 2,152 2,112 (40) -1.9% 754 755 1 0.1% 35.0% 35.7% 70
Adjusted Property EBITDA Margins at Our Macao Portfolio Grew 70 bps Year-Over-Year
in 3Q19 to Reach 35.7%
12Sands China Mass Market Table Update
SCL Base Mass Table Win by Quarter SCL Premium Mass Table Win by Quarter
Sands China Departmental Profit Margin: 35% - 45% Sands China Departmental Profit Margin: 25% - 40%
($ in US millions) ($ in US millions)
$1,000 Avg. Win per Table per Day:
$1,000 Avg. Win per Table per Day:
$8,664 $16,280
$900 $900
$800 $800
$756 $762 $774
$700 $725 $745 $700
$705 $693
All-time $674
$600 $600 $635
Record $616
Third
$500 $500 Quarter
Record
$400 $400
$300 $300
$200 $200
$100 $100
$0 $0
3Q18 4Q18 1Q19 2Q19 3Q19 3Q18 4Q18 1Q19 2Q19 3Q19
Avg. Avg.
Tables
975 976 961 962 956 Tables
434 439 446 448 450
Mass Market Table Win Grew 8.7% to Reach Third Quarter Record $1.44 Billion, Driven by Continuing
Growth in Both the Base and Premium Segments
Note: Sands China’s base mass and premium mass table revenues as presented above are based on the geographic position of non-rolling (mass) tables on the gaming floor. Some high-end mass play occurs in the base mass
geographic area.
13Sands China Mass Market Table and Slots Delivered 9.3% Growth
SCL Slots(1) Win by Quarter SCL Mass Table(2) Win by Quarter
Avg. Win per Unit per Day: $288 Avg. Win per Table per Day: $11,101
($ in US millions) ($ in US millions)
$200 $1,800
$180 $1,600
$160 $1,519
$162 $160 $1,400 $1,436
$155 $154 $1,418 $1,391
$140 $1,321
$139 $1,200 Third
$120 Quarter
$1,000 Record
$100
$800
$80
$600
$60
$40 $400
$20 $200
$0 $0
3Q18 4Q18 1Q19 2Q19 3Q19 3Q18 4Q18 1Q19 2Q19 3Q19
Avg. Avg.
5,771 5,241 5,827 5,840 6,039 1,409 1,415 1,407 1,410 1,406
Units Tables
Total Mass Market Delivered 9.3% Growth to Reach Third Quarter Record $1.60 Billion, Driven by Mass
Tables and Slots Segments
(1) Includes slots and electronic table games.
(2) Excludes rolling play.
14Growing Visitation from China to Macao1
Visitation from China Increased 17% to 28.5 Million in the Twelve Months Ended September 2019
Year-Over-Year Visitation Growth from China Visitation from China to Macao1
Twelve Months Ended September 30, Population GDP Per Penetration
Province 2018 2019 % Change (MM) Capita (US$) Rate
Guangdong 10,034,262 12,283,409 +22% 112 $11,857 11.0%
Hunan 1,130,639 1,275,327 +13% 69 $7,274 1.9%
Hubei 817,318 996,273 +22% 59 $8,902 1.7%
Fujian 880,210 987,605 +12% 39 $12,216 2.5%
Guangxi 725,680 981,015 +35% 49 $5,596 2.0%
Zhejiang 750,004 854,869 +14% 57 $13,445 1.5%
Jiangsu 665,641 837,353 +26% 80 $15,890 1.0%
Shanghai 669,425 750,639 +12% 24 $18,896 3.1%
Sichuan 470,769 620,915 +32% 83 $6,596 0.7%
Henan 545,063 572,417 +5% 96 $6,870 0.6%
Jiangxi 539,787 532,720 -1% 46 $6,439 1.2%
Beijing 378,298 408,000 +8% 22 $18,852 1.9%
Anhui 293,427 336,731 +15% 63 $6,349 0.5%
Liaoning 359,260 333,019 -7% 44 $7,876 0.8%
Shandong 338,947 330,044 -3% 100 $10,753 0.3%
Heilongjiang 329,038 329,902 +0.3% 38 $6,195 0.9%
Chongqing 282,778 325,879 +15% 31 $9,276 1.1%
Hebei 318,313 273,467 -14% 75 $6,714 0.4%
Jilin 242,402 248,985 +3% 27 $8,194 0.9%
Shanxi 223,204 232,419 +4% 37 $6,213 0.6%
Tianjin 136,734 137,381 +0.5% 16 $17,163 0.9%
All Other Provinces 4,198,293 4,846,326 +15% 224 N/A 2.2%
> 10% 0% -Macao Market: Increasing Mass Gaming Revenue
Macao Market Mass Gaming Revenue
($ in US millions) 1
Mass Win (Tables and Slots)
Q1 Q2 Q3 Q4 Total
2016 $3,609 $3,508 $3,816 $3,989 $14,922
2017 $4,146 $4,017 $4,169 $4,706 $17,038
Growth ('17 v '16) 14.9% 14.5% 9.3% 18.0% 14.2%
2018 $4,955 $4,841 $4,864 $5,251 $19,911
Growth ('18 v '17) 19.5% 20.5% 16.7% 11.6% 16.9%
2019 $5,440 $5,356 $5,399 2 - -
Growth ('19 v '18) 9.8% 10.6% 11.0%2 - -
The Macao Market’s High-Margin Mass Gaming Segment Continues to Grow
1. Market-wide mass GGR for all periods through 2Q19 is defined as mass win (tables and slots) as reported by the casino operators in their public filings (does not include revenue from Galaxy’s City Clubs business). All figures reported in Hong Kong
dollars have been converted to USD using a 7.75 exchange rate.
2. Market-wide mass GGR for 3Q19 is estimated by LVS management based on DICJ reported data and LVS management’s estimated differences between DICJ reporting and win reported by operators in public filings.
Source: Public company filings, Macao DICJ.
16Macao Market: Continued Growth in High Margin
Mass Gaming Segment
Macao Market Mass Gaming Revenue (Tables & Slots) & Mass Win-per-Visit1
($ US in millions)
$5,399
$5,440
$5,500 $5,356 $1,400
$5,251
$4,955
$4,864
$5,000 $4,841 $1,200
$4,706
$4,589 $4,449
$4,500 $4,419 $1,000
$4,340
$4,146 $4,169
$3,989 $4,017
$4,000 $3,873 $3,919 $800
$3,816
$3,682 $3,589
$3,609
$3,351 $585 $597 $586 $3,508
$3,500 $3,441 $3,408 $3,497 $536
$580 $586
$600
$536 $527 $522 $540 $526 $525 $540 $544
$499 $490 $497 $494 $504
$474 $487 $464 $457
$484 $480 $471
$432
$3,000 $400
$2,500 $200
$2,000 $0
1Q13 2Q13 3Q13 4Q13 1Q14 2Q14 3Q14 4Q14 1Q15 2Q15 3Q15 4Q15 1Q16 2Q16 3Q16 4Q16 1Q17 2Q17 3Q17 4Q17 1Q18 2Q18 3Q18 4Q18 1Q19 2Q19 3Q19
Mass Win (Tables & Slots) Mass Win per Visit
We Estimate Macao Market-Wide Mass Win Increased Approximately 11% in 3Q19
1. Market-wide mass GGR for all periods through 2Q19 is defined as mass win (tables and slots) as reported by the casino operators in their public filings (does not include revenue from Galaxy’s City Clubs business). All figures reported in Hong Kong
dollars have been converted to USD using a 7.75 exchange rate. Market-wide mass GGR for 3Q19 is estimated by LVS management based on DICJ reported data and LVS management’s estimated differences between DICJ reporting and win
reported by operators in public filings.
Source: Public company filings, Macao DSEC, Macao DICJ, Macao Public Security Police.
.
17Sands China Departmental Profit Contribution Is Diversified and Stable
Sands China Departmental Profit Contribution1
TTM 3Q18 TTM 3Q19
VIP MICE and VIP
MICE and 8% Other 7%
Other 2%
4%
Mall
Mall 12%
12%
Mass
Tables Hotel Mass
Hotel 54% 15% Tables
15% 57%
Slots Slots
7% 7%
Mass Tables / Slots and Non-Gaming Generated 93% of Sands China’s Departmental Profit in TTM 3Q19
1. Represents departmental profit from The Venetian Macao, Sands Cotai Central, The Parisian Macao, The Plaza Macao and Four Seasons Hotel Macao, Sands Macao and Ferry Operations and Other (before unallocated expenses) for the TTM
periods ended September 30, 2019 and 2018.
18Ongoing Strategic Reinvestment in Our Market-Leading
Macao Portfolio
Estimated Spend Expected Timeframe
The Londoner Macao:
• Renovation, expansion and rebranding of SCC to ~$1.35B Commencement in 2019 – phased to minimize
The Londoner Macao disruption during peak periods
• Phased completion throughout 2020 and 2021
New Luxurious Hotel Towers:
• Grand Suites at Four Seasons Macao Expand suite ~$450M • Three gaming salons opened in tower late
inventory with approximately 290 new luxury suites, ranging September
in size from 2,000 to 4,700 SF; introduction of three luxurious • Suite simulations now in progress
gaming salons
• Grand opening expected in first half of 2020
• The Londoner Tower Suites Approximately 370 new luxury ~$400M Work is progressing – anticipated completion in late
suites ranging in size from 1,400 to 3,100 SF 2020
Total Spend: Londoner, The Londoner Tower Suites and
Grand Suites at Four Seasons Macao ~$2.2B
Other Projects:
The Parisian Macao Creating additional luxury suites Phases I, II and III completed
The Venetian Macao VIP and premium mass gaming areas expanded Work is progressing – phased completion throughout 2020
and refurbished
Work is completed
The Plaza Macao VIP gaming areas expanded and refurbished
Investments Targeted to Drive Growth in Every Segment of the Macao Market: Retail, Entertainment, Hotel
and Both Mass and VIP Gaming
19Sands China
Continued Expansion of Market-Leading Cotai Strip Property Portfolio
LVS’ Cotai Strip Properties Leadership in Macao
Investment
Grand Suites at Four
Seasons Macao St. Regis Hotel ~$13 billion today, ~$15 billion by 2021
~290 Suites 400 Suites
Approximately 30 million square feet of interconnected facilities on Cotai
The Londoner Tower Hotel Inventory
The Venetian Macao Suites
2,905 Suites ~370 Suites ~12,100 rooms and luxury suites as of 3Q19
>50% of hotel inventory on Cotai
C Retail
O ~1.9 million square feet of gross leasable retail
T Conrad
Revenue of $514 million as of TTM 3Q19
A
659 Rooms
& Suites
Entertainment
I The Macao leader in entertainment – more seats, shows and venues than any
Four Seasons Holiday Inn other operator
Macao 1,224 Rooms
360 Suites & Suites The Cotai Arena is the largest, most important entertainment venue in Macao,
S featuring 15,000 seats
Paiza Sheraton
Mansions
T MICE
3,968 Rooms
19 Suites & Suites
R The Macao leader in convention and group meetings
I ~80% of all MICE square footage in Macao is owned and operated by Sands
P China
Reinvestment
~290 new suites in the Grand Suites at Four Seasons Macao by 1H20
The Parisian Macao Tropical Gardens (~1 million SF in new suite product)
2,541 Rooms &
Suites ~370 new suites in The Londoner Tower Suites in late 2020
(~1 million SF in new suite product)
The re-themed Londoner Macao will provide a third European-themed iconic
destination resort on Cotai with additional MICE, retail, entertainment and
luxurious suite offerings upon completion of its planned opening in phases
New Luxury Suites Suite Conversion1
throughout 2020 and 2021
1. Holiday Inn consists of 1,224 rooms and suites, of which approximately 300 are currently out of service. Upon completion of The Londoner hotel, the Holiday Inn rooms and suites will be eliminated and The Londoner hotel will feature approximately
600 suites.
20Market Leading Hotel Capacity
SCL is the Clear Leader in Macao Hotel Room and Suite Inventory
Projected Macao Market 4/5 Star Hotel Rooms at December 31, 20201 – Gaming Operators
Cotai ~ 25,500 Rooms by Gaming Operators Total Macao ~ 29,000 Rooms by Gaming Operators
MGM China 12,736 Rooms and MGM China 13,025 Rooms and
Wynn 5% Suites at SCL 7% Suites at SCL
Macau Wynn
7% Macau
9%
SJM
8% SJM
Sands 10% Sands
Melco China China
15% 50% 45%
Melco
14%
Galaxy Galaxy
15% 15%
With a Market-Leading ~US$15 Billion of Investment by 2020, SCL Hotel Inventory is Forecast To Represent
45% of Gaming Operator Hotel Rooms and 50% of Hotel Rooms on Cotai
1. See slide 61 titled ‘Market-Leading Hotel Capacity at SCL’ for further detail.
Source: Public company filings, Macao DSEC, Macao Tourism Board.
21Macao Market
Adjusted Property EBITDA Market Share by Operator
Historical Adjusted Property EBITDA Market Share1
Sands China2 All Others
Macao Leader in Market Share of EBITDA MGM3 Melco
Wynn Galaxy3
SJM
40% 80%
72%
34% 66%
10%
60% 8%
30% 28%
16%
16%
20% 40% 14% 5%
14%
14%
10% 20%
23%
18%
0% 0% 4
2012 TTM 2Q19 2012 TTM 2Q19
Sands China Generated 34% of Macao Market EBITDA For The Twelve Months Ended June 30, 2019
1. Reflects reported adjusted property EBITDA for the six concessionaires and sub-concessionaires.
2. Reflects adjusted property EBITDA from The Venetian Macao, Sands Cotai Central, The Parisian Macao, The Plaza Macao and Four Seasons Hotel Macao, Sands Macao and Ferry Operations & Other.
3. Galaxy only includes EBITDA from Starworld, Galaxy Macau and Broadway Macau. MGM reflects Adjusted EBITDA (excluding royalty fees) from MGM Macau and MGM Cotai as reported by MGM Resorts.
4. Sum of individual rounded competitor concessionaire market share percentages may not add to total rounded competitor market share percentage.
Source: Company Reports.
22Marina Bay Sands
$435 Million of Adjusted Property EBITDA in 3Q19
Adjusted Property EBITDA
and Adjusted Property EBITDA Margin
Adjusted property EBITDA increased 3.8% to $435 million ($ in US millions)
Actual Hold-Normalized
$600 80%
Hold-normalized adjusted property EBITDA decreased 4.0% to
$500 70%
$387 million $419 $435
$403 $387
$400 60%
Rolling volume increased 2.4% to $7.27 billion; rolling win % was $300 54.7% 54.9% 50%
54.0% 52.7%
3.98% in 3Q19 compared to 3.43% in the prior-year quarter
$200 40%
Mass (non-Rolling tables and slots) win-per-day of $4.43 million $100 30%
$0 20%
─ Non-Rolling table win: $255 million 3Q18 3Q19 3Q18 3Q19
Non-Rolling Table and Slot Win Per Day
─ Slot win: $153 million
($ in US millions)
$6.0
Mass table hold decreased 1.7 pts to 18.0% from 19.7%
$4.65 $4.43
ADR grew 1.9% to $475, while occupancy increased 0.2 pts to $4.0 $1.74 $1.66
97.7%
$2.0 Slot Machines
$2.91 $2.77
Non-Rolling
Tables
$0.0
3Q18 3Q19
Continued Strength in Foreign Visitation and Spending Contributing to $435 million in Adjusted Property
EBITDA
23Marina Bay Sands
Diversified Sources of Departmental Profit
Marina Bay Sands Hold-Normalized1 Departmental Profit Contribution
TTM 3Q182 TTM 3Q192
VIP VIP
MICE and 17% MICE and 17%
Other Mass Mass
Other
4% Tables Tables
5%
33% 33%
Mall
8% Mall
8%
Hotel Slots
Slots Hotel
16% 20%
22% 17%
Diversified Sources of Profit at Marina Bay Sands Have Generated Strong and Stable Cash Flow at the
Property
1. Hold-normalized figures reflect methodology implemented in 1Q19 whereby rolling win percentage will be normalized to 3.15% when falling outside of the 3.00% - 3.30% range.
2. With no adjustment for hold-normalization, VIP contribution would have been 23% (vs. 17%) in the TTM period ended September 30, 2018 and 17% (vs. 17%) in the TTM period ended September 30, 2019.
24Marina Bay Sands $3.3 Billion Expansion to Bring New
Luxurious Hotel, Entertainment, MICE and Retail Offerings
Las Vegas Sands has entered into a development agreement with the Singapore government to expand Marina Bay Sands
Iconic New Luxury Hotel Tower:
− Approximately 1,000 all-suite rooms designed to set a new standard of luxury in the region
− Sky roof with a swimming pool and other tourism attractions
State-of-the-art arena designed specifically for live musical performances; Seating for at least 15,000
Additional MICE capacity (meeting and function rooms, exhibition halls)
Luxury retail
Note: Images above denote preliminary artistic impressions which are subject to change.
25Our Integrated Resorts Are Designed to Maximize Economic Growth
and the Leisure & Business Tourism Appeal of our Host Markets
Contribution to Singapore’s Leisure & Business Tourism Appeal
MBS Existing Contributed to economic growth and to Singapore’s appeal as an exciting
global city
Delivered iconic architecture to Singapore’s CBD area
MBS is central to the MICE business in Singapore with record 2018 MICE
revenues. MBS hosted more than 3,000 events in 2018
Created thousands of jobs for Singaporeans (MBS employed >10,000
FTE’s in 2018)
Focused procurement and sourcing on Singapore-based SME’s
MBS Expansion Further enhance MBS’ status as an iconic architectural landmark
Provide suite product that is unparalleled in South East Asia
Introduce a ‘state-of-the-art’ theater designed for live musical
performances that can attract the highest-caliber global entertainment
acts to Singapore
Extend the success of Singapore as a MICE destination
Ensure MBS is positioned to grow its economic, employment and
visitation contributions to Singapore in the years ahead
Note: Images above denote preliminary artistic impressions which are subject to change.
26Retail Mall Portfolio in Asia Generates Strong Revenue and
Operating Profit
Trailing Twelve Months Retail Mall Revenue
($ in US millions)
$800
TTM 3Q19 Sales
$689 $696 per Sq. Foot²
$682 $685
$700 $658
MBS
$600 $179 $180 $180 $182
$175 $2,028
Parisian Macao
$500 $52 $52 $688
$56 $53
$59 SCC
$69 $71 $72 $72 $966
$400 $63
Four Seasons
$143 $142 Luxury: $6,652
$300 $134 $145 $145
Other: $2,687
$200 Venetian
$1,708
$227 $233 $236 $242 $248
$100
$0
3Q18 4Q18 1Q19 2Q19 3Q19
Operating
$581M $604M $608M $610M $618M
Profit
Operating Profit
Margin 88% 89% 89% 89% 89%
The Venetian Macao Four Seasons Macao Sands Cotai Central1 The Parisian Macao Marina Bay Sands
1. At September 30, 2019, approximately 479,000 square feet of gross leasable area was occupied out of a total of up to approximately 600,000 square feet of retail mall space that will be featured at completion of all phases of Sands Cotai Central’s
renovation, rebranding and expansion to The Londoner Macao.
2. Tenant sales per square foot is the sum of reported comparable sales for the trailing 12 months divided by the comparable square footage for the same period. Only tenants that have occupied mall space for a minimum of 12 months are included
in the tenant sales per square foot calculation.
27Strong Retail Sales in Our Market-Leading Destination Retail
Portfolio in Asia
($ per Sq. Foot, Unless Otherwise Indicated) 2
3Q19 Sales per Sq. Ft.
GLA1 Occupancy %
(Sq. Ft) at Period End TTM 3Q19 TTM 2Q19 TTM 1Q19 TTM 4Q18 TTM 3Q18
The Shoppes at Marina Bay Sands 593,735 96.7% $2,028 $1,945 $1,918 $1,898 $1,840
Shoppes at Venetian 812,953 91.4% $1,708 $1,688 $1,732 $1,746 $1,733
Shoppes at Four Seasons
Luxury Retail 125,566 100.0% $6,652 $6,247 $6,051 $5,836 $5,656
Other Stores3 115,797 84.9% $2,687 $2,186 $2,123 $2,046 $1,918
Shoppes at Cotai Central 524,365 91.3% $966 $967 $880 $892 $862
Shoppes at Parisian 295,915 89.6% $688 $650 $640 $649 $657
Retail Sales Continue to Grow Across Our Asian Retail Property Portfolio
1. Denotes gross leasable area.
2. Tenant sales per square foot reflect sales from tenants only after the tenant has been open for a period of 12 months.
3. ~16,000 square feet of previously underperforming space is currently unoccupied while undergoing repositioning. This resulted in a material change in occupancy rate to 84.9% at period end 3Q19 from 98.2% at 3Q18 period end
and 94.9% at 2Q19 period end.
28Capital Expenditures Expectations
Future Planned Investments Composed of Income Producing Projects and Maintenance
($ US in millions)
$3,000
LVS Capex Expectations
$2,400 $2,225
$1,725
$1,800 $1,600
$1,000
$300 $1,250 $1,300
$1,200 $150 $900
$949 $275 $300
$837 $300
$100 $800
$194 $200 $350 $450
$600 $396 $325
$147 $150
$477 $450 $500 $500 $500 $500 $500
$0
2017A 2018A 2019E 2020E 2021E 2022E 2023E
Development Timeline
Expansion, Renovation and Rebranding of SCC to The Londoner
Grand Suites at Four Seasons Macao
The Londoner Tower Suites
Marina Bay Sands Expansion Project
Marina Bay Sands Expansion Expansion, Renovation and Rebranding of SCC to The Londoner Grand Suites at Four Seasons Macao Pre-Opening
1
The Londoner Tower Suites The Parisian Macao St. Regis Hotel at SCC Investments in Current Properties and Other Maintenance Post-Opening
Future Capital Expenditures Focused on $5.5 billion of Projects to Expand and Enhance Our Industry-
Leading Property Portfolios in Macao and Singapore
1. Reflects investments that are designed to generate future income in our current property portfolio.
29Las Vegas Operations Update
Adjusted Property EBITDA of $93 million
Adjusted Property EBITDA
Adjusted property EBITDA was $93 million an increase of 22.4% and Adjusted Property EBITDA Margin
Hold-normalized adjusted property EBITDA ($ in US millions)
Actual Hold-Normalized
− Increased 9.3% to $106 million +22.4% +9.3%
$140 40%
− Margin increased 120 basis points to 25.2% $120 $106
$97 30%
Hotel room revenue grew 4.3% to $144 million $100 $93
$80 $76
− ADR increased 5.3% to $237, while occupancy increased 0.2 pts 24.0% 25.2%
20%
to 94.6% $60 20.1% 22.9%
$40 10%
− RevPAR increased 5.2% to $224
$20
Slot win increased 3.4% to $61 million $0 0%
3Q18 3Q19 3Q18 3Q19
Table games drop decreased 6.7% to $473 million, while win percentage
increased 2.2 pts to 16.9% Composition of Table Games Drop
− Non-Baccarat drop increased 25.4% to $252 million ($ in US millions)
Most promising opportunities for future growth $600
$507
− Convention and group meeting business $500 $473
− Increase in room pricing $400 $201
$252
− Entertainment and non-gaming offerings $300
− Increase in premium play $200 Non-Baccarat
$306
$221 Baccarat
$100
$0
3Q18 3Q19
30Disciplined Execution of Our Global Growth Strategy
Focused on the Most Promising Global Development Opportunities
Uniquely positioned to bring our unmatched track record and powerful convention-based business model to the world’s most
promising Integrated Resort development opportunities
Balance sheet strength designed to support future large-scale development projects, flexibility to support $20 billion of future investment
Development opportunity objectives:
− Target minimum of 20% return on total invested capital
− 25% - 35% of total project costs to be funded with equity (project financing to fund 65% - 75% of total project costs)
Principal Areas of Future Development Interest:
Macao Singapore Japan South Korea
31Appendices
Supplemental Data
Historical Hold-Normalized Adjusted Property EBITDA1
($ in US millions)
                                                            3Q17                4Q17                 1Q18                 2Q18                 3Q18                4Q18                 1Q19                 2Q19                3Q19
                        2
Macao Operations
     Reported                                               $651                 $730                 $789                $750                 $754                 $786                 $858                $765                 $755
     Hold-Normalized                                        $641                 $757                 $767                $730                 $754                 $786                 $835                $744                 $755

                        3
Marina Bay Sands
     Reported                                               $442                 $457                 $541                $368                 $419                 $362                 $423                $346                 $435
     Hold-Normalized                                        $442                 $407                 $447                $382                 $403                 $382                 $423                $384                 $387

Las Vegas Operations
     Reported                                                 $76                $114                 $141                  $77                  $76                $100                 $138                $136                   $93
     Hold-Normalized                                          $90                $114                 $141                $106                   $97                $125                 $131                $146                 $106

                       4
Sands Bethlehem
     Reported                                                 $40                 $34                  $29                  $30                  $33                 $24                  $33                  $19                     -
     Hold-Normalized                                          $40                 $34                  $29                  $30                  $33                 $24                  $33                  $19                     -

LVS Consolidated
     Reported                                             $1,209              $1,335               $1,500               $1,225               $1,282              $1,272               $1,452               $1,266               $1,283
     Hold-Normalized                                      $1,213              $1,312               $1,384               $1,248               $1,287              $1,317               $1,422               $1,293               $1,248
1. This schedule presents hold-normalized adjusted property EBITDA based on the following methodology:
    - for Macao operations and Marina Bay Sands: if the quarter’s rolling win percentage is outside of the 3.00%-3.30% range, then a hold adjustment is calculated by applying a rolling win percentage of 3.15% to the rolling volume for the quarter.
    - for Las Vegas Operations: if the quarter’s baccarat win percentage is outside of the 18.0%-26.0% range, then a hold adjustment is calculated by applying a baccarat win percentage of 22.0%, and if the quarter’s non-baccarat win percentage is
      outside of the 16.0%-24.0% range, then a hold adjustment is calculated by applying a non-baccarat win percentage of 20.0%.
    - for Sands Bethlehem: no hold adjustment was made.
    - for all properties: gaming taxes, commissions paid, bad debt expense, discounts and other incentives are applied to determine the hold-normalized adjusted property EBITDA impact.
2. Adjusted property EBITDA presented here reflects adjusted property EBITDA from The Venetian Macao, Sands Cotai Central, The Parisian Macao, The Plaza Macao and Four Seasons Hotel Macao, Sands Macao and Ferry Operations and Other.
3. Denotes revised normalized rolling win percentage implemented in Q1 2019.
4. The Company completed the sale of Sands Bethlehem on May 31, 2019.

                                                                                                                                                                                                                                                          34
Debt Maturity Profile
Debt Maturity by Year1
($ in US millions)
$3,000
$2,796
$2,630
$2,500
996
$2,000 $1,860 $1,886 $1,900
1,630
$1,500
$1,000 1,900
1,800 1,750 1,800 $750
$500 1,000
750
$16 $67 $66 $63
$0
$0
2
2019 2020 2021 2022 2023 2024 2025 2026 2027 2028 2029
% of
Total 0% 1% 1% 1% 15% 15% 23% 22% 0% 16% 6%
MBS Credit Facility SCL Bonds LVS Bonds
Long Dated, Low Cost Capital Structure in Place
1. Maturity profile includes (i) issuance of $5.50 billion of senior notes by Sands China ($1.80 billion 4.600% notes due 2023, $1.80 billion 5.125% notes due 2025 and $1.90 billion 5.400% notes due 2028) in August 2018 used, in part, to refinance all
existing term loans under the VML Credit Facility and repay outstanding VML Credit Facility revolver balance, (ii) issuance of $3.50 billion of senior notes by Las Vegas Sands Corp. ($1.75 billion 3.200% notes due 2024, $1.00 billion 3.500% notes
due 2026 and $0.75 billion 3.900% notes due 2029) in July 2019, used, in part, to refinance the existing term loan under the Extended U.S. Term B Credit Facility, and (iii) amendment and extension of the Singapore credit facility (S$750 million
Revolving Credit Facility, S$4.17 billion Term Loan Facility and S$3.75 billion Delay Draw Term Loan Facility).
2. Amounts maturing from October 1 through December 31, 2019.
35Macao Market: VIP Gaming
Macao Market VIP Gaming Revenue
($ in US millions)
VIP Win1
Q1 Q2 Q3 Q4 Total
2016 $3,294 $2,856 $3,017 $3,516 $12,683
2017 $3,661 $3,734 $4,099 $4,292 $15,786
Growth ('17 v '16) 11.1% 30.7% 35.9% 22.1% 24.5%
2018 $4,429 $4,208 $4,288 $4,412 $17,337
Growth ('18 v '17) 21.0% 12.7% 4.6% 2.8% 9.8%
2019 $3,892 $3,640 $3,376 2 - -
Growth ('19 v '18) -12.1% -13.5% -21.3%2 - -
The Macao VIP Market Continued to Decline in the Third Quarter of 2019
1. Market-wide VIP GGR for all periods through 2Q19 as reported by the casino operators in their public filings (does not include revenue from Galaxy’s City Clubs business). All figures reported in Hong Kong dollars have been converted to USD using
a 7.75 exchange rate.
2. Market-wide VIP GGR for 3Q19 is estimated by LVS management based on DICJ reported data and LVS management’s estimated differences between DICJ reporting and win reported by operators in public filings.
Source: Public company filings, Macao DICJ.
36Sands China VIP Table Update
SCL Rolling Volume by Quarter SCL Rolling Win by Quarter
($ in US billions) ($ in US millions, except per table amounts)
$1,000 Avg. Win per Table per Avg. Win per Table per
$25 Day: $29,515 Day: $19,011
$900
$20 $20.97 $800
$700
$687
$15 $600
$14.58 $500
$10 $400 $439
$300
$5 $200
$100
$0 $0
3Q18 3Q19 3Q18 3Q19
Avg.
253 251
Tables
Sands China Rolling Volume Declined ~30% in 3Q19
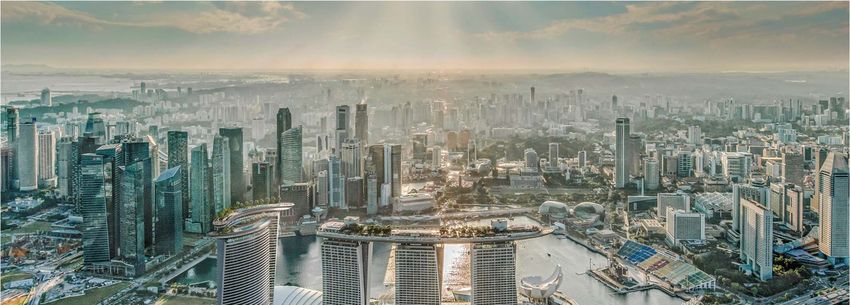
37Marina Bay Sands Expansion
Marina Bay Sands Expansion

A Development Agreement with The Singapore Tourism Board Will Allow an Expansion of Marina Bay Sands

                                                                                                       39
Marina Bay Sands Expansion
Artistic Impression
Design and Development Work are Progressing, with a Focus on Increasing the Leisure and Business
Tourism Appeal of Singapore and Marina Bay Sands
Note: Image above denotes preliminary artistic impression which is subject to change.
40Visitor Arrivals To Singapore
(000s)
20,000 Opening of Marina Bay
Sands and Resorts World
18,000 Sentosa, 2010
18,507
17,425
16,000
16,404
15,568 15,231
14,000 15,087
14,496
12,000 13,171
11,639
10,000
9,683
8,000
6,000
4,000
2,000
-
2009 2010 2011 2012 2013 2014 2015 2016 2017 2018
- Visitation To Singapore Has Almost Doubled Since the Introduction of Integrated Resorts
- Following a Contraction in 2014, Visitation has Reaccelerated
- The CAGR for the Period from 2009 (Immediately Prior to IR Openings) to 2018 is 7.5%
Source: Singapore Tourism Board.
Note: Excludes visitor arrivals from Malaysia by land.
41Strong Growth in Chinese Inbound Tourism to Singapore
Singapore Inbound Tourism Arrivals from Largest Source Markets
2014-2018
CAGR +4.0% +3.6% +0.2% +0.7% +0.4% +11.2% 0.0% +18.7%
(in thousands)
4,000
China has been the fastest-growing market for visitation to Singapore, with a
CAGR of 19% over the last four years 3,418
3,500
3,025 3,021
3,000
2,500
2,000 1,722
1,442
1,500 1,233 1,254
1,075 1,107
944
1,000 778 825 830
629 676
537
500
-
South Korea Philipines Japan Australia Malaysia1 India Indonesia China
FY 2014 FY 2018
Visitors from China Dominate the Recent Growth in Tourism Arrivals, Compounding at ~19% Per Annum
Over the Last Four Years
1. Excludes visitor arrivals from Malaysia by land.
Source: Singapore Tourism Board.
42Retail Spending by Visitors to Singapore Has Increased
83% Since the Introduction of the Two Integrated Resorts
Singapore Shopping Tourism Receipts
($ in Singapore millions)
$7,000
$6,000 $6,170
$5,950
$5,000
$4,489 $4,588 $4,553
$4,000
$3,971 $4,120
$3,928
$3,000 $3,377
$2,000
$1,000
$-
2009 2010 2011 2012 2013 2014 2015 2016 2017
Source: Singapore Tourism Board.
43Changi Airport
Conveniently Connecting The World to Singapore
Overview
Singapore’s Changi Airport processed 65.6 million passenger movements in 2018, ranking it 19th Globally and 8th in Asia by that
measurement
Qualitative measures place it significantly higher – ranked World’s Best Airport in 2019 (Skytrax World Airport Awards) for seventh
consecutive year and for the tenth time overall
Changi currently services ~400 cities in ~100 countries
Future traffic growth estimated at least 3 – 4% per annum long-term and significant capacity increases are underway to facilitate
that additional traffic
Changi Airport
Recent Passenger Growth
Changi passenger movements in 2018 increased +5.5% versus 2017
2015 to 2018 CAGR rate in passenger movement is +5.8%
Most recent data for the first five months of 2019 reports growth of +3.4%
Changi is One of the World’s Largest Airports, an Important Asian Transportation Hub and a Strong
Contributor to Singapore’s Leisure and Business Tourism Appeal
44Changi Airport
Significant Development to Sustain Growth in Passenger Capacity
Recent Airport Expansion
Terminal 4 opened October 2017 and hosts nine airlines including Cathay Pacific, Korean Air, Air Asia and Vietnam Airlines
This has allowed these carriers to expand their operations as well as freeing up capacity in Terminals 1, 2 & 3
Terminal 4 capacity is 16 million passengers taking the total capacity to 82 million passenger movements
Changi Jewel opened in April 2019 – multi-use retail, hotel and F&B destination jointly developed by Changi Airport and CapitalLand;
Includes 280 shopping and dining outlets
Changi Airport – Layout of Existing Facilities and Proposed Future Developments Changi Jewel – Opened April 2019
Future Airport Expansion:
Runways: Work currently ongoing to expand from a two-runway to three-runway system. Completion anticipated early 2020’s
New ‘Mega-Terminal” known variously as Terminal 5 or Changi East will ultimately take passenger handling capacity from 82 million
to >130 million passengers by ~2030
In the longer-term, Terminal 5 could add a further 20 million passengers if justified by demand, taking capacity >80% higher than it is
today, even after the recent opening of Terminal 4
45Changi Airport - 31 Cities in China are Served by Direct
Flights to Singapore
Thirteen airlines fly direct services between Singapore Changi and cities in China
Singapore Airlines Sichuan Airlines
SilkAir Hebei Airlines
China Eastern Spring Airlines
Air China China West Airlines
China Southern Scoot
Xiamen Airlines Jetstar Asia
Shenzhen Airlines
The following 31 cities in China are currently served by direct flights to/from Singapore
Beijing Haikou Macao Shanghai Zhengzhou
Changsha Hangzhou Nanchang Shantou Xiamen
Chengdu Harbin Nanning Shenyang Xi’an
Chongqing Hong Kong Nanjing Shenzhen
Fuzhou Jinan Ningbo Tianjin
Guangzhou Jinjiang Qingdao Wuhan
Guiyang Kunming Sanya Wuxi
Prior to the Proposed Changi Terminal 5 Expansion China is Already Served by 13 Airline Operators with
Direct Flights to and from Singapore, to a Total of 31 Cities
46Marina Bay Sands
Changes in Casino Regulations
Casino Exclusivity
The Singapore government has announced a renewal of the exclusivity period for the casinos within the two Integrated
Resorts to the end of 2030
Singapore Casino Entry Levy Increase
The entry levy increased on April 4, 2019 by 50% to S$150 daily, or S$3,000 annually
Changes Specific to the Casino at Marina Bay Sands
Approval to develop the 55th floor of MBS’ hotel Tower 1, or other areas within Tower 1, to conduct casino gaming
Upon the achievement of certain milestones:
− Ability to operate up to 3,500 gaming machines (up from 2,500 previously)
− Option to purchase an additional 2,000 sq. meters of additional gaming area
47Marina Bay Sands
Changes in Casino Tax Rates Effective March 1, 2022
On March 1, 2022, a tiered casino tax system will go into effect. These tax rates will be in effect until at least February
2032
Casino Tax Rate Structure1
Mass Gaming
Mass Gaming Tax
Tax Rates
Rates:
Before March 1, 2022 After March 1, 2022
All GGR First S$3.1B GGR GGR>S$3.1B
15.0% 18.0% 22.0%
Premium Gaming
Premium Gaming Tax
Tax Rates
Rates:
Before March 1, 2022 After March 1, 2022
All GGR First S$2.4B GGR GGR>S$2.4B
5.0% 8.0% 12.0%
1. If the IR fails to meet its investment commitments, then a flat tax rate of 12% will apply on the entire amount of GGR from premium gaming, and a flat tax of 22% will apply on the entire amount of GGR from mass gaming.
48Macao Market Background and Infrastructure Slides
Market-Leading ~$15 Billion of Investment
Investing in Macao’s Future as a Leisure & Business Tourism Destination
Industry-Leading Integrated Resort Portfolio
− Portfolio of ~13,000 suites and hotel rooms
− Addition of ~2 million sq. feet of new luxurious hotel suite inventory in 2020
The Entertainment and Tourism Offerings of the Londoner Macao Will Be Introduced Throughout 2020 and 2021
Conference, Exhibition and Carpeted Meeting Space: ~Two Million sq. feet
World-Class Entertainment and Events
World Class Shopping: ~ 1.9 Million sq. feet
Our Diversified Convention-Based Integrated Resort Offerings Coupled with Industry Leading Branding and Service
Levels Appeal to the Broadest Set of Customers and Provide a Competitive Advantage in the Macao Market
50Macao Visitation Opportunity
Business & Leisure Tourism Expenditure Drivers
Future Growth Drivers As a result, Macao’s Mass visitors will
More efficient and affordable Come From Farther Away
transportation infrastructure
Stay Longer
Greater number of hotel rooms and
non-gaming offerings in Macao
Spend More On
Additional tourism attractions in
− Lodging
− Retail
Macao and Hengqin Island
− Dining
− Entertainment
Rapidly expanding middle-class with − Gaming
growing disposable income and a
desire for tourism
51Mass Gaming Generates Over 85%
of Gaming Operating Profit in Macao
Composition of Macao Market Gross Gaming Revenue1 and Est. Gaming Operating Profit2
Quarter Ended September 30, 2019 TTM Ended September 30, 2019
($ in US millions) ($ in US millions)
$8,775M $2,497M $36,766M $10,110M
100% 100%
14% 15%
80% 38% 80% 42%
60% 60%
40% 86% 40% 85%
62% 58%
20% 20%
VIP Gaming
0% Mass Tables and Slots 0%
Gross Gaming Operating Profit Gross Gaming Operating Profit
Revenue Revenue
Mass Gaming Generates Over 85% of Gaming Operating Profit in Macao
1. Market-wide GGR for all periods through 2Q19 as reported by the casino operators in their public filings (does not include revenue from Galaxy’s City Clubs business). All figures reported in Hong Kong dollars have been
converted to USD using a 7.75 exchange rate. Market-wide GGR for 3Q19 is estimated by LVS management based on DICJ reported data and LVS management’s estimated differences between DICJ reporting and win
reported by operators in prior public filings.
2. Assumes operating profit margin of 10.0% on gross VIP revenue and a blended margin of 40% on mass table and slot gross revenue.
Source: Public company filings, Macao DICJ.
52Five Trends Supporting Growth
in the Macao Market in the Future
260 million tourists are expected to travel outside of China by 2025, up from 135
1 million in 2016. Chinese tourism expenditures are expected to increase from $261 billion
in 2016 to $672 billion by 2025
Transportation infrastructure and connectivity throughout China, especially in the
2 Pearl River Delta region, will be expanded, including through the $20 billion Hong
Kong – Zhuhai – Macao bridge, which opened on October 24, 2018
3 ~2,660 new hotel rooms are expected to open in Macao through 2020
4 Increasing length of stay in Macao
The Greater Bay Area Initiative and the development of Hengqin Island will contribute to
5 Macao’s diversification and to its further development as a leisure and business
tourism destination
Sources: Bernstein research, Haver, SAFE, Public company filings, Macao DSEC, Macao Tourism Board.
53China Is The World’s Largest and Fastest
1 Growing Outbound Tourism Market
Outbound Travel Tourism Spending
($ in US billions)
$700
$672
$600
$500 +$411 Billion
in Incremental
Spend
$400
$300
$261
$200
$100
$0
2016 2017E 2018E 2019E 2020E 2021E 2022E 2023E 2024E 2025E
Outbound Chinese Tourism Spend is Projected to Reach $672 Billion by 2025
Sources: Bernstein research, SAFE.
54China Is The World’s Largest and Fastest
1 Growing Outbound Tourism Market (cont.d)
Number of Outbound Travel Trips from China
(Trips in millions)
300
250 260
200
150
135
100
50
0
2016 2017E 2018E 2019E 2020E 2021E 2022E 2023E 2024E 2025E
In the Next 7 Years Outbound Travel From China is Projected to Reach 260 Million Trips
Source: Bernstein research, Haver.
551 Strong Growth in Chinese Outbound Tourism
Chinese Outbound Tourism to Select Markets
2010-2018
CAGR
+17% +16% +13% +13% +7% +17% +14% +12% +25% +33% +8% +11%
(in millions)
60.0
51.1
50.0
40.0
30.0
25.3
22.7
20.0
13.2
10.5
10.0 8.4
3.4 4.8
2.4 2.9 1.6 2.7 2.8 1.9
0.4 1.4 0.5 1.6 0.9 1.1 0.8 1.2 1.4 1.1
0.0
Australia Germany France Malaysia Taiwan USA Singapore Korea Japan Thailand Macao Hong Kong
2010 2018
Continued Growth of Chinese Outbound Tourism Is Expected to Contribute to the Macao Mass Tourism
Opportunity
Source: CLSA, Macao DSEC, Hong Kong Tourism Board, Bloomberg.
56Chinese Middle Class Consumption Growth
1 Chinese Middle Class Consumption in 2030 is Projected to Reach $10 Trillion
Global Middle Class Consumption in 2030
($ in US trillions)
$15.0
$10.0
$10.0
$5.0
$4.0
$2.3 $2.5
$1.1 $1.2 $1.2 $1.3 $1.4
$0.0
France Brazil Mexico Germany Russia Japan Indonesia USA China
Continued Chinese Middle Class Consumption Growth is Expected to Contribute to the Macao Mass
Tourism Opportunity
Note: Brookings Institution defines the global middle class as those households with daily expenditures between $10 and $100 per person in purchasing power parity terms.
Source: Brookings Institution, UN, World Bank, The Financial Times.
572 Infrastructure: China’s High-Speed Rail
Connecting More of Mainland China to Macao
Beijing – Guangzhou High-Speed Rail
• World’s longest high-speed rail route
• Covers 2,298km in ~10 hours
(compared to 22 hours previously)
• Provides seamless connection from
Guangzhou – Zhuhai Intercity Rail Northern China to the Macao border via
the Guangzhou-Zhuhai Intercity Rail
• Rail line connecting Guangzhou to
Zhuhai, where the Gongbei border
gate to Macao is located
Wuhan – Guangzhou High-Speed Rail
• Guangzhou is the largest city in
Guangdong province and is a key • Wuhan is the capital of Hubei Province
economic and transportation hub and one of the most populous cities in
Central China with ~10 million people
• Reduces travel time from Guangzhou
to Zhuhai from 2+ hours by bus to as
• Wuhan is an important economic and
short as 60 minutes
transportation hub in Central China
• Zhuhai station opened in Jan 2013
• HSR reduces travel time to Guangzhou
• Future link to Macao Light Rail from 11 hours by bus to under 4 hours
System by train
Hong Kong
Macao
Continued Investment in the High-Speed Rail System
Source: SCMP, New York Times, Chinatrainguide.com, LVS.
58Infrastructure: Meaningful Improvements
2 Throughout The Greater Bay Area
Guangzhou Wuhan – Guangzhou High-Speed Rail
Population: 16M
• Four hour train ride
GDP Per Capita: US$20,000
Guangzhou – Shenzhen – Hong Kong Rail
• Two hour train ride from Guangzhou to Hong Kong
Guangzhou – Zhuhai Intercity Rail Shenzhen
• 60 - 80 minute train ride (2+ hours by bus) Population: 12M
GDP Per Capita: US$27,000
China Border Gate Expansion
• Reduced average wait times on China side of border
Macao
Population: 0.6M
GDP Per Capita: US$80,900
Gongbei – Hengqin Railway
• Connects the Gongbei border crossing with Hengqin
Island Hong Kong
• Stops at Lotus Bridge crossing and ends at Population: 7.4M
Chimelong theme park (Expected completion 2019) GDP Per Capita: US$46,200
• Second phase linking Hengqin Chimelong to Jinwan
Zhuhai Airport (Expected completion 2022/2023)
Hong Kong-Macao-Zhuhai Bridge ~US$20B
Hengqin Island (opened October 2018)
• Special economic area
• Over $20B of overall investment expected
• Over 10,000 hotel rooms expected (~5,000 today) Taipa Ferry Terminal
• Phase I of Chimelong theme park opened in Jan. ‘14 • Opened June 2017
and attracted 8.5M visitors in ‘16. 20M annual visitors Existing
expected at completion of all phases Future
Source: DSEC, World Bank, Bloomberg, SCMP, Shenzen Government Online, Hong Kong Census and Statistics Department, Government of Guangzhou Municipality, Chinatrainguide.com, Analyst reports.
Note: population and GDP data from 2017.
592 The Hong Kong-Macao-Zhuhai Bridge: $20 Billion Bridge Is Vital Transportation
Infrastructure Component Increasing Connectivity in Greater Bay Area
Transportation to Macao from the Hong Kong International Airport, one of
the largest and most important transportation hubs in the region, no longer
requires a ferry or helicopter connection
Prior to project completion, no roads directly connected Zhuhai and
Macao with Hong Kong or the Hong Kong International Airport on Lantau
Island. While service by ferry boat was available between Hong Kong and
Macao, automobile traffic was required to travel via the Humen Bridge - a
200km journey of approximately four hours
Future extension of HKIA Airport Express rail line to bridge will facilitate a
more seamless transit process
Bridge Facts:
− The bridge opened for traffic on October 24, 2018
− Access to Macao is now provided via an artificial island, which
connects to the Macao peninsula
− The main structure measures 29.6 kilometers, consisting of a 22.9-
km bridge section and 6.7-km underground tunnel
− The bridge is one of the longest in the world, equivalent to more than
15 Golden Gate Bridges lined end to end
During December 2018 Through September 2019 Monthly Visitor Arrivals to Macao via the Hong Kong-
Macao-Zhuhai Bridge Averaged Approximately 500,000, ~14% of Total Visitation
Source: Xinhua, China Daily, SCMP, HZMB.hk, Macau News, Macau DSEC.
60You can also read