STUDY ON "SUSTAINABLE FINANCING FOR URBAN KARNATAKA" - Janaagraha
←
→
Page content transcription
If your browser does not render page correctly, please read the page content below

STUDY ON “ SUSTAINABLE FINANCING FOR URBAN KARNATAKA” – VIABLE OPTIONS

                      REPORT

                       STUDY ON
                       “SUSTAINABLE
                       FINANCING FOR
                       URBAN
                       KARNATAKA”
                       VIABLE OPTIONS

                                  Submitted by :
               Janaagraha Centre for Citizenship and Democracy

Supported and Monitored by :               Submitted to :
Director                                   City Managers’ Association, Karnataka (CMAK)
Directorate of Municipal Administration,   No.42, “Sanjeevini”, 1stFloor 4th Cross,
Urban Development Department, GoK          Malleshwaram, Bangalore – 03
Bangalore – 560 001                        Ph: 080-23464332/35/37
                                           www.cmakarnataka.com

                                                                                          1
ACKNOWLEDGEMENT
    We would like to thank Mr. Anjum Parwez, Secretary, Urban Development
    Department, Government of Karnataka, and Dr. Vishal R, Director, Directorate of
    Municipal Administration, Government of Karnataka for the opportunity to work on
    this study.

    We would also like to thank Ms . Sheetal Singh, Coordinator, City Managers Association,
    Karnataka (CMAK), the Commissioners/Chief Officers, Revenue Officers, Accounts
    Officers of Hubbali-Dharwad City Corporation, Davanagere City Corporation, Bidar
    City Municipal Council (CMC), Sira CMC, Yadgir CMC, Chamarajanagar CMC, Ullal
    Town Muncipal Council (TMC), Bangarpet TMC, K.R. Nagar TMC, Lingasagur TMC,
    Haliyal TMC, and Sakleshpur TMC, Mr. Rangaswamy, Deputy Director, Karnataka
    Municipal Data Society (KMDS), Mr. Shivalingaswamy, Accounts Superintendent,
    KMDS, Mr. Chidananda S, Joint Director, Development, DMA, Ms. Vijaya Lakshmi,
    CMAK and the teams from Indian Institute of Human Settlement, Institute for Social
    and Economic Change and Public Affairs Centre India for their valuable inputs to
    this project.

    About Janaagraha
    Centre for Citizenship & Democracy
    Janaagraha Centre for Citizenship and Democracy (Janaagraha) is a Bengaluru
    based not-for-profit institution that is a part of the Jana group. Janaagraha’s
    mission is to transform quality of life in India’s cities and towns. It defines quality of
    life as comprising quality of infrastructure and services and quality of citizenship.
    To achieve its mission, Janaagraha works with citizens to catalyse active citizenship
    in city neighborhoods and with governments to institute reforms to City-Systems.

2
STUDY ON “ SUSTAINABLE FINANCING FOR URBAN KARNATAKA” – VIABLE OPTIONS

      STUDY ON
      “SUSTAINABLE
      FINANCING FOR
      URBAN
      KARNATAKA”
      VIABLE OPTIONS

Author : Mathangi Chandrasekhar, Associate Manager – Advocacy & Reforms

                                                                          3
CONTENTS

     06
          INTRODUCTION

     10
          TERMS OF REFERENCE

     11
          PROJECT TIMELINE

     12
          SUMMARY OF RECOMMENDATIONS

4
STUDY ON “ SUSTAINABLE FINANCING FOR URBAN KARNATAKA” – VIABLE OPTIONS

        16
             PART 1: BRIEF FINANCIAL OVERVIEW
             OF ULBs IN KARNATAKA

        24
             PART 2: A DETAILED REVIEW
             OF OWN SOURCE REVENUES

        40
             IT INFRASTRUCTURE FOR ULBs
             IN KARNATAKA

        42
             GLIMPSES OF THE FIELD VISITS

                                                                         5
INTRODUCTION

6
STUDY ON “ SUSTAINABLE FINANCING FOR URBAN KARNATAKA” – VIABLE OPTIONS

Quality of infrastructure and services in cities is inter alia directly related to lack of availability

of adequate financial resources (for both capital and operations and maintenance expenses)

and accountability of spending such financial resources. This is particularly true in India’s

cities :

Municipal Finance Reforms therefore seek to achieve two goals with respect to our cities

1) financial self-sufficiency and 2) financial accountability. Both financial self-sufficiency

and financial accountability are key enablers of transformation in quality of infrastructure

and services.

Janaagraha has a Municipal Finance Blueprint which envisages the following six

components as pathways to accomplishing these two goals: They are listed as below :

1.   Integrated Institutional Design covering:

     a.    Integrated view of cities finances

     b.    Integrated treasury management

2. Fiscal Decentralization covering:

     a.    Widening of Municipal revenue base

     b. Rationalising transfers from state and making them more predictable

     c.    Control over tax rates and capital values, for revenue buoyancy

     d.    Independence to Municipalities for budget setting and expenditure

     e.    Greater powers to Municipalities to tap private capital

3. Revenue Optimisation covering:

     a.    Improved collection efficiencies, higher Return on Assets

                                                                                                          7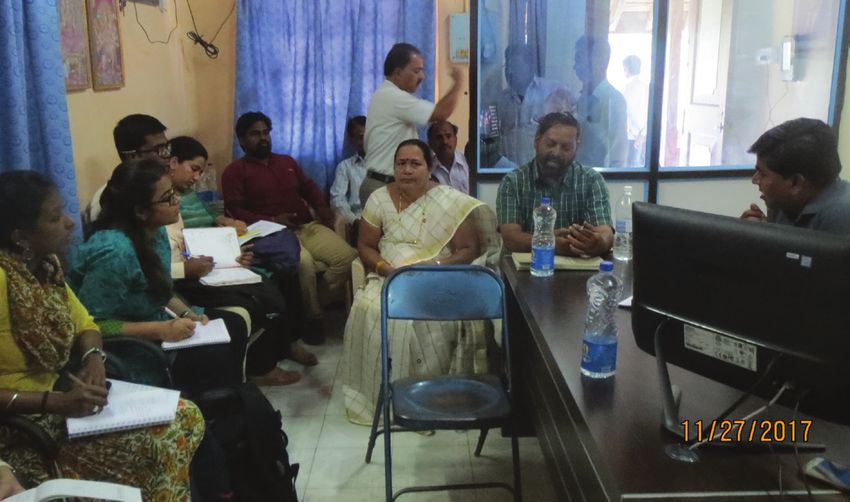
4. Fiscal Responsibility and Budget Management covering :

        a.   Robust financial reporting

        b.   Medium Term Fiscal Plans

        c.   Better quality budgets

        d.   Citizen participation in budgeting and civic works

        e.   Robust internal controls and operational risk management

    5. Transparency and Accountability covering:

        a.   Laws that enable timely publication of financial and operational information in the

             public domain; redressal mechanisms for non-compliance

    6. Institutional Capacities covering:

        a.   Availability of adequately skilled human resources particularly in revenue and

               finance functions

        b.   Information systems

    This study is based on a MoU between DMA and Janaagraha to conduct a financial
    sustainability study of Urban Local Bodies (‘ULBs’) in Karnataka and to suggest best possible
    measures for improving own revenues in a sustainable manner. The report’s primary focus
    is therefore on components 3a and 2a above while it addresses components 2b and 6a of
    the Municipal Finance Blueprint at a high level.

    The report is structured in two parts -
    •   Part 1 which includes a brief overview of finances of ULBs of Karnataka based on six
        parameters namely, own revenue as a percentage of total revenue, own revenue as a
        percentage of revenue expenditure, grants as a percentage of revenue expenditure,
        average collection period, capital expenditure per capita and cash balances maintained
        as at year end.

    •   Part 2 which includes a detailed analysis of own source revenues of ULBs, namely
        property tax, water charges/tax, income from municipal properties with specific
        recommendation on enhancement of such revenues. Part 2 also touches up on
        alternative modes of municipal revenue generation.

8
STUDY ON “ SUSTAINABLE FINANCING FOR URBAN KARNATAKA” – VIABLE OPTIONS

The study was undertaken during the period December 1, 2017 to May 31, 2018. The DMA
and Janaagraha have entered into a separate non-financial MoU to establish and run a
Revenue Monitoring and Enhancement Cell (RMEC) during the period of May 2018 to May
2020. The responsibilities of the RMEC would include but not be limited to the following:

•   Reviewing and reforming (where necessary) bases of assessments of revenue streams

•   Maximising collections of revenues

•   Reviewing and Optimising Return on Assets (RoA) of municipalities and improving
    balance sheet management

•   Establishing a process of monthly dashboards and reviews specifically with respect
    to revenue assessment and collections and based on the same, conceiving and
    recommending performance-based grants for municipalities

•   Conceiving and implementing Awards and Recognition programmes to incentivise
    Municipalities to achieve desired outcomes in respect of financial management.

                                                                                            9
Terms of
              Reference

     The specific terms of reference as agreed under the MoU include
     preparing a financial sustainability blueprint for ULBs in Karnataka
     covering actionable and practical recommendation as mentioned
     below:
     1.   Reviewing   and   reforming   (where   necessary)   bases   of
          assessments of revenue streams
     2. Maximizing collections of revenues
     3. Reviewing and optimizing return on Assets on balance sheets
          of ULBs
     4. Evaluating the need for establishing a process of monthly
          dashboards and reviewmechanism

10
STUDY ON “ SUSTAINABLE FINANCING FOR URBAN KARNATAKA” – VIABLE OPTIONS
PROJECT
TIMELINE
Preliminary
Final
analysis of data
report and
and feasibility
presentation
study
of findings
DEC 17 JAN 18 FEB 18 MAR 18 APR 18 MAY 18 JUN 18
ONWARDS
Field Visits Jointly
Submission of
to 12 ULBs to implement
the inception
actionable
collect data report and
outcomes from
and conduct discussion for
the study, as
interviews with inputs from
part of the
the ULB staff the DMA
second MoU
A team from Janaagraha visited the following 12 ULBs for a field study
1. Hubbali-Dharwad City Corporation 7. Ullal TMC
2. Davangere City Corporation 8. Bangarpet TMC
3. Bidar CMC 9. K.R. Nagar TMC
4. Sira CMC 10. Lingasagur TMC
5. Yadgir CMC 11. Haliyal TMC
6. Chamarajanagar CMC 12. Sakleshpur TMC
11SUMMARY OF
RECOMMENDATIONS
12STUDY ON “ SUSTAINABLE FINANCING FOR URBAN KARNATAKA” – VIABLE OPTIONS
1 Enumeration of Properties
Observations
• The last property enumeration process carried out across ULBs in Karnataka was
between 2009 and 2011. The ULBs do not have a process of re-evaluating this number
using alternative proxies.
• Therefore, the property tax demand estimated is not supported by updated property
data.
Recommendations
• Since the enumeration was last performed in 2011 and continuous updation of records
has not taken place since, a re-enumeration exercise is overdue and the property data
could be updated using Geographic Information System (‘GIS’) applications. Given that
the DMA has already initiated the process of re-enumeration, we are hopeful that the
exercise will be conducted in a robust manner.
• Further, all properties enumerated or new properties subsequently registered must be
assigned unique but universal PID number that can be used to track properties with
ease, across various systems in the Government.
• The ULBs must also explore and identify appropriate proxies such as electrical
connections, occupancy certifications, or property registration data to help update
property details in case of new properties or modification of properties in the city.
2 Assessment of Property Tax
Observations
• As per the SAS rules, 2002, the taxable capital value to be considered was restricted to
50% of guidance value of 2005-2006 and therefore, the taxable capital value remains
unchanged year on year. To offset this, there is a provision in the act to revise the property
tax rates once every three years within a band of 15% to 30%.
Recommendations
• Since property tax is meant to be levied on the value the property, the current guidance
value would be a more appropriate representative of the true value of the property.
• Therefore, it is recommended that the DMA commission a study to evaluate the
impact on property tax revenue if the same is pegged against the current guidance
value instead of the guidance value of 2005-2006. They could also re-evaluate the rate
revisions required when the latest guidance value is then used.
133 Improving Collection Efficiencies
Observations
• Collection efficiencies of primary revenue sources such as property tax and water
charges averaged at 62.7% and 55.3% during 2016-17, respectively.
• It was also observed that there was a large deficit in the number of required bill collectors
in the revenue department that averaged at 36% across 268 ULBs.
Recommendations
• Though we were unable to establish a direct correlation between the number of bill
collectors and collection efficiency, in the current ecosystem, the bill collectors are the
primary enablers of tax collection across Karnataka.
• Therefore, the gap of 36% in bill collector strength across the ULBs in Karnataka must
be addressed. However, increasing the number of employees on the roles of the ULBs
increases the liability in terms of pension costs for the ULB.
• Alternatively, ULBs could engage with an agency to facilitate collections through digital
channels only, actively leveraging tele calling, instead of bill collectors going on a door
to door campaign to give payment remainders. The agency hired is to be paid only a
percentage of tax collected through the digital channels.
4 Monetising Municipal Properties
Observations
• None of the 12 ULBs visited, nor the Karnataka Municipal Data Society were able to
provide a detailed listing of municipal properties owned/leased and therefore, the
revenue potential from municipal properties owned is yet to be completely evaluated.
Recommendations
• As step one, the ULBs must update records of properties along with status of properties
leased out. Secondly, in order to assess the revenue potential from properties owned by
municipalities, the ULBs could opt to engage a Property Management Company (PMC)
to conduct a study on such properties.
14STUDY ON “ SUSTAINABLE FINANCING FOR URBAN KARNATAKA” – VIABLE OPTIONS
5 Information and Performance Review Systems
Observations
• The Karnataka Municipal Data Society (KMDS) maintains several online information
systems that include - Fund Based Accounting System (FBAS), Monthly Information
Booklet (MIS system), Property Tax Information System, Property Tax Calculator, SLB
data, Official Vacancy position data, Asset Management System, to name only a few.
• Several issues in the systems maintained include :
(i) The FBAS system does not include a state level database.
(ii) The performance MIS system is not updated or reviewed regularly.
(iii) The Asset Management register has not been updated since 2006 for most ULBs in
Karnataka.
(iv) Multiple systems have been built to manage property tax data and none of the
systems are interconnected.
Recommendations
• Currently, the DMA does not have a robust, centralised performance review system.
Therefore, we recommend that the KMDS build a state level dashboard that is both
linked to the FBAS and the MIB and the DMA must ensure a robust review system is
put in place.
• Further, despite having first mover advantage on launching e-governance as early as
in 2006, the IT systems in Urban Karnataka managed by KMDS have several platforms
remaining unused and multiple platforms addressing the same issue. Therefore, we
recommend that the KMDS conduct a technical due diligence study of all the systems
built and make necessary amends, including building a robust performance tracking
mechanism.
15PART 1: BRIEF FINANCIAL
OVERVIEW OF ULBS IN
KARNATAKA
16STUDY ON “ SUSTAINABLE FINANCING FOR URBAN KARNATAKA” – VIABLE OPTIONS
Karnataka has 10 City Corporations (CCs, excluding BBMP), 56 City Municipal Councils
(CMCs), 115 Town Municipal Councils (TMCs) and 89 Town Panchayats (TPs) across 30
districts. The CCs are governed by the Karnataka Municipal Corporations Act, 1976 while the
rest are covered under the Karnataka Municipalities Act, 1964.
Population by division and type of ULB
CC CMC TMC TP Total
Division
Population
Population
Population
Population
Population
No. of
No. of
No. of
No. of
No. of
ULBs
ULBs
ULBs
ULBs
ULBs
Mysore
2 18,09,454 11 9,48,869 24 6,90,747 19 2,66,344 56 37,15,414
Divison
Belagavi
3 15,17,740 13 10,27,430 40 12,21,295 40 6,42,971 96 44,09,435
Division
Gulbarga
2 10,88,688 12 12,44,298 26 7,49,422 16 2,81,168 56 33,63,576
Division
Bangalore
3 9,63,564 20 16,10,330 23 6,72,226 14 2,40,741 60 34,86,861
Division
Total 10 53,79,446 56 48,30,927 113 33,33,690 89 14,31,223 268 1,49,75,286
35.9% 32.3% 22.3% 9.6% 100%
Source: DMA & JCCD analysis
Note: Note: ULB information updated to the extent of data available; Population figures above are from 2011 Census
Population numbers adjusted for urban population growth rate up to 2017 as per report issued by Directorate of
Economics and Statistics. All analysis in this report excludes BBMP.
The following parameters were analysed to provide a deeper understanding of the
financial situation of ULBs in Karnataka:
1 Components Of Revenue
Revenues of ULBs in Karnataka primarily include:
i. Property tax (13.8% of total revenue in 2016-17)
ii. Other taxes include advertisement tax, toll taxes (0.7%)
iii. Fees & user charges (12.2%)
iv. Other non-tax revenues include income from renting of municipal properties (3.4%)
v. Other revenue receipts which primarily include income from investments, interest
income etc (3.1%)
vi. Transfers, Grants and Assigned revenues, which are funds received from the state/
centre in the form of tied/untied grants (66.7%)
For the purpose of our analysis, we have segregated the above mentioned revenue streams
into two groups.
• Own revenues (revenue sources devolved to the ULBs as per the municipalities Act)
including property tax, other taxes, fees & user changes, and other non-tax revenues
• Ancillary revenues (revenue sources that are either not operational in nature or are
transferred from the Centre/State governments) including transfers, grants & assigned
revenues and other revenue receipts
17Components of Revenue
63% 71.5% 66.7% Transfers/Grants
Other Revenue Receipts
4.4% 3.1%
3.4%
Other non-tax revenue
Fees & User charges
3.1% 3.4%
16% 2.9% Other tax
12.2%
10.4%
0.6%
0.5%
0.7% Property tax
12.8% 11.2% 13.8%
2014-15 2015-16 2016-17
Source: Receipts and payments statement of ULBs
• On average, 67.1% of total revenues recorded in ULBs across Karnataka are assigned
revenues, grants and aids received from the centre/state and only 29.3% of total revenues
are own revenues of the ULB.
Components of Revenue in CCs Components of Revenue in CMCs
51.2% 63.9% 54.4%
3.5%
3.4% 69.0% 75.4% 72.5%
2.6% 3.7%
3.0%
17.7% 5.3%
2.2% 2.6%
24.6% 13.7% 3.2% 3.7%
0.5% 3.1% 3.4%
0.9% 0.8% 11.2% 10.5%
17.3% 0.2% 8.9% 0.3%
15.9% 20.7% 0.1%
11.2% 8.7% 10.7%
2014-15 2015-16 2016-17 2014-15 2015-16 2016-17
Components of Revenue in TMCs Components of Revenue in TPs
76.6% 75.6%
74.4%
75.0% 78.2% 75.3%
3.6% 2.6% 2.8%
4.1% 3.5% 3.3% 7.8% 4.5% 3.1%
8.5% 7.6% 7.8% 3.1% 3.3% 5.2%
0.6% 0.5% 0.9% 7.0% 7.4% 6.9%
8.2% 7.6% 9.9% 0.8% 1.1% 2.4%
6.8% 7.1% 6.8%
2014-15 2015-16 2016-17 2014-15 2015-16 2016-17
Source: Receipts and payments statement of ULBs
18STUDY ON “ SUSTAINABLE FINANCING FOR URBAN KARNATAKA” – VIABLE OPTIONS
• Contribution of transfer, grant-in-aid and assigned revenue to total revenue is
increasing with the decreasing size of the ULBs and the dependency on key revenue
sources such a property taxes is as low as 6.9% in TPs as per the charts above.
• These trends indicate that ULBs across Karnataka are significantly dependent on
grants from the Central and State governments as a primary source of revenue.
2 Own Revenues as a Percentage of Total Expenses
In order to evaluate the extent of self-sufficiency in ULBs across Karnataka, we have
analysed own revenues as a percentage of total revenue expenses (‘own revenue
percentage’). Revenue expenses include salary expenses & other establishment related
expenses (32.5% of total revenue expenses in 2016-17), O&M expenses (54.1%) and other
incidental operational expenses like office electricity cost, postage costs etc (13.4%).
Own revenue % across ULB type
2014-15 2015-16 2016-17
ULB Own Rev. Own Own Rev. Own Own Rev. Own rev
Type Rev. expenses rev % Rev. expenses rev % Rev. expenses %
CC 60,813 79,057 76.9 54,328 98,429 55.2 64,203 105,537 60.8
CMC 23,206 49,539 46.8 28,006 64,560 43.4 31,247 65,326 47.8
TMC 13,522 35,877 37.7 16,792 42,498 39.5 0,814 44,150 47.1
TP 4,560 12,210 37.4 5,895 13,539 43.5 8,506 15,190 56.0
Total 102,101 176,682 57.8 105,022 219,026 47.9
124,770
230,203 54.2
Source: Receipts & Payments statement of ULBs
• Across 269 ULBs considered for the above analysis, on an average across three
years, only 53.3% of day to day operations are funded by the ULB’s own revenue
sources, indicating significant dependency on state and central funds for not only
infrastructure funding, but also for operational expenses.
• This trend is the lowest at the TMC and TP levels, where own revenues fund only
43.5% (average) of operational expenses of ULBs.
• The sharp decline in own revenue % of CCs in 2015-16 was driven by an abnormal
increase in fees and user charges of Hubbali-Dharwad in 2014-15, which subsequently
stabilised in 2015-16.
19• Own revenue percentage has increased by 54.2% in 2016-17 f rom 2015-16 across ULB
types, primarily driven by an increase in revenue f rom property taxes. However, we
are unable to confirm if such increase is sustainable, as the ULBs were unable to
provide specific reasons for the increase.
• This is a clear indication of an urgent need for a performance MIS mechanism couple
with a robust review system at the DMA.
No. of ULBs in each own revenue% bucket %
Bucketing 2014-15 2015-16 2016-17 2014-15 2015-16 2016-17
1 - 10% 9 4 4 3.6 1.5 1.5
10 - 25% 64 64 56 25.4 24.3 21.0
25 - 50% 117 123 110 46.4 46.8 41.2
50 - 75% 37 42 63 14.7 16.0 23.6
75 - 100% 12 9 16 4.8 3.4 6.0
> 100% 13 21 18 5.2 8.0 6.7
Total 252 263 267 100.0 100.0 100.0
Source: Receipts and Payments Statement of ULBs
• From the table above, on an average, 45% of the ULBs in Karnataka have own
revenues ranging between 25% and 50%. Both the 1-10% and > 100% bucket primarily
consists of TMCs and TPs, thus indicating the unpredictability of revenues across the
smaller ULBs.
• In order to maximise the utilisation of existing buoyant sources of revenue, the ULBs
must specifically focus of revenue enhancement of the 60 ULBs in the 1-10% and 10-
25% bucket.
3 Grants, transfers and assigned revenues
To evaluate the extent of dependency on grants, transfers and assigned revenues
(collectively known as ‘revenue grants’, ‘grants’) f rom Central and State Governments to
fund operational expenses, we have compared the same with total revenue expenses of
the ULBs as shown in the table below :
Revenue expenses vs Revenue grants by ULB type (Rs in lakhs)
2014-15 2015-16 2016-17
Rev. Rev. Rev.
ULB Type Rev exp. % Rev exp. % Rev exp. %
grants grants grants
CC 79,057 68,669 86.9 98,429 1,06,550 108.3 1,05,537 83,336 79.0
CMC 49,539 62,274 125.7 64,560 1,01,190 156.7 65,326 91,305 139.8
TMC 35,877 47,356 132.0 42,498 68,353 160.8 44,150 71,422 161.8
TP 12,210 19,082 156.3 13,539 23,915 176.6 15,190 30,284 199.4
Total 1,76,682 1,97,381 111.7 2,19,026 3,00,009 137.0 2,30,203 2,76,347 120.0
Source: Receipts and payments statement of ULBs
20STUDY ON “ SUSTAINABLE FINANCING FOR URBAN KARNATAKA” – VIABLE OPTIONS
• Except in CCs, all the other categories of ULBs receive revenue grants greater than
the overall operating expense they incur on a yearly basis (without any adjustment
towards expenses covered by own revenue sources). We were informed that, the
excess untied revenue grants received are usually re-directed for capital projects. But
there is no system currently that tracks such utilisation by the nature of the scheme,
reiterating the need for a performance MIS with a robust review mechanism at the
DMA.
G
4 Day sales outstanding
D
Analysis of day sales outstanding (DSO) is used to estimate the average collection period
and aids in understanding the overall collection efficiencies of ULBs. B
B
Average DSO across ULB types
D
ULB Type 31-Mar-15 31-Mar-16 31-Mar-17
M
CC 302 325 291
CMC 365 315 298 B
TMC 301 304 297 Tu
TP 371 368 343
D
Average 335 328 307
Source: Financial Statements from the FBAS systems of the ULBs K
K
• The average collection period for all sources of revenue other than grants ranges
at an average of 307 days to 335 days over three years. This indicates that, at every S
year end, ULBs have approximately 300 days of uncollected revenue accumulated D
as receivables.
B
• This brings to light the poor collection efficiencies of the ULBs across Karnataka
which could be on account of incorrect assessment and billing, inefficient modes of
collections or insufficient manpower to support the collection process.
• Refer subsequent sections of the report for a detailed discussion on collection
efficiency.
215 Capital expense per capita
Analysis of capital expense per capita would help evaluate the inf rastructure
development across ULBs in Karnataka.
Cap. Exp. Per capita
Capital exp (Rs in lakhs) Per capita (Rs)
ULB No of ULBs Population FY17 FY16 FY17 FY16
CC 9 49,81,216 69,584 83,629 1,397 1,679
CMC 43 37,99,183 43,582 68,452 1,147 1,802
TMC 91 27,48,957 37,809 39,270 1,375 1,429
TP 41 6,65,815 13,278 16,808 1,994 2,524
Total 184 1,21,95,171 1,64,253 2,08,159 1,347 1,707
Source: Financial Statements from the FBAS systems of the ULBs; Population projected for 2017 as per the Directorate
of Economics & Statistics
• The average per capita capital expense for the 184 ULBs analysed above amounted
to Rs 1,707 during 2015-16 and Rs 1,347 during 2016-17, with the CCs averaging at Rs
1,679 and Rs 1,397 during 2015-16 and during 2016-17, respectively. This is significantly
lower than the average per capita capital expense across the 23 cities surveyed as
part of the Annual Survey of India’s City Systems Report (2017 edition) of Rs 2,268.
• What is interesting however, is the per capita capital expense of TPs, which seems
to be the highest among the ULB types, indicating that a significant amount of
infrastructure work is happening in the TPs.
22STUDY ON “ SUSTAINABLE FINANCING FOR URBAN KARNATAKA” – VIABLE OPTIONS
6 Cash and bank balances
As mentioned earlier, on an average, the revenue grants received by ULBs across Karnataka
are higher than their operational expenses for the year. It is therefore, extremely relevant
to analyse the cash balances maintained by ULBs in order to evaluate the extent of
accumulation of grant money.
Cash & bank balances as % of revenue grants received (Rs in lakhs)
Cash and bank balances Revenue Grants %
ULB No of 31-Mar 31-Mar 31-Mar 31-Mar 31-Mar 31-Mar 31-Mar 31-Mar 31-Mar
Type ULBs 2015 2016 2017 2015 2016 2017 2015 2016 2017
CC 10 98,854 1,36,954 1,18,941 68,669 1,06,550 74,732 143.96 128.53 159.16
CMC 48 66,011 86,469 84,094 53,256 85,685 65,089 123.95 100.92 129.20
TMC 95 78,021 1,89,343 1,53,777 45,368 66,955 62,928 171.97 282.79 244.37
TP 31 16,421 18,910 20,369 10,001 12,988 14,853 164.19 145.59 137.14
Total 184 2,59,307 4,31,676 3,77,181 1,77,295 2,72,178 2,17,603 146.26 158.60 173.33
Source: Cash & Bank balance – FBAS; Revenue grants – Receipts and payments statements
• Out of the data provided for 184 ULBs, we observe that cash and bank balances
maintained by ULBs across the state are higher than the grant amounts received in
that year.
• The capital grants received by ULBs for infrastructure purposes could also contribute
to such accumulation of balance. What is alarming is that as at 31st March, 2018, 184
ULBs in Karnataka have Rs 3,771 crores of un-utilised cash in the bank (assuming that
none of them are on lien). Similar such balances were maintained in the previous
years.
• Representatives from the DMA claim that due to delay in execution of projects, the
grants have accumulated in the bank accounts. They believe that since most of such
balances are deposited in PD accounts, the utilisation of these grants is monitored.
• However, this calls for a monthly review of the cash balance maintained by ULBs
to first establish if such accumulation of cash exists throughout the year. Further,
the review system, through a performance MIS, should also help to ensure optimal
return on ideal cash balances that have been accumulated.
23PART 2: A DETAILED
REVIEW OF OWN
SOURCE REVENUES
24STUDY ON “ SUSTAINABLE FINANCING FOR URBAN KARNATAKA” – VIABLE OPTIONS
1 Property tax
Property tax continues to remain the primary own source revenue of ULBs all over the
India. As for ULBs in Karnataka, property tax contributes to 48.6% of total own revenues.
For the purpose of analysis, we have analysed property tax administration in three
segments:
1. Enumeration
2. Assessment & Billing
3. Collections
1. Enumeration
Objective
To evaluate the accuracy of property base maintained by the ULBs.
Work done
• We have reviewed the respective sections of the Act and the taxation rules that
define the method of enumerationand the nature of records to be maintained
by ULBs.
• Interviewed Revenue Officers at the 12 ULBs during field visits to understand
the nature of records maintained, and the process of enumeration and
updation of property records.
• We have verified the manual property tax registers maintained by the ULBs.
Observations
• The last property enumeration process carried out across ULBs in Karnataka
was between 2009 and 2011. The ULBs do not have a process of re-evaluating
this number regularly using proxies such as occupancy certificates.
• Updated digitised record of properties by their Property Identification Number
(PID numbers) was not maintained across the ULBs visited as part of the field
study.
• The ULBs have multiple systems to keep track of properties namely, Property
Tax Information System (an online property tax register), E-Aasthi (an online
system to generate challans) and Property Tax Calculator (an alternative online
portal to compute tax and generate challans). But none of these systems are
linked to each other and parallelly store varied data.
25Recommendations
• Fresh enumeration exercise required - A f resh enumeration exercise is overdue
and the property data must be updated using Geographic Information System
(‘GIS’) applications. Further, changes/updates in the property details must be
periodically updated (e.g - once every three years) by identifying appropriate
proxies that reflect the construction of new properties/modifications to existing
properties in the city.
• Property tax register to be updated – The multiple online property tax
systems maintained currently are not linked to each other and are also not
updated regularly. Therefore, we recommend that the ULBs maintain a single
online property tax register encompassing details of property (identified by
its PID number or Katha number) along with measurements of the property,
photos if any of the field survey, property wise demand, historical payments,
and arrears. Further, the taxation rules prescribe formats (Form II and Form III)
for property tax returns and property tax registers, but there is no requirement
for the same to be maintained digitally. Therefore, the taxation rules must be
appropriately amended to insist maintenance of records online.
2. Assessment & Billing
2.1 Assessment
Objective
• To evaluate the process of assessment by analyzing the method of computation
of property taxes across ULBs to ensure its completeness and accuracy.
Work done
• Reviewed relevant sections of Karnataka Municipal Corporation Act, 1976
(KMCA, 1976), Karnataka Municipalities Act, 1964 (KMA, 1964), Karnataka
Municipalities Taxation (Amendment) Rules, 2002
• Interviewed Revenue Officers Accountants and Bill Collectors during the field
visit of 12 ULBs
• Interacted with officers of the KMDS who manage the Property Tax Calculator
system.
26STUDY ON “ SUSTAINABLE FINANCING FOR URBAN KARNATAKA” – VIABLE OPTIONS
Observations
• As per section 108 of the KMCA, 1976, and section 102 of the KMA, 1964, the
taxable value of the building, together with the land occupied by it, shall be
assessed having regard to the market value guidelines of properties published
by the Government under section 45B of the Karnataka Stamp Act, 1957. The
taxable capital value of the building shall be 50% of the market value guidelines
prescribed, minus depreciation at the time of assessment as may be notified.
Similar rules have been prescribed for arriving at the taxable capital value of
vacant land.
• Further, as per Rule 5 of Karnataka Municipalities Taxation (Amendment)
Rules, 2002, the taxable value must be determined as per the Karnataka Stamp
Act and as prevailing immediately before the last date for filing return – on or
before thirtieth day of June every year.
• However, as per the Self-assessment Scheme (“SAS”), introduced in 2002, the
taxable capital value to be considered was restricted to 50% of the guidance
value of 2005-06. Therefore, the taxable capital value remains unchanged year
on year and that is then compensated by revision of rates once every three
years within a band of 15% to 30% as per section 102A of the KMA, 1964. However,
during the course of this study, we were not provided a copy of the SAS rules.
• Sections 108 of the KMCA, 1976 and 101 of the KMA, 1964, prescribe the property
tax rates that shall be levied based on the nature of properties, in a municipal
area. Further, these rates can be revised by council, once every three years
within a band of 15% - 30%.
Historical property tax rate enhancement trends (%) by ULB Type
Year of change Category CC CMC TMC TP Average
2008-09 (% of propertyTax in- Residential 16.0 20.2 19.8 17.3 19.1
creased) Commerecial 22.9 21.7 20.3 18.8 20.3
2011-14 (% of propertyTax in- Residential 16.4 18.3 18.9 17.6 18.4
creased) Commerecial 20.8 19.8 20.2 19.4 20.0
2014-15 (% of propertyTax in- Residential NA NA NA NA NA
creased) Commerecial 21.9 20.7 20.0 20.2 20.3
2017-18 (% of propertyTax in- Residential 15.0 18.9 19.2 19.1 18.2
creased) Commerecial 17.5 21.5 21.9 21.6 20.7
Residential 15.8 19.1 19.3 18.0 18.6
Average
Commerecial 20.8 20.9 20.6 20.0 20.3
Source: KMDS data
27• The average rate increase every three years for residential properties amounted to 18%,
while that of commercial properties was higher at an average of 20% (subject to availability
of rate enhancement data for 2014-15).
Recommendations
• Alternative methods to compute property tax – As discussed above, currently
the guidance value of 2005-06 is considered with depreciation charged only up to
2005-06. Guidance value plays a major role in the determination of property tax.
The objective with which the guidance value is used to arrive at property tax is that
guidance value is expected to be representative of the current market value of the
property. Based on the examples depicted in the table above, if the guidance value
considered for the computation is linked to the latest value as per Kaveri online (an
online database of latest sub-registrar values maintained by GoK), the ULBs might
stand to benefit in the range of 20 – 35% (based on the scenario 1 below). The ULBs
could also exercise the option of enhancing rates (probably at ranges lower than 15%
- 30%), over and above basing the computation on the latest guidance value after
evaluating its feasibility. Therefore, we recommend that the ULBs investigate the
option of linking the property tax computation with the latest guidance and review
the provisions of the SAS Rules that were introduced in 2002.
28STUDY ON “ SUSTAINABLE FINANCING FOR URBAN KARNATAKA” – VIABLE OPTIONS
Alternative methods of computing property tax for 2018 - An Illustration
As per Property tax Scenario 1 Scenario 2
calculator
Year of con-
2000 2016 2000 2016 2000 2016
struction
Chowki Pete Chowki Pete Chowki Pete Chowki Pete Chowki Pete Chowki Pete
Area
Road Road Road Road Road Road
Floor no 1 1 1 1 1 1
Built up Area 2000 2000 2000 2000 2000 2000
Use of property Residential Residential Residential Residential Residential Residential
Construction
RCC-Grnt-Tk RCC-Grnt-Tk RCC-Grnt-Tk RCC-Grnt-Tk RCC-Grnt-Tk RCC-Grnt-Tk
Type
Guidance value
500 500 1,270 1,270 1,270 1,270
Rs/Sq Ft
Type Tenanted Tenanted Tenanted Tenanted Tenanted Tenanted
Depreciation
0.04901 0 0.176436 0.019604 0.176436 0.019604
factor
Capital value of
4,75,495 5,00,000 10,46,124 12,45,338 10,46,124 12,45,338
land
Base Rate 0.60% 0.60% 0.60% 0.60% 0.60% 0.60%
Enhancement
2008-2009 1.1667 1.1667 1 1 1.1667 1.1667
2011-2012 1.2 1.2 1 1 1.2 1.2
2014-2015 1.15 1.15 1 1 1.15 1.15
2017-2018 1.15 1.15 1 1 1.15 1.15
Base property
5,282 5,555 6,277 7,472 11,622 13,835
tax
Difference 994.3 1917.4 6339.3 8280.2
Difference % 19% 35% 120% 149%
Source: Property tax calculator and JCCD analysis
Definition of methods of computation
1. Property tax calculator: Guidance value of 2005-06 considered; Depreciation
charged only up to 2005-06; Effect of all four rate enhancements considered
2. Scenario 1: Latest guidance value as per Kaveri Online considered; Depreciation
charged up to 2018; Effect rate enhancements not considered
3. Scenario 2: Latest guidance value as per Kaveri Online considered; Depreciation
charged up to 2018; Effect of all four rate enhancements considered
29• Further, we have noted that the latest guidance value for ULBs across Karnataka is
significantly lower than the prevailing market price. (Refer table below). Therefore,
the DMA must further investigate the reasons for differences and accordingly
advocate for the revision of the guidance value.
Latest Guidance Values vs Market Price
Latest Market price as per Difference
City Area Average
Guidance value 99acres.com (Rs) %
Mysuru Bogadi 1,858 3,600 93.76 19.1
Hubli Shakti Colony 1,765 6,250 254.08 20.3
Mangaluru Jeppinamogaru 790 4,074 415.91 18.4
Source: Guidance value – Kaveri Online
Note -The market value considered is an average of market value of 3 similar properties in the area. The nature of
properties considered to arrive at the latest guidance value and the market value are similar.
• Alternative basis to compute property tax – Historically, property tax was
introduced as a user charge for public services provided. Internationally as well
as in India, property tax has proven to be a complex tax to administer on ground.
Given that Karnataka has been on the forefront of municipal reforms, the DMA
should consider commissioning a study to revisit the methodology of property
tax fundamentally through alternative bases that are easier to administer and
possibly more buoyant.
2.2 Billing
Objective
• To evaluate the billing process of property tax across ULBs to ensure accuracy and
completeness.
Work done
• Interacted with Revenue Officers and Bill Collectors across the 12 ULBs to
understand the process and controls in place.
• Reviewed the records maintained by the ULBs.
• Reviewed relevant sections of the KMA, 1964 and the KMCA, 1976 along with rules,
if any as applicable.
30STUDY ON “ SUSTAINABLE FINANCING FOR URBAN KARNATAKA” – VIABLE OPTIONS
Observations
• Under the self-assessment scheme, the tax payers (with or without PID numbers)
file their property tax return and declare the basis of their assessment. The revenue
officers claim that a random check of 10% of properties takes place every year.
However, there is no documentation to support such a claim.
• Further, Hubbali-Dharward is one of the few ULBs that has more than one
collection centre. For all the other ULBs, the Municipality office is the primary and
only collection centre. Once the return is filed at the office, a challan is generated
and a copy of the same must be submitted at the designated bank while making
the payment. Once the payment is made, the receipt provided by the bank must
be then submitted at the office by the tax payer. This process does not make
payment of property tax easy for citizens and could potentially be one of the
reasons why citizens are not forthright in payment of property tax.
Recommendations
• Review of the self-assessment scheme – Since the introduction of the self-
assessment scheme in 2002, limited checks have been put in place to verify the
declaration of tax payers. The ULBs claim that 10% of declarations made under
the SAS each year are verified. However, thereis no documentation to support the
same.
Therefore, there is a need for a robust system to be put in place to verify the
declaration of the tax payers in order to regulate any potential underassessment.
ULBs must evaluate and adopt a scientific method of selecting the 10% sample
that also takes into consideration the value of properties. Further, an appropriate
audit trail of such a verification process must be maintained.
• Increase in number of billing centres and support online bill creation–Up to
Mar18, all challans for property tax payment were raised at the ULB office or the
collection centres (in case of CCs). Therefore, the citizen was required to come to
the ULB office for the challan and subsequently make the payment at the bank.
We believe that the billing and payment process must be simplified such that
payment can be made at the same place where the challan is generated via debit/
credit card payments. We understand that the KMDS has launched a new online
platform called ‘e-sweekruthi’ for a few CCs, where the challan is raised online and
the payment can also be made online. This is a step in the right direction for ULBs
and we urge that the ‘e-sweekruthi’ be open to all ULBs across the state.
313. Collections
Objective
• To analyse the collection patterns of ULBs and suggest ways to improve the same.
Work done
• We have analysed the demand - collection balance (DCB) of property tax collection
across ULBs and also analysed staff vacancies of the corresponding ULBs.
• We have interviewed Revenue Officers and Bill Collectors of the 12 ULBs as part of
the field visit to understand the operational difficulties in the collection process.
Observations
Collection as a percentage of demand by ULB type
ULB Type 2012-13 2013-14 2014-15 2015-16 2016-17
CC 43.6 41.1 41.8 42.1 45.2
CMC 73.2 72.1 76.1 77.0 81.5
TMC 78.5 79.2 78.4 76.4 82.1
TP 82.1 83.3 74.4 73.3 77.7
Total 59.0 55.7 57.3 58.2 62.7
Source: Data provided by ULBs from FBAS
Collection as a percentage of demand by division
ULB Type 2012-13 2013-14 2014-15 2015-16 2016-17
Bangalore Division 79.3 75.9 74.9 72.6 74.5
Belagavi Division 68.5 67.2 67.9 74.6 78.1
Gulbarga Division 71.4 76.1 80.2 80.6 93.0
Mysore Divison 39.0 35.3 37.0 36.6 40.6
Total 59.0 55.7 57.3 58.2 62.7
Source: Data provided by ULBs from FBAS
• On an average, collection efficiencies at CCs are the lowest at 42.8%, while the
others averaged at 77% over the past five years.
• Further, on a region wise break down of collections, it is evident that ULBs in the
Mysore Division have the lowest collection efficiency.
• However, it is important to note that the demand figure used to arrive the
collection percentage has no scientific basis. The ULBs usually apply a flat growth
% (of around 10%) from the previous year’s demand.
• Due to the non-availability of updated property information, we are unable to
comment on the extent of deviation of actual demand from the demand forecast
by the ULB.
32STUDY ON “ SUSTAINABLE FINANCING FOR URBAN KARNATAKA” – VIABLE OPTIONS
Bill collector vacancy position by ULB Type
Sanction
ULB Type Vacant Posts %
Strength
CC 375 168 44.8
CMC 291 90 30.9
TMC 203 58 28.6
TP 49 11 22.4
Total 918 327 35.6
Source: Data provided by ULBs
• Bill collector vacancy percentage was highest in CCs, at 44.8%.
• Though we were unable to establish a direct correlation between bill collector
vacancies and collection efficiencies in ULBs, bill collectors are a major part of the
billing and collection process. Therefore, large vacancies as mentioned above are
bound to have an impact on the collections of ULBs.
Recommendations
• Increase the number of Bill Collectors - Bill collectors play a major role in driving
the collection efficiencies of ULBs. Therefore, the gap of ~36% in bill collector
strength across the state must be addressed.
Further, the DMA must also review the C&R rules against country wide best
practices such as Greater Hyderabad Municipal Corporation, where for every 3000
households, 1 bill collector is recruited. Additionally, a report by ICF GHK in 2014
on the approach towards establishing municipal cadres in India suggests that for
every 4000 to 5000 households, 1 bill collector must be recruited.
• Collection through digital channels – Alternatively, the ULBs could engage
with an agency to facilitate collections through digital channels only, actively
leveraging tele calling, instead of bill collectors going on a door to door campaign
to give payment remainders. The agency hired is to be paid only a percentage
of tax collected through the digital channels. This is a tried and tested method
across the private sector such as in banks, insurance companies. The diagram
below depicts the role of each stakeholder under this scheme -
33Payment to
Agency on
Reminders / Payment perfor-
Enumera- through mance on
Self Verification follow up
tion of all Mobile App tax collec-
Assessment of Self through
properties / Online or tion = % of
○ Of proper- ○ Assessed ○ tele-calling, ○ ○
with cash (at collection
ties properties prioritising paid
contact ULB office
for digital through
numbers only) digital
channels
channels
AGENCY CITIZEN RO at ULB AGENCY CITIZEN ULB
2 Income from Municipal Properties
Income from Municipal Properties refers to the income received by Municipalities on
renting out shops and other properties for commercial purposes.We have categorised the
discussion of income from municipal properties into :
1. Enumeration
2. Assessment & Collections
1. Enumeration
Objective
• To evaluate the method by which the properties owned by Municipalities are
enumerated in order to recognize revenue from the same.
Work done
• Interacted with Revenue Officers and Bill Collectors across the 12 ULBs to
understand the process and controls in place.
• Reviewed the rules of the KMABR, 2006 related to recording of fixed assets
including municipal properties.
Observations
• As per Rule 87 of the Karnataka Municipal Accounting and Budgeting rules, 2006,
(KMABR) the municipalities must maintain fixed asset registers comprising of land,
buildings and all other infrastructure, immovable and movable properties which
belong to the municipality. These registers must be maintained category wise in
respect of lands, buildings, etc., and fund wise.
• Following this rule, KMDS in 2006 built an Asset Management System, where in
ULBs were to update and maintain the fixed asset register. Based on the test check
performed on the 12 ULBs, we have noted that none of their fixed asset registers
were up to date. Track of municipality properties leased out and details of such lease
agreements were not maintained independently by the ULBs.
34STUDY ON “ SUSTAINABLE FINANCING FOR URBAN KARNATAKA” – VIABLE OPTIONS
• Recommendations
Update fixed asset register up to date – In order to first track the properties that
the ULB owns and has leased out, the ULBs must update their assets register. The
Asset Management System built and maintained by KMDS has provision to include
information on whether the property is leased out, details of lease period etc.
Therefore, we strongly recommend that ULBs be incentivised to update their fixed
asset registers on the online system either by deploying internal teams to the task
or employing chartered accountants in a one-time exercise to update the register.
This will a have two fold effect of helping better assess the potential of revenue from
lease of municipal properties and also keep track of all assets including the city
infrastructure that is owned and maintained by the ULB.
2. Collections
Objective
To evaluate the method by which the properties owned by Municipalities are
assessed to collect rental income and to ensure completeness and accuracy of such
assessment.
Work done
• Interacted with Revenue Officers and Bill Collectors across the 12 ULBs to
understand the process and controls in place.
• Analysed rental income and return on asset data across 2015 to 2017 for 182 ULBs
in Karnataka.
Observations
• Municipal properties such as shops and other commercial establishments are
rented out by the municipalities. These properties are leased out for a period
of 3-5 years and in some cases for an extended period of 10 to 30 years at the
discretion of the council. The maximum rental charges that the municipalities
charge are derived from the guidance value. We already know that the guidance
values prescribed are significantly lower than market value and therefore, the
rental charges levied are not comparable with current market prices.
35Return on assets by ULB type (Rs in lakhs)
Rental income from Munic- Fixed asset - Land & Average Return on asset
ipal Properties Building - Gross Block (%)
ULB
type
31-Mar 31-Mar 31-Mar 31-Mar 31-Mar 31-Mar 31-Mar 31-Mar 31-Mar
2015 2016 2017 2015 2016 2017 2015 2016 2017
CC 2,410 4,073 1,724 70,354 64,420 56,301 3.4 5.4 4.9
CMC 2,165 1,857 1,901 98,419 93,528 86,677 3.3 3.3 4.4
TMC 2,676 2,577 2,211 63,329 69,076 52,976 4.7 5.3 5.0
TP 541 403 323 18,457 16,856 15,738 3.7 2.9 2.6
4.1 4.4 4.4
Source: FBAS
• Since we have not been provided with the gross block details of properties on
lease, we have calculated Return on Asset % (RoA) based on the rental income
from municipal properties and total gross block of land and buildings capitalised
in the books of accounts. The RoA has remained consistent across three years at
approx. 4.3% of the gross block of land & building.
• Further, and more importantly, none of the 12 ULBs, nor the KMDS were able to
provide a detailed listing of commercial properties owned by local bodies across
Karnataka.
Recommendations
• Revision of guidance value –In order to increase the rental charges that a ULB
can levy, the guidance value must be in line or close to the current market value.
However, as discussed in the previous sections of the report, the guidance value is
not regularly updated. Therefore, the ULBs must first take due steps in assessing
the reasons for such lack of updation of guidance values.
36STUDY ON “ SUSTAINABLE FINANCING FOR URBAN KARNATAKA” – VIABLE OPTIONS
• Engaging a Property Management Company– In order to assess the revenue
potential from properties owned by municipalities, the ULBs must first update
the records of all properties owned by the Municipalities with details of whether
they have been leased or not. This exercise could be undertaken in house by
the employees of the ULB or an external agent in case of manpower shortages.
As the second step, the ULB could possibly engage a Property Management
Company (PMC) to conduct a study on the commercial properties owned in order
to evaluate the revenue potential from such properties. Through the study, the
PMC could also help evaluate the right usage of the property and help explore
options such as joint development in order to enhance the revenue potential of
such properties.
3. Water charges
Water charge/tax (collectively known as ‘water charges’) is designed as a charge on
consumption for both metered and unmetered water supply and is a significant source of
revenue for ULBs.
Objective
• To analyse the process of revenue generation from supply of water across ULBs.
Work done
• Interacted with officers from the Revenue department of the 12 ULBs to
understand the enumeration and assessment of water charges and the tariff
structure levied.
Observation
• Due to lack of a complete consumer database or details of utilisation per
household, the demand for revenue from water charges that is forecast by most
ULBs is un-scientific and not supported by any workings. The 12 ULBs visited for
the purpose of field work did not provide any working for the demand forecast in
the budgets.
• Further, based on our interaction with 12 ULBs, we understand that only 2 out
of these 12 ULBs have a certain number of metered connections. For the other
10 ULBs, consumption based rates are not levied and instead flat monthly tariffs
are charged for both commercial and residential properties. The tariffs are rarely
revised and are not indexed to power consumption or inflation and the process
dis-incentivises efficient use of water. We further understand that this trend can
be extrapolated to other cities across the state of Karnataka.
37Water charges collection efficiency %
ULB Type 2012-13 2013-14 2014-15 2015-16 2016-17
CC 42.5 43.4 47.6 47.3 38.9
CMC 48.8 48.6 49.5 46.7 46.3
TMC 55.7 56.4 60.2 56.2 58.2
TP 49.3 53.8 54.4 59.3 59.0
Total 51.7 53.3 55.5 54.9 55.3
Source: Data provided by ULBs
• Apart from unscientific prediction of demand, we also note that collection
efficiencies are significantly low at an average of 54.1% over the past five years. As
per the revenue officers across the ULBs, the reason for poor collections can be
attributed to incomplete customer databases, delivering bills to wrong addresses,
long overdue unpaid bills by consumers and inaccurate water bills raised. Further,
in water scarce areas, the ULBs refrain from collecting user charges on account of
intermittent water supply.
Observation
• 100% metered connections– Currently, the water consumption across cities in
Karnataka is hard to predict due to lack of 100% metered connections. Further, it
makes consumption based levy of tariff rates impossible. Therefore, the ULBs must
work with KUWSDB, supported by KUIDFC, to introduce metered connections
across ULBs in the state.
• Improve collection efficiencies – As highlighted for property tax collection, the bill
collectors play a significant role in collection of taxes. Therefore, their vacancies
must be duly addressed. If the ULBs are unable to hire additional bill collectors,
they could also engage an agency (via a transparent bid) to facilitate collections
through digital channels, actively leveraging tele calling similar to how banks
collect dues from credit card holders. We recommend the DMA conduct a
feasibility study to evaluate the option of sourcing collections.
38STUDY ON “ SUSTAINABLE FINANCING FOR URBAN KARNATAKA” – VIABLE OPTIONS
4. Innovative modes of municipal revenue generation
As the focus continues to remain on ways to enhance property tax, water charges
and rental income, there has been very little discussion around identifying alternative
ways to increase municipal revenues by evaluating fresh innovative modes of
revenue generation. Globally, cities such as London and Singapore have successfully
tapped revenue streams such as congestion charges and successfully leveraged
technology to optimise collections. Smaller cities such as Kampala in Uganda have
imposed charges on cab services, a potentially buoyant source of revenues in our
cities where cab services are growing exponentially. Cities are transit centers, tourist
attractions and major centers of consumption. There are several examples such as
Time Square in New York, Bengaluru International Airport, and Delhi Metro where
outdoor advertising space has been monetised for significant amounts. Some cities
in Australia have successfully crowd funded neighborhood projects as well. Some of
the innovative modes that ULBs across Karnataka can consider are as follows –
i. Surcharge on stamp duty: As per the KMCA, 1976 and KMA, 1964, the ULBs in
Karnataka are entitled to receive a share of the stamp duty income collected
by the state in that region. However, between 2014 and 2017, no such revenue is
assigned to the ULBs from the State Government. Therefore, we urge that the
DMA review reasons for the funds not being released and work with the State
Government in receiving the due amount. We believe that surcharge on stamp
duty in cities with higher economic activity would be a significant source of
revenue. For example, the city of Lucknow earned Rs 90 crores from a surcharge
on stamp duty during 2015-16.
ii. Grant of advertising rights: The Government of Karnataka recently passed
an order abolishing the levy and collection of advertisement taxes. In 2016-17,
advertisement tax contributed to approx. Rs 9.71 crores across 186 ULBs out of
which CCs earned Rs 8.91 crores. With the passage of the government order, the
CCs stand to lose a buoyant source of revenue.
We propose that instead of levying advertisement tax, the ULBs could grant
advertisement rights for all hoardings, mobile bill boards, wallscapes, transit (
bus stops, taxi), street furniture, electric poles, road dividers, to a single agency
through a transparent bidding process. For example, the City of Chicago tied
up with a large advertising agency for advertising throughout the city in 2,800
bus shelters resulting in a contribution of $18 million to the city’s corporate fund
budget for 2013. An example closer to home would be the hoardings at the
Bangalore International Airport (BIAL). In a transparent competitive bid, a large
advertising agency won the advertising concession earning BAIL approximately
Rs 200 crores from this deal.
39IT SYSTEMS FOR ULBS IN
KARNATAKA
40STUDY ON “ SUSTAINABLE FINANCING FOR URBAN KARNATAKA” – VIABLE OPTIONS
The IT infrastructure for ULBs in Karnataka is managed by the Karnataka Municipal Data
Society (KMDS). The KMDS is a registered society in Karnataka and Karnataka was one of
the first states to create a municipal data society for computerized reforms. It was created
by the DMA during 2007-08 with a defined set of objectives towards strengthening ULBs
through e-governance. A state level Municipal Data Center was established within the
KMDS and a centralized database of all the ULBs are being maintained from it. The online
applications that KMDS runs on ULB websites include – Fund Based Accounting System
(FBAS), Monthly Information Booklet (MIS system), Street Vendor database, E-Aasthi,
Property Tax Information System, Property Tax Calculator, SLB data, schemes data of ULBs,
Official Vacancy position data, Asset Management System, to name only a few.
Despite the pioneering move by the GoK to take up e-governance way ahead of other
states, the following are the issues and challenges noted with the current set up:
• FBAS system – No state level dashboard: A large portion of the data used for the
purpose of this report has been sourced from the FBAS systems. However, despite the
books of accounts of all ULBs being digital, KMDS currently is not equipped to provide
a state level, consolidated dash board of the financial data. Therefore, in case of a need
to view a consolidated financial status of ULBs in Karnataka, a back-end query must be
raised to obtain all the financial statements and following which analysis is done.
• MIB – Not updated regularly and no review process in place: MIB was launched with an
intention to collect monthly performance data of ULBs and to further build a robust,
periodic review system. However, the ULBs have not updated the MIB on a regular basis
and nor is there any review system in place where the data that is in fact uploaded is
analysed.
• Asset Management System – Not updated by ULBs: Launched in 2006, the asset
management system was introduced to replace the physical registers previously
maintained. However, the online register has not been updated by the ULBs. The KMDS
is still in the process of assisting ULBs collate the opening balance data (of year 2006)
to be uploaded on the system. Therefore, there is a significant backlog in the asset
registers maintained by ULBs across the state.
• E-Aasthi, Property Tax Information System (PTIS), Property Tax Calculator – Multiple
systems for property tax that are not linked to each other: Updated digitised records
of properties by their Property Identification Number (PID numbers) is not maintained
across the ULBs. The property tax computation is performed online, on the Property Tax
Calculator. However, the software does not have a provision to generate PID number
wise reports. The ULBs have multiple systems to keep track of properties namely,
Property Tax Information System, E-Aasthi and Property Tax Calculator. But none of
these systems are linked to each other and parallelly store varied data.
•
41You can also read