Qualitative Analysis of Visualization: A Building Design Field Study
←
→
Page content transcription
If your browser does not render page correctly, please read the page content below
Qualitative Analysis of Visualization:
                              A Building Design Field Study
                           Melanie Tory                                                      Sheryl Staub-French
                   Dept. of Computer Science                                                Dept. of Civil Engineering
                      University of Victoria                                              University of British Columbia
                    PO Box 3055, STN CSC                                                   6250 Applied Science Lane
                 Victoria, BC, Canada V8W 3P6                                               Vancouver, BC, V6J 3L8
                        +1 (250) 472-5798                                                      +1 (604) 827-5118
                       mtory@cs.uvic.ca                                                         ssf@civil.ubc.ca

ABSTRACT                                                                    their type of analysis: qualitative and/or quantitative. By and
We conducted an ethnographic field study examining the ways in              large, most formal user evaluations of visualization systems have
which building design teams used visual representations of data to          involved quantitative laboratory experiments. In these studies,
coordinate their work. Here we describe our experience with this            users are asked to complete a series of benchmark tasks with two
field study approach, including both quantitative and qualitative           or more visualization systems or methods, with time and error
analysis of field study data. Conducting a field study enabled us to        rates as the primary metrics. Many examples of such studies exist
effectively examine real work practice of a diverse team of                 in the literature (e.g.,[7][13]), including several of our own (e.g.,
experts, which would have been nearly impossible in a laboratory            [21][22]). This reductionist approach has been adapted from other
study. We also found that structured qualitative analysis methods           fields such as psychology, and follows good scientific practice:
provided deeper insight into our results than our initial                   control extraneous factors, isolate the variable of interest, and
quantitative approach. Our experience suggests that field studies           demonstrate results statistically. Shneiderman and Plaisant [17]
and qualitative analysis could have substantial benefit in                  provide a useful review of how these methods have evolved
visualization and could nicely complement existing quantitative             through history. We support and encourage quantitative
laboratory studies.                                                         experiments and believe they provide some valuable knowledge
                                                                            about visualization design. But we also believe they miss
                                                                            something important.
Categories and Subject Descriptors
H.5.2 [User Interfaces]: Evaluation/Methodology; H.1.2                      Consider Kobsa’s comparison of commercial information
[User/Machine Systems]: Human Factors; H.5.3 [Group and                     visualization systems [7] that revealed which systems were fastest
Organization Interfaces]: Evaluation/Methodology; J.5 [Arts                 and most accurate for various benchmark tasks. Because the
and Humanities]: Architecture; J.6 [Computer-Aided                          systems differed from each other in many ways, including visual
Engineering]: Computer-aided design (CAD).                                  design, interaction style, and available visualization techniques,
                                                                            the author could only guess at the reasons behind performance
                                                                            differences. Laboratory studies generally test novice users
General Terms                                                               conducting simplistic tasks on arbitrary data for a short time
Experimentation, Human Factors.                                             period. Benchmark tasks are usually simplistic so that they can be
                                                                            carefully controlled and accuracy can be explicitly measured.
Keywords                                                                    Unfortunately, this approach limits the realism of the studies. If
Visualization, Evaluation, Qualitative analysis, Ethnographic field         the goal of visualization is for expert users to gain insight into
study, Long-term study.                                                     their own data and communicate it to others over an extended time
                                                                            period, and the goal of evaluation is to understand how to best
1. INTRODUCTION                                                             design visualization tools to support these users, then these
Evaluation of visualization tools and techniques is a growing               quantitative lab studies clearly fall short. Ideally, we would like to
trend. Several years ago, few visualization systems were evaluated          understand which features of a visualization tool make it useful
at all. By contrast, most current systems are evaluated in some             for complex, long-term data analysis by domain experts. Alternate
way, often via user studies. User studies can be classified very            evaluation methods are needed to support these goals.
broadly by their location: in the field or in the laboratory, and by
                                                                            We believe field studies and qualitative analysis can complement
                                                                            quantitative laboratory studies to provide this missing
Permission to make digital or hard copies of all or part of this work for   understanding. In this paper, we discuss our experiences with both
personal or classroom use is granted without fee provided that copies are   quantitative and qualitative analysis of a field study, and describe
not made or distributed for profit or commercial advantage and that         how the qualitative analysis led to a much richer understanding. In
copies bear this notice and the full citation on the first page. To copy
                                                                            the study, we focused on visual representations used by a building
otherwise, or republish, to post on servers or to redistribute to lists,
requires prior specific permission and/or a fee.                            design team during collaborative meetings. Detailed results of the
BELIV 2008, April 5, 2008, Florence, Italy.                                 study will be reported elsewhere (e.g. [23]). In this paper, we
Copyright 2008 ACM 978-1-60558-016-6/08/0004...$5.00.                       focus on the effectiveness of our methods, with some example
                                                                            results to illustrate our points. We discuss the benefits and
challenges of qualitative methods and field studies, and suggest current work practice with visual representations rather than
how they might be further applied in the field of visualization. evaluating a new visualization technique, similar to Faisal et al.’s
[4] study of how researchers used knowledge domain
In the remaining sections, we first discuss related visualization visualizations to examine literature in their field. As such, we did
studies involving qualitative analysis and/or field work. We then not have specific hypotheses at the beginning of the study and our
describe our field study that examined the use of visual
work was more ethnographic in nature. In addition, Shneiderman
representations by a building design team. We focus first on our and Plaisant [17] provide many suggestions for conducting long-
initial quantitative analysis and then on our later qualitative term field studies, but limited guidance on how to analyze the
approach. We end with a discussion of lessons learned from this resulting data. Here we describe our experiences with both
experience and conclusions about the appropriateness of these quantitative and qualitative analysis, with the hope that that they
methods for evaluating visualizations. will provide guidance for future studies.
2. RELATED WORK
Several recent papers have stressed the need for new methods of 3. FIELD STUDY OF BUILDING DESIGN
user testing. These papers have argued for evaluating visualization COORDINATION
techniques in more realistic situations [14][17], measuring Building design is a complex process involving vast amounts of
complex outcomes such as ‘insight’ [15][16], and understanding information shared by a diverse team of stakeholders. Much of the
the design features that contribute to a visualization technique’s information is represented visually. This includes representations
success or failure for various tasks [15]. Many of these of the design itself (CAD drawings, digital and physical design
discussions point towards longitudinal field studies and / or models, energy models, etc.) as well as representations that
qualitative analysis; however, actual experience with these support the design process (schedules, cost information, etc.).
evaluation methods for visualization is limited. Decisions made during building design involve and affect many
Some quantitative laboratory experiments have incorporated a stakeholders, including architects, engineering consultants,
qualitative aspect. For example, Kobsa [7] attempted to construction managers, facility maintenance organizations, facility
understand reasons behind performance differences when using users, and property managers. For example, a seemingly simple
different systems based on qualitative observations. Similarly, Li change in the ceiling height of a floor could affect the space
& North [9] used participant comments to explain some of their available for mechanical and electrical equipment, lighting
quantitative results, such as a misunderstanding of the meaning of requirements (because of changes in the amount of daylight
histogram bars by some participants. In such studies, observations entering the room through exterior windows), and the construction
and user comments help to explain the statistical results, but the cost. Coordination among stakeholders, therefore, is critical to
qualitative analysis is usually limited in depth and secondary to ensure that the building design meets the functional, aesthetic, and
the quantitative one. Others have collected qualitative data economic requirements of the owner. Visual representations play
through interviews and focus groups [11][15]. Rester [15] a critical role in mediating this coordination.
recommends using a mixture of evaluation methods since each
will provide a different perspective.
Kobsa [8] formalized the qualitative aspect of a visualization
experiment for the comparison of tree visualization systems. A
structured qualitative video analysis was performed in addition to
a quantitative comparison. He reported that the qualitative
analysis provided insight into usability problems and revealed the
reasons why some systems performed better than others. Using
video analysis rather than live note taking enabled the
experimenters to use two independent observers who could go
back to the video independently or together to review and update
their findings. Similarly, Tang et al. [19] used an open-coding
approach to video analysis to identify collaboration strategies with
map and network visualizations. Our current study uses similar
qualitative video analysis methods, but with a focus on experts’
current work practice over an extended time period rather than
short evaluation sessions with novice users.
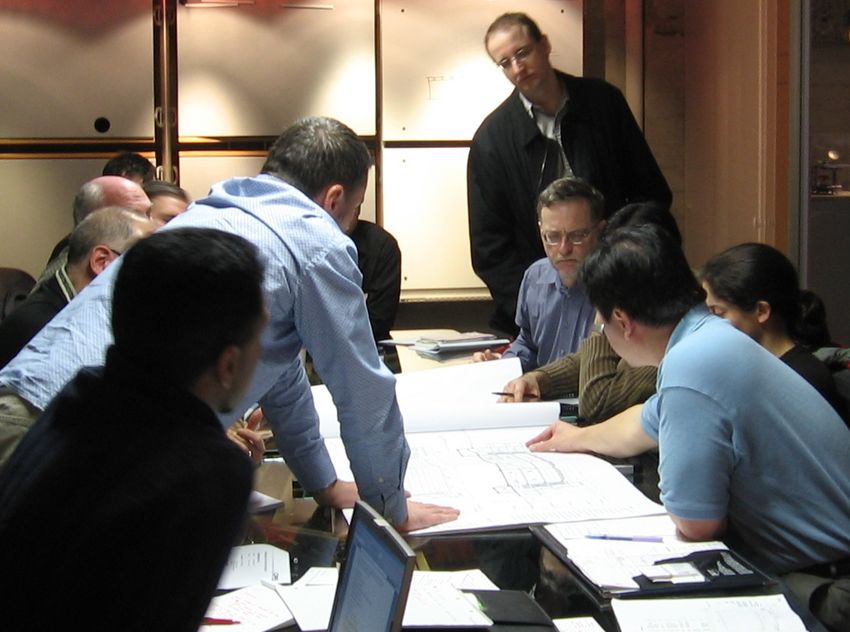
Figure 1: Typical design coordination meeting for a building
Longitudinal use by expert users is increasingly recognized as an
design project. Participants are examining a paper-based 2D
important aspect of evaluation [14][16][17]. Shneiderman and
CAD drawing representing part of the building design.
Plaisant [17] introduced the concept of multi-dimensional in-
depth long-term case studies (MILCs), where a small group of Interactive visualization tools play an important role in the
users are studied in detail, using multiple evaluation methods, building design process. Individual design work is usually
over an extended time period of weeks or months. The MILC accomplished using two-dimensional (2D) and three-dimensional
approach builds upon a long history of qualitative methods. These (3D) computer aided design (CAD) software. Schedule
originated in the social sciences and have been more recently information is often represented using Gantt and Pert charts
adopted in HCI. For a general introduction, see [3]. Our study created in software such as Microsoft Project. However,
follows in this methodological tradition, but differs somewhat coordination among stakeholders during in-person meetings often
from MILCs. In particular, our focus was on understanding involves much lower-tech visual representations such as paperprints of drawings, schedules, and spreadsheets, as shown in conducted and several meeting videos were analyzed only after
Figure 1. A growing trend in building design is to model the the initial quantitative analysis.
building and its systems entirely in 3D CAD. A 3D design process
has several known advantages, including fewer design conflicts 3.2.1 Initial Analysis: Quantitative
and errors [18], improved data access and integration [2], and Quantitative Analysis Method
enhanced visualization and interaction [12]. However, 3D models
Our initial approach to analyzing the data was primarily
cannot be easily printed, requiring a change in the way design
quantitative, where we counted and timed events of different types
teams meet to discuss and coordinate their work. It remains
using video coding. Our intent was to quantitatively ‘characterize’
unclear how to best integrate digital technology and interactive
the meetings and provide measures by which we could compare
visualization tools into design coordination meeting situations.
various aspects of meetings. For example, we wanted to measure
This was the focus of our study.
meeting productivity and then compare whether it was higher
3.1 Study Objectives when digital representations of data were present.
Our main goal was to understand how visual representations are Interactions: To study low level tasks and interactions, we
currently used during coordination meetings, and to use this counted various interactions with artifacts (paper diagrams,
information to identify design guidelines for interactive models, electronic devices, etc.) using quantitative video coding.
visualization tools that would be used during meetings. We also Our intent was to capture work patterns and interactions with
wanted to compare how digital and physical representations of various artifacts. Each time a meeting participant referred to or
data were used. Toward this end, we examined two elements of interacted with an artifact, we recorded the artifact in question, the
the meeting process in parallel: action performed, the perceived goal of performing the action, and
· Interactions: Low level tasks and interactions involving whether the action was part of a group, subgroup, or individual
visual representations of data. For example, users might search activity. We selected artifacts, actions, and goals for our coding
scheme based on ad-hoc qualitative observations at the meetings.
or query a CAD drawing for information, and interact with
drawings by pointing and turning pages to see different views. A sampling of this coding scheme is given in Table 1. Eight
meeting videos were analyzed in this way.
· Meeting Process: The higher level meeting process and
Table 1: Partial video coding scheme for quantitative analysis
productivity, including artifact utilization and the role of visual
of low-level interactions with artifacts.
representations. For example, meeting discussions covered a
flow of different kinds of meeting tasks and meeting Artifacts Actions Goals Scope
participants utilized different types of artifacts in their decision-
making process. Paper Diagram Manipulate Explain Group
3D model Point / Gesture Gain attention Subgroup
3.2 Data Collection and Analysis Paper Compare Indicate Individual
Because our goal was to understand current work practices in a Pen Move / Rotate Lookup
real setting, a laboratory study would have imposed too many Notepad Pass artifact Decide
artificial constraints. Instead, we conducted an ethnographic field
study where we observed coordination meetings of a particular Laptop Annotate Make query
building design team as they transitioned from paper-based PDA Browse Share
meetings to digital meetings. We also conducted interviews with White board Sketch Prepare
key members of the team. etc… etc… etc…
In total, we observed 20 in-person coordination meetings over a
seven-month period. Each meeting was approximately 3 hours
Meeting Process: Similarly, to examine the higher-level meeting
long. Early meetings were conducted in a traditional boardroom
process and productivity, we employed a coding scheme and
(paper-based meetings) and later meetings were conducted in a
measures defined by Liston et al. [10]. Specifically, we
digital meeting space containing two large screen SmartBoard
categorized the type of discussion tasks observed throughout the
displays (digital meetings). Two types of meetings were observed:
meetings, as in the second column of Table 2. We then used the
design development meetings that focused on refining the design
relative percentages of time spent on these tasks to calculate
of various systems in the building, and value engineering
measures of meeting productivity as a function of task resolution
meetings that focused on reducing the cost of the building project.
(e.g., Equation 1), as suggested by Liston. We also kept track of
We interviewed the most frequent meeting participants: the information types and forms used in different meetings (see Table
architects, construction manager, electrical consultant, and 2). We used these to identify which types of information were
mechanical consultant. The second author actively participated in used when meetings were more or less productive and to get a
the building project as a 3D design consultant and attended sense for the information complexity. Eight meeting videos were
several meetings in this role. The other author acted as a passive analyzed in this way.
observer during meetings. Meetings were videotaped and
interviews were audio-recorded. We also had access to a
document-sharing system (Autodesk Buzzsaw [1]), which the
building design team used to share and archive documents
relevant to the meetings, including CAD drawings, CAD models,
agendas, meeting minutes, consultant reports, schedules, and cost
plans. Only part of this data was collected at first; interviews wereTable 2: Video coding scheme for quantitative analysis of the types of interactions with information are different in different
meeting process. meeting environments? Does this matter?
Subjects Tasks Information Information In our initial analysis, we also made several interesting qualitative
Type Form observations. For example:
Architect Descriptive Temporal Temporal · Contrary to our expectations, the team rarely annotated
Chart design drawings during meetings. Instead, they sometimes made
Structural Explanative Spatial explicit drawing-like actions in the air over the page or sketched
Engineer Evaluative 2D Quantitative on blank paper layered over the drawing.
Mechanical Predictive 3D Physical Symbolic · The architect was able to ‘bookmark’ pages in a stack of
Engineer Model paper drawings by either placing his hand at a location to mark
Semantic
Electrical 3D Virtual it, by pulling a page partially out of the stack, or by holding a
Engineer Model page in the air. We believed that these could be used as
Landscape 4D metaphors for digital bookmarking.
Architect Text · An architect occasionally pointed at paper drawings using all
Code Consultant five fingers to surround an area of interest. This suggested a
Diagram possible input technique where five-finger pointing could be
Project Manager Symbol used to control a spotlight that would highlight information.
Construction Chart · We observed that meeting participants did not utilize artifacts
Manager very effectively to communicate their designs, although
Table
Mechanical gesturing to design drawings was very common.
Contractor Many of these qualitative observations were interesting. However,
Electrical the observations were very ad-hoc and left many open questions.
Contractor Reasons behind many of our observations were unknown. For
example, what was the reason why drawings were rarely
annotated? Were there other methods of bookmarking and other
(1) distinctive pointing styles that we had not noticed? In addition,
these observations were often based on one or two instances and
individuals. It was not at all clear whether these actions were
consistent across people, and whether they would occur frequently
Quantitative Analysis Results or were simply one-time events.
The quantitative analysis led to some interesting observations. For 3.2.2 Later Analysis: Qualitative
instance: Following our initial quantitative analysis, we conducted an in-
· Meeting participants spent a significant amount of time on depth qualitative analysis to address the same research questions.
descriptive (35%) and explanative (42%) tasks and very little Qualitative Analysis Method
time on predictive (12%) and evaluative (11%) tasks.
We took an approach inspired by grounded theory [5]. The goal of
· Meeting productivity was quite high, with an average of a grounded theory study is to generate a theory by systematically
73%.
analyzing ‘grounded’ (i.e. real-world) qualitative data. The
· Meeting environment substantially changed the distribution analysis typically begins with open-coding as described below.
of low level interactions with visual representations. Pointing Additional data is collected and analyzed when the current data
and gesturing accounted for 84% of interactions in paper-based seems insufficient. Our analysis primarily centered on videos.
meetings and 47% in digital meetings. Manipulating and Interviews were used to validate findings and identify issues that
accessing accounted for 8% of interactions in paper-based participants felt were critical in reference to integrating digital
meetings and 29% in digital meetings. media into work practice.
· Meeting content (design development vs. value engineering) We used an open-coding method to systematically analyze the
had minimal impact on the distribution of low level interactions video data, similar to other research [6][20]. Open-coding is a
with visual design representations. standard method for extracting themes and theories from a body
However, despite these interesting observations, our quantitative of qualitative data. We focus here on video data, but the same
analysis left us with many unanswered questions and inconclusive method can be applied to transcribed interviews. As the
results. For example, we questioned the validity of the researchers watch the videos, they take notes of interesting
quantitative measures of meeting productivity. How do you occurrences and create keywords or codes to describe those
define meeting productivity considering the variety of meeting events. Similar events are assigned the same code. Codes are
goals and outcomes? If a task is resolved, does that necessarily iteratively refined, added, deleted, and categorized into groups as
mean it was a worthwhile task? We were also not sure how to the analysis progresses; relationships between codes are also
interpret our characterization of meeting tasks. What does it mean iteratively identified and refined. Early in the analysis, any
if 47% of the time in a particular meeting was spent on descriptive interesting event might be given a code, but subsequently, codes
tasks? Is that good or bad? Similarly, what does it mean if the are considered valid only if the event occurs in multiple video
segments. Researchers re-watch sections of the video multiple
times (e.g. to compare whether events are similar enough to beTable 3: Iteratively refined coding scheme for qualitative analysis of the meeting process.
Subjects Scene Tasks Artifact Artifact Type Artifact Form Bottlenecks
Architect Design Details Descriptive Stick Set Temporal Chart Temporal Data Access
Structural Budget Items Explanative Cost Plans 2D Spatial Visualization
Engineer Exterior Design Evaluative Personal Notes 3D Physical Quantitative Collaboration
Mechanical Equipment Predictive Sketches Model Symbolic Research
Engineer location 3D Virtual Semantic Negotiation
Electrical Government Model
Engineer regulations 4D
Landscape Glazing Text
Architect
Water and Diagram
Code wastewater
Consultant Symbol
etc... Chart
Project
Manager Table
Construction
Manager
Mechanical
Contractor
Electrical
Contractor
given the same code, to determine whether events in a group approach involved viewing the video repeatedly to capture the
should be divided into subcategories, or to search earlier segments essence of the meeting discussion and the nature of the
for instances of codes that were identified while watching later bottlenecks encountered.
segments). The research questions themselves also iteratively
change throughout the analysis as interesting observations, trends, Qualitative Analysis Results
and relationships emerge. Interactions
Interactions: To examine low level interactions, we analyzed ten Our analysis of low level interactions resulted in a detailed
meetings in depth. We iteratively characterized the ways in which taxonomy that explained how different representations of design
the design team interacted with design information, and the goals information were used to facilitate collaboration during
participants were trying to achieve by means of the interactions. coordination meetings. It also revealed many interaction
Codes were names for commonly observed behaviours or bottlenecks that reduced productivity. A complete description of
phenomena of interest, such as bookmarking and five-finger these results is reported elsewhere [23]. Here we describe some
pointing as described in the previous section. We also noted example results to demonstrate that the qualitative analysis led to
bottlenecks in the meeting process that could be attributed to a richer understanding of the interactions participants had with
awkward or time-consuming interactions with artifacts. We visual representations. The analysis also clarified the relative
focused on physical interactions with design information, but used importance of our observations.
participants’ speech to understand the intent and purpose of those
Our initial observation of five-finger pointing encouraged us to
interactions, similar to Tang [20].
further examine pointing and gesture interactions related to design
Meeting Process: To examine the high level meeting process, we information such as drawings. Our initial coding scheme included
examined six meetings in detail and iteratively characterized the simply five-finger pointing and ordinary one-finger pointing. By
content of the meeting discussion and the meeting tasks (coded the time we finished the qualitative analysis, this had been
previously) as in Table 3. Then, for each meeting task, we expanded to nine distinct categories of pointing based on hand
identified the artifacts utilized and characterized the bottlenecks shape and movement. A few of these are shown in Figure 2. We
encountered. We characterized the meeting content as scenes that also learned that these categories were consistent across
illustrate the general meeting topics and involve one or more individuals with varied backgrounds, different types of meeting
meeting tasks. Artifacts characterized the different domain- content, and different types of visual representations including
specific documents utilized in the meeting task. Bottlenecks were digital drawings, paper-based drawings, and physical models. This
encountered when meeting workflow was disrupted or when the consistency suggests that these pointing techniques could be used
completion of meeting tasks was impeded or inefficient. We as intuitive and natural methods of input.
characterized the type of bottleneck to understand how different
digital technologies might help to overcome it. For example,
confusion around the type of wall and the size of an air
conditioning unit in one meeting suggested that the type of visual
representation used limited participant understanding. Thisdescription or explanation than other topics. We found that the
discussion topics had little impact on meeting task distribution
and flow. These conclusions gave us more confidence in the
generality of the meeting task types.
We analyzed the bottlenecks, artifacts, and artifact types to get a
better sense for the causes of productivity problems. We found
(a) (b) (c) that the types of visual representations used and the limited
Figure 2: Example pointing techniques. (a) five-finger pointing interactivity of those representations led to significant bottlenecks.
where five fingers surround the area of interest (b) two-finger We also found that data access was a significant problem even
indication where two fingers indicate the space between (c) when the artifacts were available, though required some effort to
covering where the hand covers the area of interest obtain in the meeting setting. We found this characterization to be
Similarly, our initial observation of paper-based bookmarking a much more useful way of critiquing meeting productivity and
encouraged us to examine bookmarking in our qualitative identifying design guidelines for digital tools to support meeting
analysis. The new analysis led to the discovery of an additional activities.
method for bookmarking: rolling groups of pages away from a
stack. We also observed many more instances of these 4. LESSONS LEARNED
bookmarking methods by multiple people, providing confidence 4.1 Field Studies
that these were not isolated one-time events.
Our field study allowed us to examine how visual representations
More importantly, examining bookmarking led us to study the were used by a group of building design experts on a real project.
higher-level category of navigation – changing which information Because our research questions involved understanding real work
was visible or altering one or more participants’ view of the practice, they would have been difficult to accurately answer in a
information. We developed a detailed taxonomy of navigation laboratory study, where conditions are controlled and do not
mechanisms for visual design information. We also realized that accurately represent the messiness of real practice. Realism is the
navigating digital drawings was a major bottleneck in meetings, greatest advantage of field studies. We believe the opportunity to
taking substantially more time than navigating the equivalent observe a diverse team of experts doing real design work was well
paper drawings. We concluded that 3D representations may have worth the challenges we encountered.
been helpful in some situations, and that better integration
We made a number of decisions in the design of our study that
between 2D and 3D views was needed to improve usability. We affect the generality of our results. We chose to study one group
also suggested developing a specialized application for viewing in depth rather than multiple groups because this would better
digital 2D CAD drawings during meetings. Such a viewer would enable us to gain a deep understanding of a team’s work practice,
include features such as an overview of the collection of drawings
something that would not be practical in a study with greater
and easily customizable shortcuts to move quickly back and forth
breadth. However, it is unclear whether our results can be directly
between drawings or parts of drawings. Such features are common
generalized from the design team and project that we studied.
practice in visualization. However, prior to this study, we would
Further observation of other design teams is needed to corroborate
not have believed that they were necessary for navigating within a
our own evidence, but would be very time consuming to
small collection of approximately ten non-interactive drawings accomplish. Data collection even for one design team took time;
and that this would be a key bottleneck in the meeting process.
the team we studied spent a substantial amount of time discussing
Meeting Process issues that had little relevance to our research questions, and the
Our initial reservations about the meeting productivity rates and study had to be conducted over seven months to correspond with
the vagueness of the meeting task types led us to pursue a more the building design schedule.
holistic approach to analyzing the high level meeting process. Another disadvantage of field studies is the limited technical
We wanted to gain a better understanding of the content of the quality of data collected. Because we could not set up the meeting
meeting discussion and the factors that contributed to meeting environment, we were limited in where we could place video
effectiveness. Therefore, our qualitative analysis shifted the focus cameras and microphones. Ideally, we would have liked several
from an emphasis on tasks to an emphasis on scenes and from an cameras from different viewpoints, including one looking down at
emphasis on productivity to an emphasis on bottlenecks. the meeting table where paper drawings were placed; however,
The results of our qualitative analysis of the meeting process is a this was not practical to set up for each meeting. The equipment
detailed characterization of the meeting context, which includes also needed to be portable so we could easily bring it to and from
scenes, the type and flow of meeting tasks, and the bottlenecks the field site. In the end, we used one video camera and attempted
encountered. We also classified the artifacts utilized for different to find the best placement to view the meeting scene. Often
meeting tasks and in certain cases, calculated the artifact however, the placement and limited resolution of the camera did
utilization rate for the different meeting environments. A detailed not allow us to see details such as specific items participants
description of these results is in preparation. pointed to in paper or digital drawings.
We extended the coding scheme to include scenes and domain- 4.2 Qualitative Analysis
specific artifacts to get a better sense for the generality of the The key lesson we learned from this study was the effectiveness
meeting tasks and whether they impacted the distribution and flow of qualitative analysis. Our initial approach focused heavily on
of meeting tasks (see Table 3). For example, we analyzed quantitative or ‘hard’ evidence. Some of our numeric results were
discussions of the equipment location, exterior design, and cost useful, but we also questioned the validity and meaning of many
plan to determine if one type of discussion topic required more of our results. By contrast, our qualitative results provided a rich,thorough understanding of the complex processes involved in tool in the field could allow researchers to examine use of the tool
collaborative design meetings. over an extended time period for a real application. One downside
of this approach is that the tool would likely need to be more
An important aspect of qualitative analysis is triangulation, or refined than for a short quantitative study, possibly including extra
collecting information about each research question from different features needed for practical long-term use. There are a variety of
sources. Initially, we focused our analysis almost entirely on
qualitative research traditions, including grounded theory,
video data. Later, by supplementing this information with phenomenology, case studies, etc. [3]. We took an approach based
interviews of various participants we gained more confidence in on grounded theory [5], which is useful for understanding current
our conclusions. For example, participants could explain the practices and developing theories. Evaluating visualization tools
reasons behind actions that we had observed them doing. We by deploying them in the field is more of a case study approach,
could also compare participants’ impressions about meeting but could use a similar method of structured qualitative analysis.
bottlenecks to the bottlenecks we observed. The importance of
triangulation has also been reported by others [14][15]. Qualitative analysis is not limited to field studies; it could be
applied equally well to structured laboratory studies. This
We also found that structuring the qualitative analysis was very approach could be useful for comparing two or more tools or
important. Our initial ad-hoc observations (e.g., bookmarking and techniques in a short time frame. Video data could be collected as
five-finger pointing) were limited in their scope and usefulness, a record of how people interacted with the tool and interviews
and their validity was questionable since they were based on only could be conducted to obtain users’ impressions. Qualitative
one or two observations. Although the structured open-coding analysis of this data could be particularly useful for studying
method took a substantial amount of time, the thorough analysis complex, open-ended tasks where performance cannot be easily
led to more in-depth results with greater validity. A theory about measured quantitatively.
current work practice emerged and observations fit together into a
higher-level structure to provide a thorough understanding. Regardless of whether qualitative data is collected in the field or
in the lab, structured qualitative analysis methods could be used to
As scientists and engineers trained in reductionist scientific gain a holistic understanding of a visualization tool’s
thinking, adopting qualitative methods requires overcoming some effectiveness. An open-coding approach similar to ours could be
deeply ingrained assumptions. First and foremost, research used to identify bottlenecks in working with the tool, strategies
questions and hypotheses cannot be precisely articulated at the taken by users to accomplish their goals, ways in which users
beginning of the study. Rather, results emerge gradually and work around bottlenecks, and the suitability of different work
research questions evolve as the study proceeds. It is not possible strategies for different visualization techniques.
to predict exactly which data will need to be collected or when We suggest that the visualization community should adopt
data collection will be complete. In addition, the validity of
qualitative analysis methods and conduct more qualitative studies
research is not determined by whether or not it is backed up by to complement the quantitative ones currently being done. These
numeric evidence. Structured qualitative analysis can be equally qualitative studies will be most beneficial if researchers apply
as valid as quantitative analysis. However, it is important to qualitative analysis techniques in a structured and rigorous way,
distinguish between qualitative analysis that is ad hoc and and if publication venues recognize the value of rigorous
qualitative analysis that follows structured methods of inquiry. qualitative analysis and the substantial time it requires.
5. EXTENSIONS TO OTHER STUDIES 6. CONCLUSIONS
This section discusses how the methods we used might be applied Field studies and qualitative analysis can provide depth of insight
to other application areas and to evaluate new visualization tools into visualization design that is not possible with strictly
and techniques. controlled quantitative experiments. Qualitative analysis enables
us to gain a thorough understanding of the complex benefits and
5.1 Understanding practice drawbacks of a visualization, including diverse aspects such as the
Our study aimed to understand and build a theory about current design itself, integration with other analysis tools, impacts on
work practice. The methods we used are well suited to this work practice, and so on. Similarly, long-term field studies
purpose, and would likely work for many different applications. provide an in-depth look at real use of visualization tools by
For example, we focused on a collaborative building design task, actual users. These methods cannot provide ‘proof’ that one
but work practices of a single biological analyst could be visualization technique is better than another. However, such
characterized equally well. Researchers could observe and quantitative proof is often highly limited in its applicability to real
videotape the analyst at their workplace (e.g., when working with practice because of constraints imposed on the interfaces, tasks,
biological visualization tools and other software), and interview and length of evaluation. Although qualitative analysis and field
the analyst about how they work. Video and interview data could studies are not new, they have been rarely employed in
be analyzed using a similar open-coding approach to ours, in visualization. We suggest that using these methods more widely,
order to identify strategies and bottlenecks in the work process. to complement quantitative studies, will greatly enhance our
These results could be used to design new visualization collective understanding of effective visualization design.
techniques.
5.2 Evaluating tools 7. ACKNOWLEDGMENTS
We believe field studies and qualitative analysis would also be We thank Barry Po, Mani Golparvar Fard, Brandon Walker, Fuqu
useful for evaluating new visualization tools and techniques, Wu, and Lu Yu for their contributions to data collection and
although this type of study would be somewhat different from our analysis. This research was funded by a strategic grant from the
own. Unlike typical laboratory studies, deploying a visualizationNatural Sciences and Engineering Research Council of Canada [13] Nekrasovski, D., Bodnar, A., McGrenere, J., Guimbretière,
(NSERC). F., and Munzner, T. 2006. An Evaluation of Pan&Zoom and
Rubber Sheet Navigation with and without an Overview. In
8. REFERENCES Proceedings of the SIGCHI Conference on Human Factors in
Computing Systems (Montréal, Québec, Canada, Apr. 22-27,
[1] Autodesk Buzzsaw. http://www.autodesk.com/buzzsaw/.
2006), 11-20.
[2] Bakis, N., Aouad, G., and Kagioglou, M. 2007. Towards
[14] Plaisant, C. 2004. The Challenge of Information
distributed product data sharing environments - Progress so
Visualization Evaluation. In Proceedings of Advanced Visual
far and future challenges. Automation in Construction, 16, 5,
Interfaces (Gallipoli, Italy, May 25-28, 2004), 109-116.
586-595.
[15] Rester, M., Pohl, M., Wiltner, S., Hinum, K., Miksch, S.,
[3] Creswell, J.W. 1998. Qualitative Inquiry and Research
Popow, C., and Ohmann, S. 2007. Mixing Evaluation
Design: Choosing Among Five Traditions. Sage
Methods for Assessing the Utility of an Interactive InfoVis
Publications, Thousand Oaks, CA.
Technique. In J. Jacko (Ed.): Human-Computer Interaction,
[4] Faisal, S., Cairns, P. and Blandford, A. 2006. Subjective Part I, HCII (2007), 604–613.
Information Visualisations. In Proceedings of the Workshop
[16] Saraiya, P., North, C., and Duca, K. 2005. An Insight-Based
on Combining Visualisation and Interaction to Facilitate
Methodology for Evaluating Bioinformatics Visualizations.
Scientific Exploration and Discovery (London, UK, Sept. 11,
IEEE Trans. On Visualization and Computer Graphics, 11, 4
2006).
(July / Aug. 2005), 443-456.
[5] Glaser, B., and Strauss, A. 1967. The Discovery of Grounded
[17] Shneiderman, B. and Plaisant, C. 2006. Strategies for
Theory: Strategies for Qualitative Research. Aldine
Evaluating Information Visualization Tools: Multi-
Transaction, Chicago.
dimensional In-depth Long-term Case Studies. In
[6] Jordan, B., and Henderson, A. 1995. Interaction Analysis: Proceedings of Beliv 2006 (Venice, Italy, May 23, 2006).
Foundations and Practice. The Journal of the Learning
[18] Staub-French, S. and Fischer, M. 2001. Industrial case study
Sciences, 4, 1, 39-103.
of electronic design, cost, and schedule integration.
[7] Kobsa, A. 2001. An Empirical Comparison of Three Technical Report No. 122, CIFE, Stanford University.
Commercial Information Visualization Systems. In
[19] Tang, A. Tory, M., Po, B., Neumann, P., and Carpendale, S.
Proceedings of IEEE Symp. on Information Visualization
2006. Collaborative Coupling over Tabletop Displays. In
(San Diego, CA, USA, Oct. 22-23, 2001), 123-130.
Proceedings of the SIGCHI Conference on Human Factors in
[8] Kobsa, A. 2004. User Experiments with Tree Visualization Computing Systems (Montréal, Québec, Canada, Apr. 22-27,
Systems. In Proceedings of IEEE Symp. on Information 2006), 1181-1190.
Visualization (Austin, TX, USA, Oct. 10-12, 2004), 9-16.
[20] Tang, J.C. 1991. Findings from Observational Studies of
[9] Li, Q. and North, C. 2003. Empirical Comparison of Collaborative Work. International Journal of Man-Machine
Dynamic Query Sliders and Brushing Histograms. In Studies, 34, 143-160.
Proceedings of IEEE Symp. on Information Visualization
[21] Tory, M., Kirkpatrick, A.E., Atkins, M.S., and Möller, T.
(Seattle, WA, USA, Oct. 19-21, 2003), 147-153.
2006. Visualization Task Performance with 2D, 3D, and
[10] Liston, K., Fischer, M. and Kunz, J. 2000. Designing and Combination Displays. IEEE Trans. on Visualization and
Evaluating Visualization Techniques for Construction Computer Graphics, 12, 1, (Jan./Feb. 2006), 2-13.
Planning. In Proceedings of the 8th International Conference
[22] Tory, M., Sprague, D.W., Wu, F., So, W.Y., and Munzner, T.
on Computing in Civil and Building Engineering (Stanford
2007. Spatialization Design: Comparing Points and
University, CA, USA, Aug. 14-16, 2000), 1293-1300.
Landscapes, IEEE Trans. on Visualization and Computer
[11] Mazza, R. and Berrè, A. 2007. Focus Group Methodology Graphics (Proceedings of Information Visualization), 13, 6,
for Evaluating Information Visualization Techniques and (Nov./Dec. 2007), 1262-1269.
Tools. In Proceedings of 11th International Conference
[23] Tory, M., Staub-French, S., Po, B., and Wu, F. Physical and
Information Visualization (Zurich, Switzerland, July 2-6,
Digital Artifact-Mediated Coordination in Building Design,
2007), 74-80.
Computer Supported Cooperative Work (CSCW), in print.
[12] Messner, J.I., Riley, D.R., and Moeck, M. 2006. Virtual
Facility Prototyping for Sustainable Project Delivery. Journal
of Information Technology in Construction, 11, 723-738.You can also read