Welch Allyn Hscribe Holter Analysis System Clinician's Guide
←
→
Page content transcription
If your browser does not render page correctly, please read the page content below
Welch Allyn®
              Hscribe™
Holter Analysis System
      Clinician’s Guide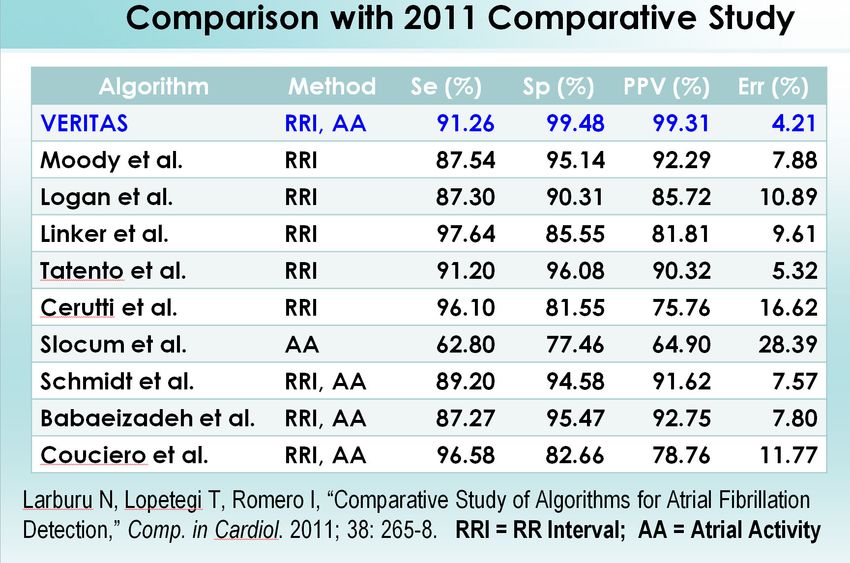
© 2021 Welch Allyn This document contains confidential information that belongs to Welch Allyn, Inc. No part of
this document may be transmitted, reproduced, used, or disclosed outside of the receiving organization without
the express written consent of Welch Allyn, Inc. Welch Allyn is a registered trademark of Welch Allyn, Inc.
HScribe, H12+, H3+ and VERITAS are trademarks of Welch Allyn, Inc. Software V6.4.0 2019-11

PATENT/PATENTS
hillrom.com/patents
May be covered by one or more patents. See above Internet address. The Hill-Rom companies are the
proprietors of European, US, and other patents and pending patent applications.

Hillrom Technical Support
For information about any Hillrom product, contact Hillrom Technical Support at 1.888.667.8272,
mor_tech.support@hillrom.com.

            9515-213-71-ENG Rev G
            Revision date: 2021-05

           901143 HOLTER ANALYSIS SOFTWARE

                                                                             and EU IMPORTER

 Welch Allyn, Inc.                                             Welch Allyn Limited
 4341 State Street Road                                        Navan Business Park, Dublin Road,
 Skaneateles Falls, NY 13153 USA                               Navan, Co. Meath C15 AW22
                                                               Ireland

hillrom.com
Welch Allyn, Inc. is a subsidiary of Hill-Rom Holdings, Inc.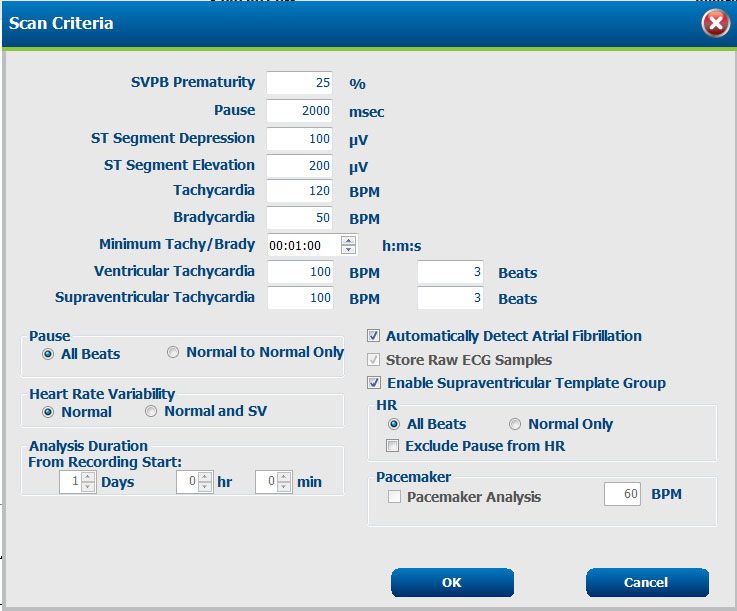
TABLE OF CONTENTS
1.      INTRODUCTION .......................................................................................................................................... 2
     PREFACE .......................................................................................................................................................................2
     OVERVIEW ....................................................................................................................................................................2
2.      PROCESSING THE ECG DATA........................................................................................................................ 4
     BEAT DETECTION ............................................................................................................................................................5
     TEMPLATES AND BEAT LABELING .......................................................................................................................................5
     HEART RATE CALCULATION ...............................................................................................................................................9
     ATRIAL FIBRILLATION DETECTION .....................................................................................................................................10
     SUPRAVENTRICULAR BEAT IDENTIFICATION ........................................................................................................................12
     ST SEGMENT ANALYSIS ..................................................................................................................................................13
     QT/QTC ANALYSIS .......................................................................................................................................................14
     PACEMAKER ANALYSIS ...................................................................................................................................................16
3.      FINAL REPORTS ..........................................................................................................................................17
     CONDENSED REPORT PATIENT INFORMATION WITH SUMMARY STATISTICS ..............................................................................17
     STANDARD REPORT PATIENT INFORMATION .......................................................................................................................18
     STANDARD REPORT SUMMARY STATISTICS ........................................................................................................................19
     NARRATIVE SUMMARY ..................................................................................................................................................20
     PROFILES ....................................................................................................................................................................21
     TRENDS ......................................................................................................................................................................23
     TEMPLATES .................................................................................................................................................................26
     ECG STRIP LIST AND ECG STRIPS ....................................................................................................................................27
     FULL DISCLOSURE .........................................................................................................................................................32
4.      QUICK REFERENCE FOR THE HOLTER ANALYST ...........................................................................................33
     RHYTHM AND CONDUCTION ...........................................................................................................................................33
     PREMATURE BEATS .......................................................................................................................................................39
     ST SEGMENT ANALYSIS ..................................................................................................................................................45
     PACEMAKER ANALYSIS ...................................................................................................................................................48

                                                                                                                                                                         Page | 1
1. INTRODUCTION
Preface
This guide is intended for qualified health care professionals who want to learn more about the HScribe™ Holter
system methods for analysis. It describes various aspects of the Welch Allyn VERITAS™ algorithm for Holter
analysis. Contents of the HScribe final report are explained in detail for the interpreting physician’s understanding.
A “Quick Reference for the Holter Analyst” section contains representative ECG strips of commonly encountered
rhythms and arrhythmias along with widely accepted medical definitions. This section also includes a description of
how the HScribe analysis program interprets each event. This guide does not cover the user actions such as editing,
review and results generation. These instructions are contained in the HScribe Holter Analysis System user manual.

Overview
HScribe is a high-speed, PC-based Holter scanner that performs analysis on continuous digital ECG data for up to
48 hours. The HScribe application provides full-disclosure data for arrhythmia analysis and incorporates Welch
Allyn’s exclusive VERITAS ECG algorithm for superior beat detection, QT/QTc analysis and ST segment analysis
to acquired ECG data. The HScribe system is indicated for use in a clinical setting, by qualified medical
professionals only, for patients requiring ambulatory (Holter) monitoring. Such monitoring is most frequently used
for the purpose of prospective and retrospective cardiac data and arrhythmia analysis. The analysis software
package includes detection and reporting features appropriate to the indications below:
     • Evaluation of adult patients with symptoms suggesting arrhythmia
     • Evaluation of adult patients with pacemakers
     • Reporting of time domain heart rate variability
     • Evaluation of patient’s response after resuming occupational or recreational activities (e.g. after myocardial
         infarction or cardiac surgery)
     • Evaluation of ECG documenting therapeutic interventions in individual patients or groups of patients
     • Clinical and epidemiological research studies
     • Evaluation of ECGs from infants is limited to QRS detection and heart rate reporting, including infants
         weighing less than 10 kg (22 lbs) if supported by the Holter recorder device, see specific Holter recorder
         User Manual.

The HScribe analysis process consists of the following steps and components:
    1. Reading the raw digital ECG data and then processing and storing the digital ECG data
    2. Beat detection and creation of templates (QRS shapes) and their group types
    3. Beat labeling and creation of navigable events within the following selections:
            • Strips
            • ECG
            • Summary
            • Templates
            • Histograms
            • Profile presentation with summary periods of data
            • Trend presentation in five-minute periods of data
    4. Creation of summary data to provide totals for each beat and event type

                                                                                                               Page | 2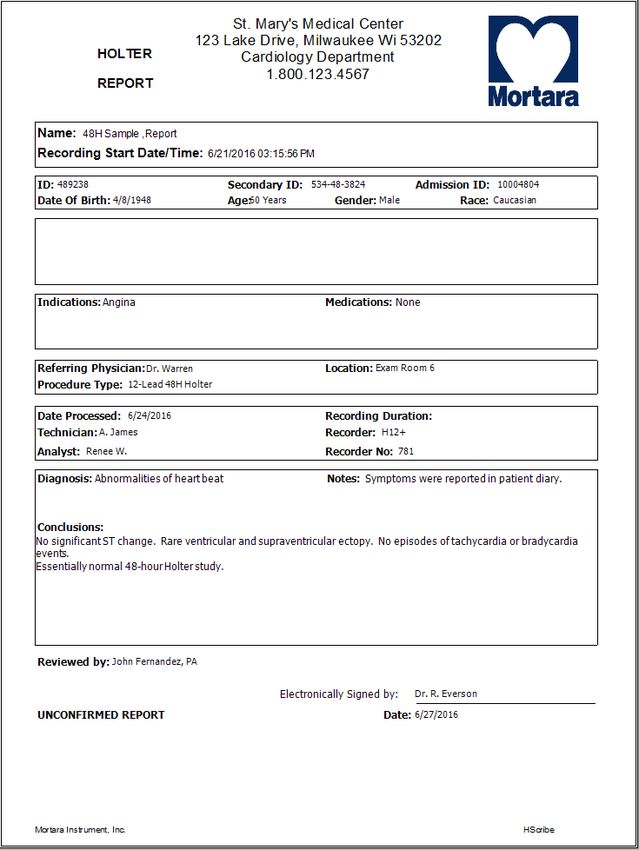
INTRODUCTION

Recording acquisition and the automatic computer analysis of a 24-hour or 48-hour recording is completed by the
HScribe program in approximately one minute. Recalculation after an editing change is immediate.

Templates, beats, and events are navigable and can be edited during review. Holter ECG strips are added to the final
report manually or automatically.

Holter results can be reported and exported in several different formats. The final report pages are numbered
sequentially with examples explained in this guide.

                                                                                                                Page | 3
2. PROCESSING THE ECG DATA
Accuracy of the Welch Allyn VERITAS analysis algorithm has been measured in accordance with the EC38 and
EC57 standards published by the American National Standards Institute and the Association for the Advancement of
Medical Instrumentation, as well as the international standard IEC 60601-2-47, who require sensitivity and positive
predictivity of ECG analysis algorithms be reported for both QRS and ventricular ectopic beat detection. Tests were
performed on all recordings excluding those with ventricular fibrillation and artificial pacemakers of two reference
databases: AHA and MIT-BIH. Performance results show that the Welch Allyn HScribe Holter algorithm has
99.9% QRS detection accuracy, the best performance published by any company.
Note: Evaluation of ECGs from infants is limited to QRS detection and heart rate reporting, including infants
weighing less than 10 kg (22 lbs) if supported by the Holter recorder device, see specific Holter recorder User
Manual.
AHA Database
Performance Measures Welch Allyn
QRS Sensitivity % 99.88
QRS Positive Predictivity % 99.91
Ventricular Sensitivity % 93.73
Ventricular Positive Predictivity % 98.40
False Positive Rate % 0.15
MIT-BIH Database
Performance Measures Welch Allyn
QRS Sensitivity % 99.95
QRS Positive Predictivity % 99.87
Ventricular Sensitivity % 95.24
Ventricular Positive Predictivity % 97.05
False Positive Rate % 0.22
It is well-known that Holter ECG signals are subject to ambulatory noise and artifacts that can make the data
difficult to analyze. Signal processing is performed to remove or lessen the types of noise and artifacts that occur
during ambulatory recording such as baseline wander and shifts caused by high electrode impedance, 50/60 Hz AC
interference, movement artifact, and muscular noise. The presence of noise and artifact in the recording can be
minimized by using high-quality monitoring electrodes with proper skin preparation and electrode placement during
patient hook up, explained in each device-specific user manual. Interactive review of the computer analyzed
recording by a qualified clinician will ensure a highly accurate final report.
The results of EC 57 testing on the Noise Stress Database testify the resilience of the Veritas algorithm to noise up
to twice the power of the ECG signal itself:
NST Database
Performance Measures Welch Allyn
QRS Sensitivity % 87.25
QRS Positive Predictivity % 89.44
Ventricular Sensitivity % 85.76
Ventricular Positive Predictivity % 72.42
False Positive Rate % 3.95
Page | 4PROCESSING THE ECG DATA
The HScribe analysis program applies a high pass filter to the data as it is acquired and read where appropriate for
the recorder. Each sample is stored accompanied by a status field that contains indicators for diary events, no data,
pacemaker spikes, and lead fail for each of the recorded channels.
Beat Detection
The analysis program checks the signal quality on each beat to determine the best quality channels to be used. Beat
detection channels may change dynamically as the analysis progresses. Intermittent periods of lead fail or artifact
will cause analysis channel switching to ensure accurate beat labeling. If required, the user can manually exclude
channels from being used in the detection algorithm.
Templates and Beat Labeling
The analysis program groups beat in templates based on shape related information. Template groups such as
Normal, Supraventricular*, Ventricular, Paced, and Unknown are then determined through evaluation of the
dominant beat morphology, beat characteristics, prematurity and presence of any pacemaker spikes.
Templates with similar morphologies are merged during the final processing step based on the correlation between
them.
Templates are presented in a total of 4 or 5 groups that may also contain other related beat types.
1. Normal
• Supraventricular*
• Bundle Branch Block
• Aberrant*
2. Supraventricular*
• Supraventricular*
• Aberrant*
3. Ventricular
• Fusion
• R-On-T
Once a beat is identified as being Ventricular, it is then compared to the previous beat. If the
previous beat is not ventricular, its RR interval is less than 500 ms, and the beat is less than one-
half of the previous beat’s RR, it is declared an R-On-T beat by the analysis program.
• Interpolated
• Ventricular Escape
4. Paced
• Atrial Paced
• Ventricular paced
• Dual Paced
5. Unknown
* When the user has selected Enable Supraventricular Template Group, all normal beats that meet
the set SVPB prematurity percent criteria and manually labeled aberrant beats will be in the
Supraventricular template group and not included in the Normal template group.
Page | 5PROCESSING THE ECG DATA
Each individual beat type is color-coded for rapid identification during review.
Automatically applied beat labels by the
analysis program: Manual beat labels:
Note: Deleted beats and beats relabeled as
artifact are removed
During review and editing, any applied beat label can be relabeled by the analyst with any one of the 13 beat labels.
Additionally, the analyst may relabel a beat or region of the recording as Artifact to exclude data from being used
for analysis, delete a beat or all beats within a template, and insert beat labels as desired. If an entire Template is
relabeled Artifact, a short episode of recording containing each beat that is part of the template will be relabeled
Artifact.
User-labeled Fusion and Interpolated beats will be classified as a ventricular beat type and used for ventricular
calculations. User-labeled Bundle Branch Block beats will be classified as a normal beat type. Supraventricular
beat types are identified by the program according to a user-defined prematurity percent setting and are contained
within Normal templates or Supraventricular templates when enabled, as their QRS morphology is classified normal
according to the dominant beat shape. Beats that are manually labeled as Normal or Supraventricular will not be
relabeled on the basis of prematurity. User-labeled aberrant beats will also be classified as a supraventricular beat
type.
Ectopic beats are grouped as "single" (one ectopic beat followed by a Normal beat), "couplets" or “pairs” (2
contiguous ectopic beats) and "Runs" (3 or more contiguous ectopic beats).
Page | 6PROCESSING THE ECG DATA
Event, Episode and Ectopy Presentation
Rhythm, QT and ST-segment analysis is performed using Welch Allyn’s advanced VERITAS™ algorithm to
determine isoelectric, Q, R, S and ST measurement points. The beat time, classification family, ST level, noise
property,
Q onset and offset, QT interval, template number, and RR interval is analyzed for every beat and is processed by
breaking down this information allowing the analyst to rapidly navigate to events and episodes through use of the
HScribe Profile, Histograms, and Trends.
User-defined scan criteria settings can be modified on a per-study basis or set as a default for the following:
• Pacemaker analysis on/off and minimum pacemaker rate
• Automatic atrial fibrillation detection on or off
• Supraventricular prematurity percentage
• Pause duration in msec and if pauses are excluded from minimum HR calculation
• Pauses to use all beats or only normal to normal beats
• ST Segment Depression and Elevation thresholds in μV
• Tachycardia/Bradycardia heart rate thresholds and minimum duration
• Ventricular Tachycardia rate and number of consecutive beats
• Supraventricular Tachycardia rate and number of consecutive beats
• Heart Rate calculation on all beats, or only normal beats
• Heart Rate Variability calculation on normal beats only, or normal and supraventricular beats
The analysis program will identify ventricular bigeminy when the following pattern is present for at least 3 cycles:
NVNVNV… Ventricular trigeminy is identified when the following pattern is present for at least three cycles:
NNVNNVNNV… Navigation to these rhythm patterns is best performed in the Profile display.
The analysis program will identify supraventricular bigeminy when the following pattern is present for at least 3
cycles: NSNSNS… Supraventricular trigeminy is identified when the following pattern is present for at least three
cycles: NNSNNSNNS… Navigation to these rhythm patterns is best performed in the Profile display.
Supraventricular or ventricular beats that occur during bigeminy and trigeminy episodes are included in the total
ectopic beat count. The profile and summary statistics report the total number of beats that occurred during the
bigeminy and trigeminy episodes (ventricular or supraventricular + Normal) in their respective columns.
Periods of artifact that occur within a tachycardia or bradycardia episode will be considered to have the same heart
rate and will be included in the duration of the event.
A colored Event Bar is selectable for display in the ECG view to indicate the start and end of an episode or event for
the types listed below. Users may also define up to three custom event types per Holter study. Some event episodes
may overlap and may not be visible. Event episodes are prioritized as follows:
• Exclusion (lead fail, artifact, user-removed)
• Atrial Fibrillation
• User-defined Event 1
• User-defined Event 2
• User-defined Event 3
• ST Depression
• ST Elevation
HScribe Profile information is broken into one-hour periods with calculated information presented for each period
and a summary for the entire recording period.
Page | 7PROCESSING THE ECG DATA
HScribe RR Intervals Histogram information is created displaying the number of intervals that fall within 20 ms
bins. This feature provides a graphical representation of the interval distribution allowing quick determination of
frequency and density of intervals as well as navigation to the most extreme events.
HScribe Trend information is broken into five-minute periods presenting a minimum, average and maximum
graphical representation of events and episodes.
Profile Events Histogram Events Trend Events
• Beat total • RR Interval • Min/Mean/Max Heart Rate
• Min/Mean/Max Heart Rate • Supraventricular • Bundle Branch Block Beats
• Bradycardia/Tachycardia Prematurity • Aberrant Beats
• Bundle Branch Block Beats • Pace SpikeQRS • Interpolated Beats
• Aberrant Beats • QRSPace Spike • Unknown Beats
• Interpolated Beats • Ventricular Run • Supraventricular
• Unknown Beats • Supraventricular Run • Atrial Fibrillation percent
• Supraventricular • Ventricular
• Atrial Fibrillation percent • Paced events and failures
• Ventricular • Min/Max RR
• Paced events and failures • Pauses
• Min/Max RR • ST Elevation/Depression
• Pauses • RR variability calculations
• ST Elevation/Depression • Min/Mean/Max QT/QTc
• RR variability calculations • User-defined episodes (3)
• Min/Mean/Max QT/QTc
• User-defined episodes (3)
Page | 8PROCESSING THE ECG DATA
Heart Rate Calculation
• Minimum and Maximum HR are calculated in a sliding window of 7.5-second intervals
• Mean HR is calculated on all beats within the time period (hourly, 5-minutes, 24-hours, etc.)
The analysis program calculates a heart rate for every beat based on the RR intervals in a 7.5-second window
centered around the beat with a two interval minimum. The minimum and maximum (current) heart rate is then
calculated using these heart rates in the defined profile period (e.g. one hour). The HScribe heart rate measurement
range is 20 to 300 BPM.
Minimum and maximum heart rates consider all beats with a valid RR, unless configured to exclude RR intervals
greater than the user-defined pause duration. The analysis program can also be configured to use only normal beats
(Normal to Normal intervals) for heart rate calculation.
Mean heart rate is calculated on all beats with a valid RR interval within the recording period. This calculation can
also be configured to use all beats or only normal beats.
There are two settings in the user defined Scan Criteria window that will affect heart rate calculation:
1) [Pause] Normal to Normal Only and 2) Exclude Pause from HR.
A pause is declared when the RR interval is greater than the user defined pause duration in the Scan Criteria
window.
The heart rate RMS % error, as measured according to EC57 for the AHA, MIT-BIH and the Noise Stress Test
databases are 2.69, 1.72 and 41.53 % respectively.
Page | 9PROCESSING THE ECG DATA
Atrial Fibrillation Detection
Atrial fibrillation episode detection is based on RR interval variability and P-wave analysis. Due to the nature of
atrial fibrillation, detection is performed on episodes rather than beat-by-beat. The analysis program first divides the
ECG into short sections of beats to compute the amount of variation in the RR interval of all beats with a normal
morphology and the probability of P-wave presence prior to the QRS. When a criteria threshold is reached, the
presence of atrial fibrillation is declared and the time of onset is established. Periods of artifact that occur within an
atrial fibrillation episode will be considered to have the same average heart rate and will be included in the duration
of the atrial fibrillation event.
In the interest of a high specificity, short (less than a minute) episodes of atrial fibrillation may not be seen by the
automatic algorithm. These clinically less important episodes may be added by the user when encountered, usually
during the review of supraventricular beats.
Regular (non-chaotic) variability, such as that which can be generated by occasional periods of supraventricular runs
with regular rate or atrial flutter with constant AV-conduction, is specifically excluded by the detection algorithm.
Irregular rhythm caused by sinus arrhythmia or frequent ectopic beats is also excluded in lieu of the presence of a P-
wave in all or the majority of beats.
The analysis program does not automatically detect atrial flutter episodes which tend to present a regular rhythm that
is not chaotic or random as well as a “P-wave” (flutter wave) correlated with the QRS complex. This episode type
can be manually classified by the analyst by applying a user-defined event.
The percent of atrial fibrillation is summarized hourly and for the entire recording. An Atrial Fibrillation peak
average heart rate value in the summary statistics reports the highest averaged heart rate of all of the atrial
fibrillation episodes. This result may be useful when intermittent periods of atrial fibrillation are present.
MIT-BIH Database
Performance Measures Welch Allyn
Episode Sensitivity % 74
Episode Positive Predictivity % 76
Duration Sensitivity % 94
Duration Positive Predictivity % 78
Duration False Positive % N/A
NST Database
Performance Measures Welch Allyn
Episode Sensitivity % N/A
Episode Positive Predictivity % 0
Duration Sensitivity % N/A
Duration Positive Predictivity % 0
Duration False Positive % 12.9
Page | 10PROCESSING THE ECG DATA
Performance has also been measured on the Physio net AFDB database
(https://physionet.org/physiobank/database/afdb/), a database specifically collected to test the performance of atrial
fibrillation algorithms. Results are as follows:
AFDB Database
Performance Measures Welch Allyn
Episode Sensitivity % 49
Episode Positive Predictivity % 95
Duration Sensitivity % 92
Duration Positive Predictivity % 99
Duration False Positive % N/A
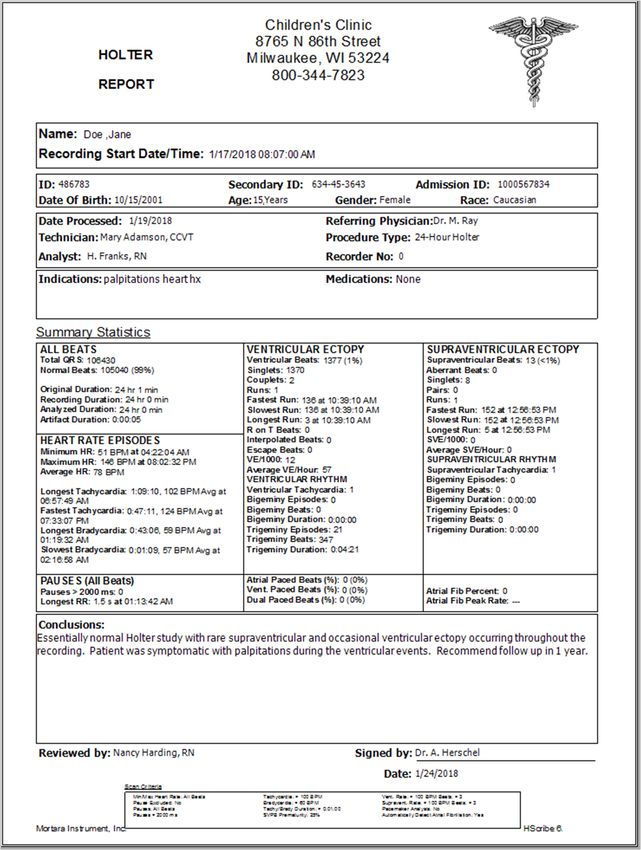
The AFDB database has also been used in a comparative study, using a slightly different way of measuring
performance. The VERITAS results measured in the same way testifies the high specificity of the algorithm and are
reported in the table below.
Page | 11PROCESSING THE ECG DATA
Supraventricular Beat Identification
Supraventricular beats are shaped the same as normal beats, unless they are aberrantly conducted, and are included
within the Normal templates and the Normal template group or the Supraventricular template group when the user
has enabled it. The SV Prematurity (%) Histogram presents a graph of beats according to prematurity %. This
offers a way to locate, review, and adjust prematurity percentage as needed.
The SV Prematurity % value is adjusted through selection of the menu
bar Edit and Scan Criteria dialog. The clinician can change the
SVPB prematurity percent to adjust when there are false calls. The
default is 25%.
If SVEs are under called, the value can be decreased (20%, 15%, etc.).
If SV beats are overcalled, increase the value (30%, 40%, etc.).
The entire Holter recording is updated immediately after a change to
the prematurity % value is made and the OK button is selected.
Supraventricular Prematurity Calculation: Supraventricular beat identification is based on the average R-to-R
intervals from the previous Normal beats. Each beat is associated with an envelope of 16 preceding normal R-R
intervals as demonstrated in the example below.
The Supraventricular template group, when enabled, and Supraventricular Ectopy columns within in the Profile tab
and the Rhythm section are also helpful to quickly navigate to the system identified rhythm events.
Note: When a run of SVT approaches or exceeds 16 consecutive beats, the prematurity of the next R-R interval is
likely to approach zero, since it is calculated compared to the previous 16 R-R intervals. Therefore, the next beat
will be labeled normal (N) and the run is ended. In this case, the clinician may edit the beats of a long run when
continuation of the run is determined. If, during a run of SVT, the next R-R interval is less than 400 ms (rate is
greater than 150 bpm), it is always labeled supraventricular (S) independent of prematurity and the run is not ended.
Page | 12PROCESSING THE ECG DATA
ST Segment Analysis
During analysis, a per-beat measurement of ST level is determined at 60 msec post J for each “normal” beat. ST
episode detection is performed by first processing all beats and then averaging the beat ST levels for each channel,
excluding aVR, for each five-minute period in the recording.
An ST episode in a channel is found when the user-configured threshold is reached AND a 100 μV step occurred
within one hour before the threshold was crossed, using the five-minute averages. Subsequently, the precise channel
onset of the episode is found by determining where the individual beat measurements crossed the threshold. If a
channel onset is found for more than one channel, the earliest of the channel onsets is used as the episode onset.
Starting from the episode onset, the next twelve five-minute episodes (one hour) are evaluated for being below the
threshold or showing a 100 μV step back. If the sum of these episodes in the next hour reaches a threshold, meaning
that the ST-level has come back consistently, the offset of the episode is declared. This is done on all the channels
where an onset was found, and the offset of the episode is determined where the last channel offset was found.
The same process is then repeated backward in time, that is, from the last five-minute episode in the recording to the
first, interchanging the offset and onset. Lastly, the ST-episodes found in the forward process are merged with those
found in the backward process.
The same process is used for ST-depression and ST-elevation.
For each ST episode, the maximum ST values for each channel are calculated and the time at which each occurred is
saved. The channel with the largest ST (average) value is labeled as the Primary channel, and the time of its
maximum value is declared as the event time of the episode. The average ST value for each channel is calculated.
The ST-segment analysis performance of the VERITAS algorithm has been tested on the European STT database
according to EC57. The results are depicted in the table below
STT Database
Performance Measures Welch Allyn
Discrepant measurements >100 μV % 7.3
Discrepant measurements >150 μV % 2.2
Discrepant measurements >200 μV % 0.8
Mean absolute error μV 49.1
Mean error μV 8.5
Standard deviation μV 66.1
Page | 13PROCESSING THE ECG DATA
QT/QTc Analysis
QT interval evaluation may be beneficial in detection of abnormal prolongation due to drug effects, electrolyte
imbalance or genetic diseases, in order to evaluate the risk of serious ventricular arrhythmias that can lead to sudden
cardiac death. The VERITAS™ algorithm automatically determines the QT from the interval between the earliest
ventricular depolarization activity and the latest “end-of-T” point. This determination utilizes average beats as
templates to reduce the effects of noise, but the actual QT interval determination is made on each single beat.
Each single QT value is corrected for previous heart rate (RR-intervals) by one of three formula's chosen by the
user: Welch Allyn Linear, Bazett or Fridericia. These formulae correct the QT value for heart rates that differ from
60 bpm (RR intervals of 1 second). The following formulae are used where HR is expressed in beats per minute and
QT, QTc and RR are expressed in seconds:
• Welch Allyn Linear: QTcL = QT + (1-RR) *S (See Note below)
• Bazett: QTcB = QT (HR/60)1/2 = QT (RR)-1/2
• Fridericia: QTcF = QT (HR/60)1/3 = QT (RR)-1/3
There are three user selectable choices for the RR intervals to be used for QTc calculation:
The previous RR interval in seconds; this method shows the immediate effect of the RR
RRprior interval on the next QT value.
The sum of the previous 16 RR intervals; this method is most similar to how the QTc is
RR16 calculated on a 10 second resting ECG.
A weighted average of the past 256 RR intervals; this method provides the optimal QT-RR
RRc correction according to current scientific insight, and is preferred for routine use.
Note: S is 0.143 (=1/7) if RRprior or RR16 is used and is 0.22 if RRc is used.
The use of RRc for QT correction in the ambulatory environment is recommended. The duration of the QT interval
is influenced not only by the previous RR-interval, but depends on the history of the heart rate. This is also called
QT-RR hysteresis. RRc takes this history into account. The weighting factors used have been calibrated to obtain
the best average correction in a wide range of subjects and heart rate histories. It was found that the population
average slope of the QT-RR relationship was higher than the traditional "Framingham" value when RRc was used,
ranging from 0.19 in a young healthy population to 0.24 in a heart failure population. It should be noted, however,
that significant individual differences exist.
The HScribe analysis program calculates an average QT and QTc duration in milliseconds of the normal beats in a
30-second window, centered on the time of interest. The Maximum, Minimum and Mean 30 second averages within
a profile episode are displayed. The measurement of reliable QT/QTc values during ambulatory monitoring can be
challenging and is dependent on recording quality. Proper assessment of periods of noise and the patient’s ECG
features are essential for correlation with any QT/QTc changes.
Page | 14PROCESSING THE ECG DATA
Time Domain RR Variability Calculation
During normal sinus rhythm, the heart rate varies from beat to beat. Heart rate variability, also known as RR
variability, results from the dynamic interplay between the multiple physiologic mechanisms that regulate the
spontaneous heart rate. Since short-term heart rate regulation is predominantly governed by sympathetic and
parasympathetic neural activity, examination of heart rate fluctuations provides a window to observe the state and
integrity of the autonomic nervous system.
Intervals used for RR variability calculations are those where the current, previous and second previous beats are
Normal. The user may configure the program to use both Normal and Supraventricular beats. Intervals within an
atrial fibrillation episode are excluded from analysis.
The HScribe RR Variability program calculates the following intervals in 5-minute periods from the start time of the
Holter recording to the end: RMS SD, SDANN, SDNN index, and pNN50.
RMS SD, SDNN index, and pNN50 are calculated using all qualifying 5-minute intervals over the period of interest.
In determining hour-by-hour statistics the program uses all qualifying 5-minute intervals for its analysis.
The HRV Triangular Index is calculated on the total number of RR intervals within the time period.
The SDANN value is calculated over a 24-hour period.
The following table contains definitions for each RR variability calculation:
pNN50 The percentage of Successive Differences in RR values greater than 50 ms (independent
of sign) during the time period.
RMS SD Root Mean Square of the Successive Differences in RR values during the time period. .
SDNN The average of five-minute period standard deviations of the RR intervals during the time
index period. Valid five minute periods are those that have at least two valid RR intervals. Also
referred to as Magid SD.
SDANN Standard Deviation of all five-minute average RR intervals during a 24-hour period. Valid
five-minute periods are those that have at least two valid RR intervals. Also referred to as
Kleiger SD.
HRV Total number of RR intervals during the time period divided by the height of the histogram
Triangular of all RR intervals measured on a discrete scale with bins of 7.8125 ms.
Index
RR variability standard deviation, plotted as “Std” under the Trend tab and printed on the final report trend page is
calculated using each 5-minute period representing the standard deviation of all RR intervals within the 5-minute
period. This presents a statistical formula for variation.
The measurement of reliable RR variability calculations during ambulatory monitoring can be challenging and is
dependent on recording quality. Proper assessment of periods of noise and the patient’s ECG features are essential
for correlation with any RR variability changes.
Page | 15PROCESSING THE ECG DATA
Pacemaker Analysis
Pacemaker spikes are identified independently for each channel. Spikes that occur in channels with lead fail are
ignored.
When pacemaker detection is enabled and pacing has been detected by the Holter analysis system, a spike marker at
500 μV amplitude will be present in the displayed waveform and in the final report ECG strips.
The analysis program will declare a beat is Atrial paced when the beat is normal and the pacer spike is within 250 to
125 msec before the beat detection point in any channel. Ventricular paced beats will be declared when the beat is
paced and a pacemaker spike is within 60 msec before the beat detection point. Dual paced beats are declared when
atrial and ventricular spikes are successive, the atrial spike is at least 60 msec before the ventricular spike and the
beat is identified as paced.
Pacemaker failures are identified as follows:
• Capture failure: a beat is not present after the pacer spike with an interval greater than 300 msec.
• Undersense: Pacer spike is earlier than expected and is less than one-third the time from its preceding beat.
• Oversense: The RR interval is greater than 1.2 times the expected paced interval after the beat; the
minimum pacemaker rate is used to determine the expected paced interval.
Page | 163. FINAL REPORTS
Condensed Report Patient Information with Summary Statistics
The first report page contains patient demographic information, recording information, personnel information,
summary statistical with tabular totals for recording events, and conclusions with an optional electronic signature
with date signed. Scan criteria used for the recording is located at the bottom of the page. Institution contact
information and a logo are customized by the administrative user.
Page | 17FINAL REPORTS
Standard Report Patient Information
The first report page contains patient demographic information, recording information, personnel information and
conclusions with an optional electronic signature with date signed. Institution contact information and a logo are
customized by the administrative user. The layout of this page and the fields included can be customized by Welch
Allyn Customer Service.
Page | 18FINAL REPORTS
Standard Report Summary Statistics
The summary statistical page consists of scan criteria used for the recording at the top of the page and tabular totals
for recording events. Page number and page type are printed on this and every following page.
Page | 19FINAL REPORTS
Narrative Summary
The narrative page repeats the tabular information in a narrative fashion. This page can be customized through use
of the Report Configuration Tool.
Page | 20FINAL REPORTS
Profiles
Profile pages provide hour-by-hour statistics with a summary of the entire recording in the bottom row.
Page | 21FINAL REPORTS
Page | 22FINAL REPORTS
Trends
The trends pages consist of 5-minute rhythm trends, QT trends, RR variability trends, and ST trends. Episodes of
ST elevation and ST depression will be listed on the ST trends page. The heart rate trend is repeated in each trend
for correlation. When the recording duration is between 24 and 48 hours, each trend page will represent a 24-hour
period.
Page | 23FINAL REPORTS
Page | 24FINAL REPORTS
Page | 25FINAL REPORTS
Templates
Templates pages consist of one page for each template group present within the recording. Each beat shape shows
the total number of matched beats and the percent of that beat shape within the template group.
Page | 26FINAL REPORTS
ECG Strip List and ECG Strips
An index of all included strips in the final report shows duration of each strip, ECG leads, annotations and page
numbers precedes the actual strips. Beginning after the initial 24-hours, each following 24-hour period is numbered
and enclosed in parentheses.
10-second, 12-lead ECG strip
Page | 27FINAL REPORTS
Page | 28FINAL REPORTS
7.5-second, 12-lead ECG strip
Page | 29FINAL REPORTS
Continuous 22.5-second strip followed by a 7.5-second, 2-channel ECG strip.
Page | 30FINAL REPORTS
5-minute, single-channel page strip
Page | 31FINAL REPORTS
Full Disclosure
Each full disclosure page contains 60 minutes of miniature ECG at 2.5 mm/mV
Page | 324. QUICK REFERENCE FOR THE HOLTER ANALYST
Rhythm and Conduction
Normal Sinus Rhythm – Sinus Rhythm consists of an electrical impulse originating in the Sino-atrial (SA)
node and radiating through both atria, traveling through the Atrio-ventricular (AV) node, continuing
through the Bundle of His, both the left and right bundle branches, the Purkinje fibers and finally
depolarizing the ventricular myocardium. When the SA node paces the heart at a rate between 60 and 100
BPM, the rhythm is called NORMAL SINUS RHYTHM; at a rate of 100 BPM or more, SINUS
TACHYCARDIA; at a rate below 60 BPM, SINUS BRADYCARDIA.
HScribe Approach – Our system chooses the predominant rhythm to be that patient’s “normal”. The analyst simply
allows the underlying rhythm to be identified as “Normal”. The highest HR and the lowest HR ECG times are
reported automatically. The analyst may add and annotate these strips as Sinus Tachycardia or Sinus Bradycardia as
desired.
Sinus Arrhythmia – When the SA Node paces the heart irregularly, typically a rhythmic increase and
decrease in rate that corresponds to respiration, the rhythm is called Sinus Arrhythmia. This is typically a
normal rhythm and shows that there is a good balance between the parasympathetic and sympathetic
nervous system (reflected in heart rate variability calculations).
HScribe Approach – When the sinus arrhythmia is pronounced (or marked), some beats may be incorrectly
identified as supraventricular when the prematurity percentage is set at 25, which is appropriate for most recordings.
It is recommended that the percent value be increased to prevent false SVPB calls.
You may first try 30% to see if beat labels are adequate and if not, increase the value in 5% steps until labeling is
satisfactory.
Page | 33QUICK REFERENCE FOR THE HOLTER ANALYST
Bundle Branch Block (BBB) or Intraventricular Conduction Defect (IVCD) – When a block exists along
either of the bundle branch pathways, the electrical impulse travels through the right or left bundle branch to
stimulate one ventricle and then through the septum to stimulate the other ventricle. The P-wave and PR
interval are normal, but because one ventricle is stimulated later than the other, the QRS complex is wider
than normal and is usually 0.12 seconds in duration or more. BBB or IVCD may also occur intermittently
during the recording.
HScribe Approach – The template corresponding to the QRS can be identified as normal or Bundle Branch Block so
the HScribe analysis program will consider any properly-timed QRS of this morphology in normal beat calculations.
Because HScribe updates the predominant morphology, any conduction changes will be reflected in the Template
view as well as the ECG and superimposition views.
First Degree AV Block – If a block exists in the AV node so that the electrical impulse is held for a longer
than normal period of time, the rhythm is called FIRST DEGREE AV BLOCK. This rhythm is
characterized by a PR interval prolonged to greater than 0.20 seconds.
HScribe Approach – Since the HScribe analysis program detects only the QRS, no lengthening of the PR interval
will be detected by the system alone. The Superimposition display allows easy detection of changes in the PR
interval. A PR interval within the normal range will be superimposed with the P-wave preceding the QRS, while the
onset of a first degree block causes the P-wave to slide farther to the left side of the superimposition display.
Page | 34QUICK REFERENCE FOR THE HOLTER ANALYST
Second Degree AV Block – Two types of SECOND DEGREE AV BLOCK are caused by blocks in the AV
node with only some of the electrical impulses from the atria conducting through to the ventricles. MOBITZ
I, also called WENCKEBACH, holds the impulse within the AV node for longer than the preceding electrical
impulse until the electrical impulse does not conduct through the AV node at all. This block is characterized
by a gradual prolongation of the PR interval followed by a non-conducted P wave. MOBITZ II blocks
impulses intermittently and PR intervals with conduction are normal. When a beat is dropped, a normally
timed P-wave occurs and is not followed by a QRS.
HScribe Approach – Our system will report the RR interval of the dropped beat in the Profile display as a long RR
interval or as a pause if it exceeds the set criteria. The RR interval histogram will show a characteristic shape of
more than one peak depending on frequency of the blocked beats.
Third Degree (Complete) AV Block – When none of the atrial impulses are conducted through the AV node,
the rhythm is called a COMPLETE AV BLOCK. Typically, a lower portion of the AV node or a ventricular
site takes over pacing function at a slow BPM rate. This is referred to as an “Escape Rhythm”. The atria
and ventricles will pace independently and there is no relationship between the P waves and the QRS
complexes.
HScribe Approach – Whether the escape rhythm is nodal (sometimes called junctional) or ventricular in origin, the
analysis program will identify the predominant rhythm as “Normal” with a slow heart rate. Intermittent episodes
will be found in the Profile (Min HR, Bradycardia episodes, Max RR, or Pauses), the RR interval Histogram with a
wide distribution, and can be observed in the superimposition display characterized by P-waves that appear to float
forward or backward relative to the QRS. Users can “march out” the calipers for assistance in the identification of
hidden P-waves as shown in the example above.
Page | 35QUICK REFERENCE FOR THE HOLTER ANALYST
Accelerated Conduction – Wolf-Parkinson-White (WPW) and Lown-Ganong-Levine (LGL) are both types of
accelerated conduction defects. Rather than the electrical impulse being delayed in the AV node, there is pre-
excitation of the ventricles by mean of abnormal conduction fibers that parallel and bypass the normal
conduction pathway. LGL presents as a shorter than normal PR interval (< 0.08 seconds). WPW presents a
slurring of the onset of the QRS making it appear wider than normal; this slurring is called a delta-wave.
Accelerated conduction defects may lead to re-entry tachycardia, sometimes mimicking ventricular
tachycardia.
HScribe Approach – These abnormalities can be easily detected by routine measurements of the PR interval using
the on-screen caliper tool. Intermittent changes will be apparent in the Superimposition scanning mode.
Nodal or Junctional Rhythm – When the predominant pacemaker is the AV node rather than the SA node,
the rhythm is called nodal or junctional. This rhythm is characterized by normal conduction and an inverted
P-wave, sometimes seen after the QRS complex or the absence of a P-wave altogether. The ventricular rate is
typically 40 – 50 BPM, but can be accelerated with a faster rate.
HScribe Approach – A change or absence of the P-wave is easily observed in the superimposition display. Onset of
this rhythm is seen as either the appearance of a negative P-wave or the disappearance of the P-wave. Intermittent
episodes may be found in the Profile under minimum HR.
Page | 36QUICK REFERENCE FOR THE HOLTER ANALYST
Idioventricular Rhythm (IVR) and Accelerated Idioventricular Rhythm (AIVR) – When the predominant
pacemaker is ventricular in origin, rather that the SA node or another supraventricular focus, the rhythm is
considered IVR if the rate is 50 BPM or less. AIVR is called if the rate is 50 to 100 BPM. These rhythms are
characterized by the absence of P-wave and a QRS of ventricular morphology.
HScribe Approach – When a ventricular focus is the predominant rhythm, the rhythm will be identified as
“Normal”. If the ventricular rhythm is transient, the episodes will be quantified in the ventricular run length
summary and can easily be found in the Profile view. Since the HScribe cannot distinguish between a sinus rhythm
with Bundle Branch Block and Idioventricular Rhythm, the user should inspect the Normal templates and rename
templates with Idioventricular Rhythm to "Ventricular".
Atrial Fibrillation – When the electrical activity in the atria is chaotic and many ectopic foci are firing
erratically, the atria are said to be “fibrillating”. Some impulses conduct through the AV node and stimulate
the ventricles. This rhythm is characterized by a chaotic baseline with no distinct P-wave and highly
irregular RR intervals.
HScribe Approach – Atrial fibrillation (Afib) is detected by irregular RR intervals and will be identified
automatically when “Detect Atrial Fibrillation” has been enabled. When intermittent, Afib episodes can be
navigated in the Profile display and by episode bars in the ECG view.
Page | 37QUICK REFERENCE FOR THE HOLTER ANALYST
Atrial Flutter – When one atrial focus fires repeatedly and regularly at a rate between 220 and 350 BPM, the
rhythm is called atrial flutter. Not all of the atrial impulses are conducted through the AV node so the
ventricular rate is typically much lower. The baseline appears “saw-toothed” and the RR intervals can be
regular or irregular, dependant on the variability of blocked impulses.
HScribe Approach – Atrial flutter is not automatically detected by the HScribe analysis program. This rhythm is
easily detected in the Superimposition display and will likely be seen when reviewing Min/Max HR, Min/Max RR
interval, and Pause ECG strips. Often the RR-histogram shows distinct peaks.
Escape Rhythms – Nodal and ventricular myocardial cells of the heart have inherent pacemaking ability with
a different intrinsic rate. Normal nodal foci fire between 40 and 60 beats per minute (BPM), normal
ventricular foci at 40 and lower BPM. These foci may provide an “escape rhythm” should the SA node fail to
pace. Escape rhythms are not infrequent in trained athletes during sleep; single escape beats also occur after
a sinus or AV block.
HScribe Approach – Any escape mechanism following an RR interval will most likely be seen when reviewing
minimum HR, maximum RR, and Pause events in the Profile display.
Page | 38QUICK REFERENCE FOR THE HOLTER ANALYST
Premature Beats
Supraventricular Premature Beats (SVPB) – SVPB is a beat initiated by an irritable focus in one of the atria.
The beat looks normal in morphology with a slight difference in the P-wave morphology, occurs early
compared to the normal sinus rhythm preceding it, and resets the SA node so that the next beat is slightly
later than the normal sinus rate.
HScribe Approach – An early beat (at least 10% early compared to the preceding rhythm) that is either normal in
morphology or matches a morphology that the analyst has determined is supraventricular in origin will be labeled an
SVPB. The SVPB prematurity % criterion is typically set to 25 and can be adjusted by the analyst depending on the
prematurity of the supraventricular ectopy and regularity of the rhythm. SVPBs are best found in the Profile
display and are presented as isolated, in pairs and runs with the longest and fastest run reported in the summary.
When the Supraventricular template group has been enabled in the Scan Criteria dialog, beats identified as
supraventricular are quickly reviewed and can be edited as necessary.
Wandering Atrial Pacemaker – When the predominant atrial pacemaker is not limited to the SA node, but
instead varies from one atrial focus to another, the phenomenon is called wandering atrial pacemaker. The
PR intervals and conduction are usually normal with slightly irregular RR intervals and slightly varying P-
wave shapes.
HScribe Approach – Changes of the primary pacemaker are easily detected in the superimposition display as
varying P-wave morphologies. The RR Histogram may be used to find irregularity.
Page | 39QUICK REFERENCE FOR THE HOLTER ANALYST
Nodal or Junctional Premature Beat (SVPB) – When an irritable site in the tissue surrounding the AV node
fires prematurely, the conducted beat is normal in morphology except for the P-wave. An inverted P-wave
preceding the QRS implies that the site is high-nodal; if the P-wave follows the QRS, the site is low-nodal; the
absence of a P-wave indicates that atrial depolarization is occurring during the QRS and that the site is mid-
nodal.
HScribe Approach – Our analysis program determines that the QRS is normal in morphology and early. The analyst
must determine that the P-wave is either non-existent or retrograde and can annotate the sample strip precisely.
Aberrant Supraventricular Premature Beat (SVPB) – When an irritable supraventricular site fires early
enough that the connective tissue is still partially refractory (has not completely repolarized), conduction is
abnormal and the beat is called an aberrant SVPB. This is characterized by an early P-wave followed by a
normal PR interval and a wide QRS.
HScribe Approach – Our analysis program will likely identify an aberrant SVPB as a ventricular premature beat
because of the different QRS morphology between normal and the aberrancy. If the analyst determines that the beat
is an aberrant supraventricular premature beat because a P-wave can be seen, the beat can be relabeled “Aberrant”
and will be included in Supraventricular calculations.
Page | 40QUICK REFERENCE FOR THE HOLTER ANALYST
Non-Conducted Atrial Premature Beat (APB) – When an irritable atrial focus fires early and the electrical
impulse does not conduct through the AV node because the conduction system is still completely refractory,
the missing beat is called a non-conducted APB. This is characterized by the presence of an early P-wave
without a subsequent QRS resulting in a longer than normal RR interval.
HScribe Approach – Any long RR intervals will be seen when reviewing maximum RR and Pause events in the
Profile and the RR Histogram displays. On-screen calipers can be used to see if the sinus rhythm is reset after the
long RR interval.
Supraventricular Tachycardia (SVT) and Runs – When one or more supraventricular foci fire in succession
(three or more beats) and the impulses conduct through to the ventricles, the ectopic event is called SVT
when it occurs at a heart rate of 100 BPM or more and is called a supraventricular run when it occurs at a
heart rate of less than 100 BPM. SVT can be sub-divided into Paroxysmal Atrial Tachycardia (PAT), when
only one focus is firing and the RR intervals are regular, and Multifocal Atrial Tachycardia (MAT) when
more than one focus is firing and the RR intervals are irregular.
HScribe Approach – Any run of three or more supraventricular premature beats is identified by the analysis program
as a supraventricular run that can be navigated through use of the Profile display. The analyst may choose to
annotate the Supraventricular runs with a rate of greater than 100 BPM as SVT, PAT or MAT.
Note: When a run of SVT approaches or exceeds 16 consecutive beats, the prematurity of the next R-R interval is
likely to approach zero, since it is calculated compared to the previous 16 R-R intervals. Therefore, the next beat
will be labeled normal (N) and the run is ended. In this case, the clinician may edit the beats of a long run when
continuation of the run is determined. If, during a run of SVT, the next R-R interval is less than 400 ms (rate is
greater than 150 bpm), it is always labeled supraventricular (S) independent of prematurity and the run is not ended.
Page | 41QUICK REFERENCE FOR THE HOLTER ANALYST
Supraventricular Bigeminy and Trigeminy – When supraventricular premature beats occur alternating with
normal beats so that every other beat is a supraventricular beat, the rhythm is called bigeminy. When every
third beat, the rhythm is trigeminy.
HScribe Approach – The analysis program will identify bigeminy when the following pattern is present for at least 3
cycles: NSNSNS… Trigeminy is identified when the following pattern is present for at least three cycles:
NNSNNSNNS… Navigation to these rhythm patterns is best performed in the Profile display.
Ventricular Premature Beat or Premature Ventricular Complex (VPB or PVC) – An irritable ventricular
focus that fires prematurely are called a VPB or PVC. It is characterized by the absence of a P-wave, a QRS
that is wide and bizarre in morphology, and typically is followed by a full compensatory pause (does not reset
the SA node). These beats can occur as single isolated beats, in couplets (or pairs), or in runs of 3 or more.
An R-On-T is a very early VPB that occurs on, or near, the peak of the T-wave of the previous beat, a very
vulnerable period during repolarization, that could initiate ventricular tachycardia and other lethal
arrhythmias.
Clinicians may quantify VPB frequency on a per hour basis or per 1,000 beats (average number of VPBs per
1,000 normal beats) to classify occurrence as rare, occasional or frequent during the Holter monitoring
period. The Lown classification scale from 0 to 5 may also be used. This quantification may be helpful to
gauge effects of antiarrhythmic drugs.
Page | 42You can also read