CAPITAL MARKETS DAY 2019 - Netcompany
←
→
Page content transcription
If your browser does not render page correctly, please read the page content below

NETCOMPANY

CAPITAL MARKETS
DAY 2019

Presenters
.

       Status on strategy                       Netcompany’s business model                  Update on the Danish market
     André Rogaczewski, CEO                         Claus Jørgensen, COO             Gustaf Löfberg, Country Managing Partner, DK

                          Update on the UK market                     Behind the quarterly numbers
                          Kevin Barrett, Partner, UK                     Thomas Johansen, CFO

                                                                                                                          Page 2
Agenda of today
.

                                       Time            Page

    1   Status on strategy             10:30 – 11:00          5

    2   Netcompany´s business model    11:00 – 11:30          15

    3   Update on the Danish market    12:30 – 13:15          32

    4   Update on the UK market        13:15 – 13:45          47

    5   Behind the quarterly numbers   15:00 – 15:30          58

                                                                   Page 3
Agenda
.

                                        Time            Page

    1    Status on strategy             10:30 – 11:00          5

    2    Netcompany´s business model    11:00 – 11:30          15

    3    Update on the Danish market    12:30 – 13:15          32

    4    Update on the UK market        13:15 – 13:45          47

    5    Behind the quarterly numbers   15:00 – 15:30          58

                                                                    Page 4
Investment highlights
.
                                                   Satisfied and recurring
                                                   customer base
    Unique scalable business                                                          Unique financial
    model with proven ability                                                         profile and multiple growth
                   to deliver                                                         levers
            19 years track record of                                                  Only IT services company in Europe
      sustainable profitable growth                                                   and North America with +EUR 200m
                                                Establish Netcompany                  revenue, +20% growth, +25% EBITA
       based on continued focus to
                      always deliver               as the Northern                    margin over the last +10 years,
                                                  European market                     strong free cashflow and pay-out
                                                                                      ratio of above 80%
                                                 leader in IT services

                       Founder driven                                            Ability to attract
                     with strong vision                                          the best IT talents

                                          High growth markets driven by
                                          technological shift to strategic
                                          IT solutions
                                          Core market CAGR 2016-2022 of 10-12%
                                                                                                                           Page 5
Track record of industry-leading growth and sustainable profitability
.

                                                                      Revenue growth

    Reported financials (DKKm)
                            CAGR: 21%                                                   CAGR: 23%                                 CAGR: 39%
                             (‘06-’11)                                                   (‘11-’15)                                 (‘15-’18)

                                                                       Significant investments in
                Strong growth and margin despite
                                                                     technology, infrastructure and
                       economic downturn                                                                                                       2.053
                                                                        public sector expansion
                                                                                                                                      1.416
                   41%                                                                                  629    758        900
                               32%                    33%                      400                      36%               28%         37%
         27%                               32%                     32%                      461                                                26%
                                                                               24%                             27%
                   35%         205          222        261                                  18%
         127       179                      8%                     327                                                                28%      25%
                                                                   25%         22%                      24%    21%        17%
                               15%                     18%                                  15%
         '06A      '07A        '08A         '09A       '10A        '11A        '12A         '13A        '14A   '15A        '16A       '17A     '18A
                                         Revenue (DK)1        NO          UK           Adjusted EBITA-margin    Organic Growth

                            Challenger                                                National champion                     Northern EU challenger

                                                                                                                                                     Page 6
Netcompany today – 10 offices with +2000 IT people in six countries
.

                                         Vietnam

                                    Ho Chi
                                    Minh, VN
                                5   (Emp. 92)

                                                                                                Oslo, NO
                                                                                         4
                                                                                                (Emp. 184)

                                                                      Aalborg, DK 3        Copenhagen, DK
                                            Leeds, UK                 Aarhus, DK       3 1 (Emp. 1.235)
                                                              5
                                               Derby, UK          5
                                                                                                             2   Warsaw, PL
                                                                  5            2                                 (Emp. 224)
                                          London, UK                               Delft, NL
                                           (Emp. 363)                              (Emp. 105)

     Proven capability of scaling Netcompany from ~250 in 2010 to +2,000 employees globally in 2019

        Note 1: Average number of employees in Q1 2019, including freelancers and contractors
                                                                                                                              Page 7
Netcompany’s core offering is to develop and deliver innovative and
differentiated IT solutions
.

    Gartner’s pace layered approach reflects the shift in spending focus from                           Innovation
                    records to innovation and differentiation                                           • Experimental solutions with continuous short iterations to
                                                                                                           test new ideas
                                                                                                        • At the forefront of each new technological wave
                                                                                          15-20%
                                                              Innovation               ‘16-’22 CAGR 1

                                                                                                        Differentiation
                                                                                                        • Differentiating systems to give organisations competitive
                                                            Differentiation
                                                                                          8-12%             strategic advantage with tailored solutions
                                                                                       ‘16-’22 CAGR 1   • Added complexity and governance compared to innovative
                                                                                                            solutions due to strategic importance, but still with need
                                                                                                            for agility to keep in front

                                                                                           0-4%         Records
                                                                Records                ‘16-’22 CAGR 1   • Commodity (one size fits all)
                                                                                                        • Processes such as accounting that do not provide a
                                                                                                           competitive advantage and should be bought as
                                                                                                           standardised, not tailored solutions

                  2016                                            2022

                Note 1: Based on company market study, core market growth in Denmark
                Source: Netcompany, Gartner, company market study                                                                                          Page 8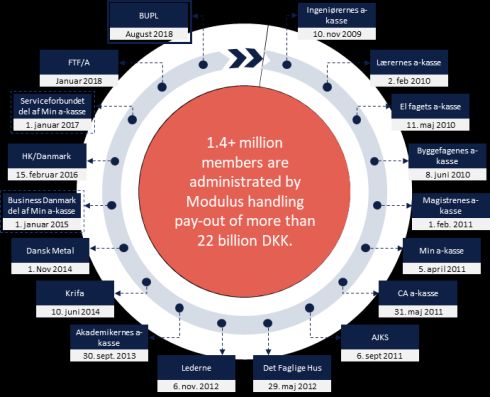
Netcompany directly impacts the life of Danish citizens across their lifecycle
.
                                                                                                                                                      - SELECTED EXAMPLES -

             From the birth of             over everyone’s first day in                                                                           ensuring the financing
                                                                              to people’s everyday life           until the golden age
             the digital citizen                     school                                                                                   of the Danish welfare society

             Family benefits                AULA Student Platform                  BORGER.DK                         Social Pension                          ICI
                - ATP -                          - KOMBIT -                  - Agency for Digitisation -                 - ATP -                  - Ministry of Taxation -

    Paying out DKK17bn yearly in child   Giving teachers and parents the      Single access point for all     Paying out DKK120bn yearly in    Collecting public debt to the
           and youth benefits                    tools to develop          government self services for all    state pension to one million   society including income taxes,
                                              children's education                 Danish citizens                    Danish citizens                  fees and fines

                                                                                                                                                                       Page 9
Our core market is large and fast growing with ample room to grow
.

                                                                                                                                                     Records            Differentiation             Innovation
             ~8-10% CAGR1                                         ~9-11% CAGR1                                           ~7-9% CAGR1                                             ~8-10% CAGR1
             Core market (’16-’22E)                               Core market (’16-’22E)                                 Core market (’16-’22E)                                  Core market (’16-’22E)

                                 ’16 - ’22                                              ’16 - ’22                                       ’16 - ’22                                                     ’16 - ’22
                                  CAGR                                                   CAGR                                                                                                          CAGR
                                                                                                                             ~ DKK119bn CAGR
                 ~ DKK21bn                                             ~ DKK13bn                                                                                                       ~ DKK63bn
                                                                                                                                                  14-20%
                                  15-20%                                                 15-20%               ~ DKK77bn                                                                                15-20%
    ~ DKK12bn                                        ~ DKK7bn                                                                                                       ~ DKK36bn
                                                                                                                                                   7-11%
                                   8-12%                                                  8-12%                                                                                                         8-12%
                                                                                                                                                   0-4%
                                    0-4%                                                  1-5%                                                                                                          0-4%

      '16A           '22F                                 '16A               '22F                                 '16A               '22F                                '16A               '22F

    Market                        ~ 10%              Market                             ~ 2%                  Market                             < 1%               Market                           < 1%
    share2                                           share2                                                   share2                                                share3

                Note 1: Core market: Public Sector: Central Government, KOMBIT and larger municipals; Private Sector: Medium and large companies with strategic focus on digitisation and complex
                projects that require sophisticated IT capabilities; 2: Based on core market definition and Gartner approach, as of 2016
                                                                                                                                                                                                     Page 10
Strategy 2022: Establish Netcompany as an emerging Northern European
market leader
.
Set the standard for IT services
and establish Netcompany as the
Mission & ambition Northern European market leader in IT services
Gain market share Export business model Utilise synergies and cross selling
• Deliver on time, on budget and in agreed • Continue export of business model in • Exploit sector specific knowledge across
quality Vietnam, the Netherlands and the UK (fully borders
• Focus on complex projects requiring implemented in Norway) • Optimise staffing of projects independent of
sophisticated IT capabilities • Expand into other Northern European geographical presence by focusing on
• Grow faster than the market in all countries, e.g. Sweden and Finland outcome based projects
geographies • Explore greenfield possibilities in selected
markets
Strategic initiatives
Outstanding talent Differentiated management model Unique, agile, deliverable-driven
& career development model & integrated sales approach methodology & toolkit
Preserve the Netcompany culture
How we win
Continue advancing Continue to contribute to Continue attracting and retaining
Top imperatives the digitalisation agenda enhancement of the talent pool the best IT people
Page 11European expansion based on disciplined M&A strategy
.
Strategic market prioritisation
• Adequate digitalisation level with
high growth segments
• Public digitalisation strategy
• Private sector with strategic focus on
digitalisation
• Attractive competitor landscape
360 degree target screening and due
Sweden diligence
Finland • Strong IT competencies
• Cultural fit
Norway
• Innovative and strategic mindset
• Fundamentally sound business
performance
UK • Proven track record of winning
Denmark tender bids
• Founder driven
Netherlands • Motivated local leadership
Tactical flexibility
• Greenfield startup in selected
markets
• Bolt-on acquisitions in large, existing
Netcompany market Strategic priority market markets
Page 12
Source: NetcompanyQDelft – the perfect match
.
QDelft – a perfect key to the Dutch market with demonstrated ability to The Dutch market is highly attractive with key characteristics similar
win and deliver large public projects to the Danish market but significantly larger
• Delivering complex and business critical IT solutions
• IT people leading IT people with strong talent pool
• Strategic public project portfolio
• Sound business culture
• Founder driven
• Office on Technical University Delft campus facilitating easy access to
talent pool Market size approx. three
times the Danish market
Key facts
Amsterdam, NL
5
• DKK +50m revenue 1 Haag, NL
5
Delft, NL 5 Large public sector with
• +20% revenue growth2 focus on digitalisation
•
+/- +/- 0 EBITA in 2019 1
Strong IT talent pool
• Based in Delft
• 105 employees
Note 1: Expected performance in 2019, source: Netcompany
Note 2: Revenue growth from 2017 to 2018, reported numbers
Page 13Agenda
.
Time Page
1 Status on the strategy 10:30 – 11:00 5
2 Netcompany´s business model 11:00 – 11:30 15
3 Update on the Danish market 12:30 – 13:15 32
4 Update on the UK market 13:15 – 13:45 47
5 Behind the quarterly numbers 15:00 – 15:30 58
Page 14Netcompany operates its own institutionalised, repeatable and scalable
business model
.
Disruptive management model Outstanding talent &
& integrated sales approach career development model
SALES &
PEOPLE
DELIVERY Young workforce with
Combined sales & delivery
outstanding talent
Decentralised management
Delivering Merit-based career path
digital
transformation
Effective, lean pyramid
IT-people leading IT-people
structure
EXECUTION
Unique, agile, deliverable-driven methodology & toolkit
Scalable in-house Truly agile delivery model Execution on time and
developed methodology in budget
Page 15Sales & delivery
IT People leading IT people - the core of the Netcompany delivery model
.
1 2
Accurate pre-selection of Unrivalled understanding of
projects assures less resources requirements, ability to
being wasted in low communicate solutions and estimate
win rates resources needed
IT-people leading
IT-people
~67% FULL
Average win rate Accuracy in
over the last 5 years1 Project Setup
3
Delivery on time and on budget with the same team that sold the project (bid team)
100% GREEN
Delivery Track Record2
Note 1: Average of 2015-2018. Total value of contracts won as a percentage of total potential value of contracts tendered for in each year; 2: Each project delivered on budget, on time
(defined as including up to one month of delay) and within scope (defined as delivery of 12 more than 95% of expected project net present value)
Page 16Sales & delivery
Above 90% of senior management are IT professionals – leading IT people
.
11% 13%
24%
31%
100%
89% 87%
76%
69%
Consultants Senior consultants Managers Principals Partners
IT background 1 Other background
Note 1: As of Dec-2018: Employees with IT background or significant IT experience
Page 17Sales & delivery
Next-gen IT – from specialists to holistic profiles
.
Old school Next-gen IT skills
Holistic consultants with strong IT skills as well as
understanding of business and solutions
Developer Business Analyst
Project Manager: Same profile but more experienced and
proven ability to lead
Narrow focus specialists No IT skills
Code Deploy
Plan Operate
Project Manager Operation Build Monitor
Test Release
Through true DevOps
Administrator Infrastructure focus
Page 18Sales & delivery
IT people leading IT people unlocks unique accuracy and commitment in
resource estimation before signing of contract
.
Resource Estimation Delivery
Bottom - Up Approach Top - Down Approach Full accountability, as the same
manager is responsible for scoping,
resource estimation and delivery
Identify and estimate hourly budget Benchmark project team structures
of all components of the solution to actual realised similar projects
Verify component estimates & Consolidate teams into optimal
Fully integrated consolidate into resource estimate organisation and resource estimate Delivery on time
bottom-up & top- and on budget
down approach
Two-way verified solid and committed resource estimate
KEY Developers trained in Managers are IT people able to
DELIVERY DRIVEN FULL TARGET MARGIN ACHIEVED
PRICING ENABLER accurate estimation technically verify all estimates
Estimates only done by developers Bottom-up or only done by Managers Top-down will set projects of on unrealistic terms
Integrated approach requires special skills with both developers and managers
Page 19Sales & delivery
Sourcing model provides flexibility and scalability to support high growth
.
Access to huge, international resource pool of talented IT
…working together across the solution life-cycle
people…
Resource flexibility through global sourcing
A
centres
Project team setup with local and global delivery
B
Denmark 1
Vietnam 1 resources
1,235 employees 92 employees
86%
>5% freelancers No freelancers
UK 1 Poland 1 C All employees covering full life-cycle
363 employees 224 employees
4%
65% contractors No freelancers
Norway 1
Sourcing type
184 employees
10%
>5% freelancers 3 1 1) Sales
2 2) Project management
Netherlands2 3) Delivery
0% 105 employees
0% freelancers Revenue share (Q1 2019)
Note 1: Q1 2019 figures
Note 2: QDelft, Netherlands. Acquired 13 May 2019
Page 20People
Proven recruitment platform attracting the best IT talents
.
Netcompany is the employer of choice for talented IT
... supported by strong employer branding
graduates...
• Netcompany is the #7 choice in the minds of students and improving in • Number of events and related initiatives at or aimed at
ranking target universities in 2018
#1 among Danish
Student rankings, DK¹ companies
(Universum rank, 2015 – 2018
0 7
10 20 15 12
20 35 34 24 19 16 9 15 15
30
2015 2016 2017 2018
Huge available target pool in Denmark 2... ... complemented with global footprint
Total students
Clear strategy to address key talent Netcompany talent pool
available p.a.
Master, Diploma ~5,700
and Bachelor IT Total 2.900
Resource pool graduates
Experienced ~1,800
IT hires Total
1.300 50,000+
IT graduates annually in
Total Danish ~7,500 other core geographies
4.200
Resources Total
Note 1: Source; Universumglobal.com/rakings/denmark
Note 2: Netcompany, Universum Research
Page 21People
Effective recruitment conducted by delivery focused managers or partners
.
ATTRACT DEVELOP SUSTAIN
Stringent hiring criteria defined Fast time-to-hire process Superior offer win rates
30
Top performers in IT or science related degree Dedicated talent screening
1 resources (DK, UK, NO, PL,
HIGHEST TECHNICAL STANDARDS VN and NL)
~800
Assessment via case-based interviews conducted by Candidates interviewed in
IT people / project managers to assess fit into the 2018 in Denmark
2 model of integrated sales and delivery
75-80%
BUSINESS ACCUMEN COMBINED WITH IT SKILLS
48 HOURS Successful offers
From interview
to offer
Personal fit with Netcompany’s performance
culture
3 7 DAYS
From interview
AMBITION TO GROW
to contract signing
Page 22People
Onboarding process – new hires on project and fully productive from day 1
.
ATTRACT DEVELOP SUSTAIN
Pre start Month 2-6 Month 2-6 Month 2-6 Month 7-12
Introduction mail/Code of Assignment of Buddy and All new employees are
Info Conduct/other intro Mentor welcomed at NC Update
Participation in Code of Participation in the first
Academy Pluralsight for Non-IT-Profiles
Conduct relevant Academy Seminar
First project evaluation and Second project evaluation and
Development First mentor meeting
second mentor meeting third mentor meeting
Breakfast with CEO and COO.
Management Meeting with Project manager
Lunch with Area Director
Employer Participation in potential Opportunity to participate in
Branding Netcompany events Employer Branding events
Survey – Your first week in
Survey Survey – Recruitment process Survey – Code of Conduct Netcompany/Your first month
in Netcompany
Page 23People
Institutionalised career model accelerates development and attracts best IT
people
.
ATTRACT DEVELOP SUSTAIN
Netcompany’s career development program offers a
With specialisation after initial new-starter level
structured career path
Consulting Consulting Generalist Consulting Career
Architect Specialist
Description
tracks
Partner Consultants
Principal Master ▪ New hires start as generalists before specialisation into
Architect Specialists 1 & Test
either Specialist, Generalist, or Architect consultants
Specialists
Managing Principal
Architect ▪ Technical expertise in the management of technical
Manager A Architects
architecture and software development
B Senior Consultant ▪ Project management, sales, relations, management of
B Generalists
A C client expectation
Senior Architect Senior Specialist
1 C
▪ Development of domain expertise, acquire profound
Specialists
Consultant & Test Specialist practical knowledge and be a technical programmer
Others (not
Accelerated career path with large progression visibility ▪ Analysts, Interface or System consultants, etc.
illustrated)
attracting top performing IT talent
Page 24People
High performance culture instilled by continuous feedback from all
managers
.
ATTRACT DEVELOP SUSTAIN
Institutionalised and management driven performance review
Bi-annual performance scoring of employees
based on 5-step banding rank
Band Criteria
High
1 Top-performers
Performance vs.
HR
2+ Ahead of expected performance vs. peers
peers
Cycle
2 On-track performance towards promotion
2- Behind expected performance vs. peers
3s are put on performance watch for 9-12m
3 Consistent 3s result in termination
Low
100% of employees are provided with performance feedback Up-or-out culture enhanced within the organisation
Note 1: Employees in Denmark, Poland and Norway
Page 25People
High employee satisfaction to retain the best people
.
ATTRACT DEVELOP SUSTAIN
Young and highly satisfied
Employee NPS score outperforms
Attrition rate 1
the tech sector and Europe 2
32 workforce initiates a virtuous
AVG. AGE
cycle
36% 3
Young and highly satisfied employees are strong
promoters amongst top grads
19%
18%
17% 6%
Employees are continuously developed by
-1% experienced IT people, which accelerates
2016A 2017A 2018A progression and attracts top grads
-26% -26%
Top performers work within a superior delivery
model for complex projects that are highly
Technology Telco Europe Global appealing to the top IT grads
Note 1: Attrition rate adjusted for the close down of the Hanoi office in Vietnam
Note 2: Source; Management Consultancy IP 2014 (out sample of 15,015); Netcompany; Glassdoor; Statista; Company information
Page 26
Note 3: 2019 figure. Source; NetcompanyExecution
Agile delivery methodology based on scalable project cell structure
.
IT people leading IT people ...within an agile and collaborative team structure
One language across the organisation Deliver large complex projects in sub-projects with small teams developing in sprints
• Full accountability and technical ability of each developer
• Development in close collaboration with all stakeholders
• Resources take holistic view and are retained over the project
life-time minimising handovers and ensuring commitment
DELIVERY Interdisciplinary • Scaling of projects through additional teams or resources that hit
TEAM Teams the ground running with the same background and training
• Fully scalable across the organisations at constant quality as all
Project projects follow codified methodology that allows managers to
example deep-dive and focus on essence rather than style
CODIFIED
METHODOLOGY
DEVELOPMENT model combining Collaborative model with focus Best practice
agility and control on TRANSPARENCY TOOLKIT LIBRARY
Page 27Execution
Execution approach combining agility and control to deliver on time and
budget
.
DEVELOPMENT
Traditional Waterfall Netcompany Agile Development
Approach Approach Approach
Iterations
Define Foundation through Analysis
Analysis
Build in sprints
Design Breaking into releases
Test
Build in sprints & gather feedback Gather
feedback
Deploy
Test & Deploy to create speed to market
Long time to market Agile and collaborative Agile and collaborative
Limited agility Continues focus on target Lack of defined solutions
No accountability Controlled change process to fulfil customer needs Lack of end focus
Lack of budget and scope
Late collaboration with client Strong focus on quality and progress monitoring commitment focus
Preferred method over last decades – Recent years alternative approach – adopted
now generally considered old fashioned but
Netcompany combines agility and control, the by many with major issues around lack of
still in use at many peers best of two worlds focus and control
Page 28Execution
Focus on full internal and external transparency
.
TRANSPARENCY
Very accurate updated project reporting based on real-time Netcompany Client
Netcompany Project View
developed methodology used throughout the organisation Project View
RESOURCE ALLOCATION INTERFACE PROJECT STATUS
Consistent and Early review and
thorough reporting approval of
allows early deliverables
detection of ensures alignment
deviations and between
possibility to adjust Netcompany and
before problems AUTOMATED TESTING TRACKING the client
arise
Real-time data feed 24/7 unfiltered
of project status access to project
status
Page 29Execution
Uniform project documentation in toolkit provides predefined templates and
work packages shared between customers and developers
.
TOOLKIT LIBRARY
Deliverables Visualisation Prototypes
• Identical set of deliverables driving the Netcompany • Visualisation of the solution is key deliverable, providing easy
methodology across all projects access into projects and replacing more complicated design
• Clear structure of deliverables to be produced at each stage of a documentation
project with approved examples of best project executions • Prototypes start with early sketches of the screens of the system,
attached and are then implemented in clickable prototypes that act like
• Set of deliverables drive processes ensuring continuous client the end system
feedback and serve as end documentation of the process
Deliverables:
Documents describing different aspects of the system, including design,
programming guidelines, test scripts and operations manual
Page 30Agenda
.
Time Page
1 Status on strategy 10:30 – 11:00 5
2 Netcompany´s business model 11:00 – 11:30 15
3 Update on the Danish market 12:30 – 13:15 32
4 Update on the UK market 13:15 – 13:45 47
5 Behind the quarterly numbers 15:00 – 15:30 58
Page 31Denmark at a glance
.
Overview of key people and organisation Key financials 2018 2017
Gustaf Löfberg Country MP
Age: 48 NC since inception
Revenue 1,544m 1,220m
(DKK)
Adjusted
EBITA
461m 359m
17 ((DKK)¹
partners
Share of
Aalborg group
(Est. ‘10) revenue
1,235 Aarhus
FTEs2 (Est. ‘06) Copenhagen
(Est. ‘00) 75% 86%
Note 1: Adjusted EBITA adjusted for special items (non-IFRS)
Note 2: Average number of employees in Q1 2019
Page 32Denmark – a highly digitised and mature market
.
Key market characteristics 1
One of the most digitised countries
and developed IT markets
Public focus on modern IT and
modernisation of municipalities
Fragmented private market with
medium/large companies focusing
on digitalisation Netcompany is well positioned to continue delivering
innovative complex solutions from a position
with superior NPS and in a market
with plenty of room to grow
Incumbents with low NPS 2
Note 1: Source: Leading consulting firm, Netcompany, I-DESI (International Digital Economy and Society Index) 2015 Main Ranking
Note 2: Net Promoter Score
Page 33Public core market size and outlook
.
Netcompany public core market Growth drivers
Digitalisation will form the basis for the efficient
welfare state
Public shift towards modernisation and replacement
Public IT service of legacy systems
market 2016
DKK ~ 11bn Focus will be innovation combined with robust
delivery as current solutions needs to be safely
replaced by modern and efficient solutions
✓ IT service market where Netcompany
offers solutions IT public core market spend (DKKbn)
Addressable × Excludes dedicated IT
market 2016 hardware/software; infrastructure CAGR 16-22
DKK ~ 7bn ~8
8-10%
✓ Central government, centralised joint
Core ~5
projects for all municipalities, select
CAGR market larger municipalities
‘16-’22 2016
✓ Regions targeting selected projects
8-10% DKK
~5bn × Small individual municipalities withNetcompany has high historical win rates on public tenders
and is taking market share from incumbents
.
Track record of ~67% win rate in recent years… … with several high-profile tenders won since 2015
Total
Totalvalue
valueof
ofparticipated
participatedDK
DKpublic
publictenders
tenders(in(inDKKbn,
DKKbn,potential contract
potential value)
contract value) Relative size for illustrative purposes
44% 72% 87% 53% Other
Rammeaftale (SKAT)
~67% average win rate driven by differentiated sales & delivery model with integrated sales
DUBU (KOMBIT)
and delivery teams
FLIS (KOMBIT)
3.5 Nyt SIS (Ministry of Education)
0.5 Rammeaftale ATIS (Working Environment Authority)
KY (KOMBIT)
2.1 1.8
1.9
0.6 0.9 Social Pension (ATP)
1.1 3.0
1.5 1.0 Rammeaftale ICI
0.8 (Tax Ministry)
2015A 2016A 2017A 2018A AULA – samarbejdsplatformen
(KOMBIT)
Netcompany won Lost/not pre-qualified Netcompany win rate as % of est. total1 By project
Note 1: Total value of contracts won as a percentage of tendered value for each year
Page 35Public market provides high degree of transparency
.
Tender visibility
Total value of known public tenders (typically multi-year contract value) Market (avg. tender contract)
Renewal of
more than +200 core • Most large public tender contracts have an average
systems at the Danish duration of ~7 years
Danish tax
tax authorities
authorities
+10 DKKbn1 • Development phase typically first 12-18 months followed
by 48-72 months of maintenance & operations
• Re-tenders of maintenance & operations contracts will
Customs
authorities ~2 DKKbn 2 typically have higher win rates to original contract holder
due to existing knowledge, unless customer satisfaction is
low which is often the case with incumbents
From already
known new and
re-tenders 10 DKKbn 2
+10-15 years
‘19-’22
Note 1: Source; Danish tax authorities
Note 2: Source; Netcompany
Page 36Incumbents being challenged by agile players in public sector
.
Adapting incumbents and
Incumbents Pure play next-gen IT disruptor
agile at-scale players
Example
companies
• International players with • Regional, agile players with • Citizen focused complex projects,
established relationship through scale/scope that drive modernisation of and
Description
legacy systems to compete with incumbents on increased efficiency in the public
and scale large-scale projects sector
Avg. market
share per
player ~15 – 40% ~3 – 10% ~10%
Source: Company market analysis, market analysis made by leading consulting firm in 2016
Page 37Public market focus
.
Continue focus on core customers and agencies
• Continue to disrupt the public IT market
• Go for the largest complex projects (Central Government, largest municipalities, KOMBIT, ATP )
Serve already won tenders
• Execute on tenders won over the last years
• Positioning for winning of future re-tenders
Acquire new tender contracts
• Target the carefully selected “right” tenders
• Leverage track record and positive customer momentum
Page 38Private core market size and outlook
.
Netcompany private core market Growth drivers
Differentiation and innovation categories driven
by customer innovation and competitive pressure
Private IT service
market 2016
Robust agile delivery is vital to customers as time-
DKK ~ 27bn
to-market is crucial
✓ IT service market where Netcompany
offers solutions IT private core market spend (DKKbn)
Addressable × Excludes IT hardware and support
market 2016 functions CAGR 16-22
DKK ~ 16bn ~13
16-22%
✓ Medium and large companies with
Core significant annual IT budget ~7
CAGR market ✓ Strategic focus on differentiation
‘16-’22 2016 ✓ “Non-vanilla” projects
10-12% DKK
~7bn × Excludes 70% of “records” segment
× ExcludesThe competitive landscape in the Danish private market
is highly fragmented
.
Incumbents Adapting incumbents Pure play next-gen IT disruptor
Example
players
• Typically been in the market 20+ • Legacy from incumbents but focused • Driving change in the IT industry by
years on closing gap between ‘running’ delivering strategic IT solutions that
Description • Focus on large, more simple projects and ‘growing’ make customers future digital
• High share of revenue from • Mostly active in more simple winners
maintenance and operations solutions given legacy
Avg. market
share per
player
~5-10% ~2-5% ~10%
Source: Company market analysis, market analysis made by leading consulting firm in 2016
Page 40Private market focus
.
Develop core customers and capture market growth
• Grow large customers with ambitious digital budget
• Benefit from tailwind following increased private spend on innovation/differentiation
Win large accounts and increase scope of work
• Gain foothold and build scale with few large customer accounts per year
• Increase scope of work with current accounts
Take end-to-end ownership with large cap companies
• Win “full scope” contracts with large cap companies (full ownership of digital journey)
Page 41Delivery model inherently support synergies and cross-selling
.
Netcompany’s Delivery model provides maximum flexibility and synergies independent of segment and sector
PUBLIC PRIVATE
• Tenders for new projects is strictly regulated by EU • Demonstration of knowledge and insight
• Every aspect of tender has to be formally documented • Long-term dialogue
Sales
• Dedicated team of 30 employees assigned to studying the dynamics of • Most sales activities are initiated in close cooperation with existing
Process
the segment and the requirements of tender responses customers through referrals
• Significant scope for selling/cross-selling
• Development of typically 12 to 18 months followed by 48 to 72 months • On average, large private sector engagements have a duration of
Services
of maintenance and operations approximately 12 – 18 months, and are of high strategic value to customers
Project • Multi-year contracts of 6 – 7 years • Shorter contracts of 12 – 18 months
Length • Increasingly multi-year contracts
• High degree of visibility on upcoming tenders • Continued focus on complex projects with customers having ambitious
Outlook • Converge to more maintenance contracts digital budgets
• Focus on larger projects that tend to have a higher strategic value
• Proven ability to deliver large, complex and transformational projects
• Private segment increasingly looking towards Public segment for references of transformations at scale
Why We • Platform agnostic approach with long track record of delivery and ability to envision innovative solutions that creates
Win trustworthiness
• Integrated Sales and Delivery organisation provides required technical knowledge and insight in sales and marketing efforts
• Strong public profile and ownership structure provides credibility
Page 42
Source: NetcompanyCASE: Trade unions (1/3)
.
Ingeniørernes a-
Netcompany trade unions projects BUPL
kasse
August 2018 10. nov 2009
Common core with streamlined processes for payments FTF/A Lærernes a-kasse
and case handling Januar 2018 2. feb 2010
Serviceforbundet
Agile front-end systems with the customer in center – del af Min a-kasse
El fagets a-kasse
1. januar 2017 11. maj 2010
based on a standard CRM platform
1.4+ million Byggefagenes a-
HK/Danmark
Innovative solutions e.g. utilising AI to customize offers members are kasse
15. februar 2016 8. juni 2010
to customers, giving significant business benefits administrated by
Business Danmark
del af Min a-kasse
Modulus handling Magistrenes a-
kasse
Effective handling of compliance and legislative changes 1. januar 2015 pay-out of more than 1. feb. 2011
Dansk Metal
DKK 22bn. Min a-kasse
1. Nov 2014 5. april 2011
Parallel roll-out to several trade unions
Krifa CA a-kasse
10. juni 2014 31. maj 2011
Replaces stiff legacy systems with focus on keeping
Akademikernes a-
records, not differentiation and innovation kasse
AJKS
30. sept. 2013 6. sept 2011
Development organisation of approximately 90 Lederne Det Faglige Hus
6. nov. 2012 29. maj 2012
employees
Page 43CASE: Trade unions (2/3)
.
The new IT The experiences from
infrastructure for the the trade unions
Danish trade unions customers have also
has subsequently been been used for similar Finance
used as an entrance to solutions in e.g. banks,
large payment systems where a customer-
for the large municipal focused differentiating
service systems and and innovative
thereby creates a solution is built as a
bridge between layer around the
Private and Public product’s centric old
projects banking systems
Page 44CASE: Trade unions (3/3)
.
Examples of recent new projects
Payments User recommendations through AI Apps
GDPR safe communications
Booking
Page 45Agenda
.
Time Page
1 Status on strategy 10:30 – 11:00 5
2 Netcompany´s business model 11:00 – 11:30 15
3 Update on the Danish market 12:30 – 13:15 32
4 Update on the UK market 13:15 – 13:45 47
5 Behind the quarterly numbers 15:00 – 15:30 58
Page 46UK at a glance
.
Overview of key people and organisation Key financials 2018
Mark Ward Country Managing Partner
Age: 45 Founder: (Hunter Macdonald)
Revenue (DKK) Adj. EBITA (DKK)2
338m 29m
7
partners
363 Leeds
FTEs¹
Derby
London London Leeds Derby
Note 1: Average number of employees including independent contractors in Q1 2019
Note 2: EBITA adjusted for special items (non-IFRS) and Group HQ costs
Page 47UK – a huge market with significant potential
.
Market characteristics Huge core market with expected CAGR ‘16-22 ‘of ~10%
Largest market in EU – lower digital maturity than Nordics
but steps taken to increase rate of digitalisation
Total IT Services
Market
DKK 330bn per annum ✓ Central government, large
municipalities,
large/medium sized
Large Government Departments with significant IT Budgets,
companies
completing transformation activities similar to those in the
Addressable
Nordics
market
✓ Large, complex projects,
DKK 171bn per
annum requiring dedicated teams
over longer time period
Core
Services, finance, production, technology, media and Market
telecoms companies with major budgets are the largest DKK
segments within fragmented private market 77bn per
annum
Source: Market analysis made by leading consulting firm in 2016
Page 48Despite small size, Netcompany UK has a strong
customer portfolio
.
10 private customers Public
Services/
Telecoms/
Retail
Energy
4 private customers
Production
Technology/
Media
2 private customers
Logistics
5 private customers
3 private customers
Netcompany UK has a prestigious list of customers and in May 2019 invoiced 36 companies or Government departments, 19
of which have greater than DKK +8 billion revenue or yearly Government funding
Page 49Supporting the citizens of the UK
.
Netcompany UK is starting to influence IT delivery and UK citizens across the UK both the public and private sector
Public Private
We are working with We are working with We are assisting We are working with We are working as We are supporting
Home Office to Highways England to Government major organisations part of a programme many major
protect the UK keep the UK departments with to support UK to install smart organisations to
borders roadways safe Brexit preparation manufacturing meters into every embrace new
UK home technology and to
innovate
Page 50UK public market trends fit perfectly to Netcompany focus
.
Government Transformation Strategy
UK is not yet as advanced in digitalisation as some other countries, including Denmark. UK Government strategy has ambitious
plans and has earmarked significant funds to digitalise and optimise the relationship between citizens and the state
Increasing focus on differentiation and innovation
UK Government is increasingly buying in layers and expanding their focus on procuring more differentiation and innovation based
services
Brexit will create opportunities
It is expected, that a significant number of UK IT systems will need to be implemented and updated to support Brexit
Challenges to deliver public projects
Some of UK government’s major projects have challenges, which makes an ability to consistently deliver a key differentiator
Page 51Public market spend entails huge untapped opportunities
.
Estimated annual DKK 150bn total ICT spend in Government sectors
- If only 20% of total spend is Netcompany core market, it still amounts to DKK 30bn
DKK billion
Kr 50.0
Kr 40.0
Kr 30.0
Kr 20.0
Kr 10.0
0.3% 0% 0% 0% 0.1% 0.2% 0.3%
Kr 0
Central Local Education Health National Security Criminal Justice Transport
(DKK) Total ICT annual spend Netcompany’s share of annual spend
• Netcompany is less than 0.5% of spend in the government sector with our largest involvements
• Public market penetration in initial phase, penetrating multiple sectors
Page 52Private market opportunities
.
Global organisations
Many major UK private sector companies are global organisations with major budgets with decision makers based in the UK
Legacy systems
Many UK private sector organisations are long established and have major legacy systems that need modernisation
Resistance to traditional players
There is a resistance to traditional players based on previous delivery issues, buyers want viable alternatives who can deliver
Integration
There is strong demand for integrators who can control an organisations vendors and secure delivery
Agility
The need is for organisations that can be agile in ethos and delivery approach, which promotes a move away from the large
traditional player
Page 53Private market – ample room to grow
.
Estimated annual, global ICT spend for 7 key customers totaling DKK ~35bn, shows significant potential
DKK billion
Kr 10.0
Kr 7.5
Kr 5.0
Kr 2.5
0.6% 1.7% 0.8% 0.2% 1.9% 0.1% 0.6%
Kr 0.0
Production #1 Services #1 Production #2 Production #3 Services #2 Retail #1 Logistics #1
Total ICT annual spend by customer, anonymized Netcompany share of annual spend
Page 54Integration of Netcompany business model on track
.
Sales & delivery
✓ Integrated sales and delivery model implemented
✓ Bidding and winning of large tenders
People
✓ Recruitment, onboarding and feedback processes in place for permanent work force
✓ Reduction of use of contractors ongoing
✓ Office setup optimised
Execution
✓ Netcompany finance and staffing tools fully implemented
✓ Netcompany Academy operating for the UK to create consistent delivery performance
The integration of Netcompany UK is progressing as planned - still 3 ½ years to go in the integration plan
Page 55Key steps to full integration and financial performance on
par with group level
20-25% organic
revenue
.
growth and 20-
25% adjusted
EBITA-margin
Revenue
growth of 15-
20% and
8-10% Strategic switch to Strengthen Principal Sell the correct Closer working across Strengthen
Exploit sector specific
adjusted permanent work force and Manager level outcome-based countries between relationships in
knowledge across
EBITA-margin aligned to to support the contracts that drive management, team existing customers to
borders to share
Netcompany ethos pyramid structure experience, long term transfers to optimise grow existing
and further strengthen and support strengthen bids and profitability and staffing model, shared accounts, ample room
the career model incoming talents customer growth commercial support to grow
propositions
Acquisition, 25 October 2017 December 2022
Page 56Agenda
.
Time Page
1 Status on strategy 10:30 – 11:00 5
2 Netcompany´s business model 11:00 – 11:30 15
3 Update on the Danish market 12:30 – 13:15 32
4 Update on the UK market 13:15 – 13:45 47
5 Behind the quarterly numbers 15:00 – 15:30 58
Page 57Financial highlights
.
Revenue growth
Reported financials (DKKm) Revenue (DK) Revenue (NO) Revenue (UK)
1 1 1
Adj. EBITA-margin (DK) Adj. EBITA-margin (NO) Adj. EBITA-margin (UK)
500 45%
37% 36%
400 30% 29% 29% 31% 35%
27% 29% 29%
300 26% 25%
26% 26% 19%
22% 17% 14%
22% 20%
200 17% 9% 15%
10% 5%
100 9% 3% 5%
0 -5%
0%
Q1 2017 Q2 2017 Q3 2017 Q4 2017 Q1 2018 Q2 2018 Q3 2018 Q4 2018 Q1 2019
Acquisition
25 October 2017
Note 1: Adjusted EBITA-margin before special items (non-IFRS)
Page 58Financial highlights
.
Quarterly trends DK
Q1 Q2 Q3 Q4
• Adjustment of • Largest intake of • Full effect of new
seniority level new employees recruits from Q3
→ higher rates • Quarter with most
working days
• Salary increase • Public holidays • Danish summer • ’17: High level of
• Easter ‘18 • Easter ‘ 17- ‘ 19 vacation (typically costs to new ERP
July) and additional
FTE´s (CFO, legal
and finance)
Page 59Financial highlights
.
Quarterly trends NO & UK
Both entities new to Netcompany, so difficult to see solid trendlines for now
Margin will typically decrease in Q3 in NO due to new recruits – impact will be reduced as
entity grows
In the UK we will be seeing gradually increasing margins through the year
Page 60Working capital development
.
Revenue growth
Reported financials (DKKm) Revenue Total Change in working capital
700
500
300
100
-100
Q1 2017 Q2 2017 Q3 2017 Q4 2017 Q1 2018 Q2 2018 Q3 2018 Q4 2018 Q1 2019
Page 61Working capital
.
Quarterly trends - Working capital Group
Generally negative working capital in Q1, Q2 and Q3
On account taxes paid in Q1 and Q4 – normally
Q2 and Q3 have had the highest negative impact on working capital
Driven by a large proportion sales in public, which have more back-end loaded payment plans
for fixed fee projects
Page 62Revenue criteria – “POC” accounting for fixed fee projects
.
Business
Netcompany project Netcompany meets milestone Netcompany invoice
activity
WIP &
WIP TR
revenue
Accounting
implications Resources (people and hours) Trade receivables increased An invoice is created and sent to
allocated to project reflecting the milestone the customer
Revenue and balance sheet
Balance sheet “WIP” reduced Trade receivables reflect
“WIP” increased reflecting the
reflecting the milestone remaining unpaid invoices
allocated hours
Page 63Work in progress and revenue – NET reduction in WIP in 2019
.
WIP DKKm Revenue DKKm
255.1 Reduced ~2,5002
145% 22.5%
5-10% NET1
2,053.2
45%
1,416.1
102.9
2017 2018 2019 2017 2018 2019
Note 1: Based on payment plans for current fixed fee projects
Note 2: Assuming ~22.5% revenue growth
Page 64Work in progress and revenue
.
Build up of WIP-balance as Netcompany has more large public fixed fee projects
Reported financials (DKKm) Revenue WIP Percentage of revenue
3000
~2,500 1
2500
2,053.2
2000
1,416.1
1500
1000 899.6
758.1
500 255.1 ~235
53.7 83 102.9
7% 9% 7% 12% ~9%
0
2015 2016 2017 2018 2019
Note 1: Assuming ~22.5% revenue growth
Page 65Provision
.
Provision development DKKm
Provision Percentage of revenue As we continue to deliver large complex projects
the need for general provision decline
36.1
30.3
26.41 Provision relative to revenue declines, as risk
profile decreases
Covers general uncertainty in the portfolio
2.1% 1.8% 1.1%
All projects are individually addressed for “POC”
2017 2018 2019 performance on a quarterly basis
Note 1: As per Q1 2019 – annualised
Page 66You can also read