Quarterly Property Market & Economic Update - New Zealand Quarter 3, 2020 - New Zealand ...
←
→
Page content transcription
If your browser does not render page correctly, please read the page content below

Quarterly Property Market
& Economic Update
New Zealand
Quarter 3, 2020

Table of Contents
    About CoreLogic.  .  .  .  .  .  .  .  .  .  .  .  .  .  .  .  .  .  .  .  .  .  .  .  .  .  .  .  .  .  .  .  .  .  .  .  .  .  .  .  .  .  .  .  .  .  .  .  .  .  .  .  .  .  .  .  .  .  .  .  .  .  .  .  .  .  .  .  .  . 3
    Executive Summary.  .  .  .  .  .  .  .  .  .  .  .  .  .  .  .  .  .  .  .  .  .  .  .  .  .  .  .  .  .  .  .  .  .  .  .  .  .  .  .  .  .  .  .  .  .  .  .  .  .  .  .  .  .  .  .  .  .  .  .  .  .  .  .  .  .  . 4
    Macro Economic and Demographic Indicators.  .  .  .  .  .  .  .  .  .  .  .  .  .  .  .  .  .  .  .  .  .  .  .  .  .  .  .  .  .  .  .  .  .  .  .  .  .  .  .  .  .  .  . 5
             New Zealand Asset Classes .  .  .  .  .  .  .  .  .  .  .  .  .  .  .  .  .  .  .  .  .  .  .  .  .  .  .  .  .  .  .  .  .  .  .  .  .  .  .  .  .  .  .  .  .  .  .  .  .  .  .  .  .  .  .  .  .  .  .  .  . 6
             New Zealand and Australia GDP Growth. .  .  .  .  .  .  .  .  .  .  .  .  .  .  .  .  .  .  .  .  .  .  .  .  .  .  .  .  .  .  .  .  .  .  .  .  .  .  .  .  .  .  .  .  .  .  .  .  . 7
             New Zealand Population.  .  .  .  .  .  .  .  .  .  .  .  .  .  .  .  .  .  .  .  .  .  .  .  .  .  .  .  .  .  .  .  .  .  .  .  .  .  .  .  .  .  .  .  .  .  .  .  .  .  .  .  .  .  .  .  .  .  .  .  .  .  .  . 8
             Migration .  .  .  .  .  .  .  .  .  .  .  .  .  .  .  .  .  .  .  .  .  .  .  .  .  .  .  .  .  .  .  .  .  .  .  .  .  .  .  .  .  .  .  .  .  .  .  .  .  .  .  .  .  .  .  .  .  .  .  .  .  .  .  .  .  .  .  .  .  .  .  .  .  .  .  .  . 9
             Regional Building Consents .  .  .  .  .  .  .  .  .  .  .  .  .  .  .  .  .  .  .  .  .  .  .  .  .  .  .  .  .  .  .  .  .  .  .  .  .  .  .  .  .  .  .  .  .  .  .  .  .  .  .  .  .  .  .  .  .  .  .  . 10
             Consumer Confidence.  .  .  .  .  .  .  .  .  .  .  .  .  .  .  .  .  .  .  .  .  .  .  .  .  .  .  .  .  .  .  .  .  .  .  .  .  .  .  .  .  .  .  .  .  .  .  .  .  .  .  .  .  .  .  .  .  .  .  .  .  .  .  .  . 10
             Employment .  .  .  .  .  .  .  .  .  .  .  .  .  .  .  .  .  .  .  .  .  .  .  .  .  .  .  .  .  .  .  .  .  .  .  .  .  .  .  .  .  .  .  .  .  .  .  .  .  .  .  .  .  .  .  .  .  .  .  .  .  .  .  .  .  .  .  .  .  .  .  .  . 11
            Interest Rates .  .  .  .  .  .  .  .  .  .  .  .  .  .  .  .  .  .  .  .  .  .  .  .  .  .  .  .  .  .  .  .  .  .  .  .  .  .  .  .  .  .  .  .  .  .  .  .  .  .  .  .  .  .  .  .  .  .  .  .  .  .  .  .  .  .  .  .  .  .  .  . 12
    Housing Overview .  .  .  .  .  .  .  .  .  .  .  .  .  .  .  .  .  .  .  .  .  .  .  .  .  .  .  .  .  .  .  .  .  .  .  .  .  .  .  .  .  .  .  .  .  .  .  .  .  .  .  .  .  .  .  .  .  .  .  .  .  .  .  .  .  .  . 13
            Lending Conditions .  .  .  .  .  .  .  .  .  .  .  .  .  .  .  .  .  .  .  .  .  .  .  .  .  .  .  .  .  .  .  .  .  .  .  .  .  .  .  .  .  .  .  .  .  .  .  .  .  .  .  .  .  .  .  .  .  .  .  .  .  .  .  .  .  .  . 14
            Sales Volumes.  .  .  .  .  .  .  .  .  .  .  .  .  .  .  .  .  .  .  .  .  .  .  .  .  .  .  .  .  .  .  .  .  .  .  .  .  .  .  .  .  .  .  .  .  .  .  .  .  .  .  .  .  .  .  .  .  .  .  .  .  .  .  .  .  .  .  .  .  .  .  . 15
            Listings.  .  .  .  .  .  .  .  .  .  .  .  .  .  .  .  .  .  .  .  .  .  .  .  .  .  .  .  .  .  .  .  .  .  .  .  .  .  .  .  .  .  .  .  .  .  .  .  .  .  .  .  .  .  .  .  .  .  .  .  .  .  .  .  .  .  .  .  .  .  .  .  .  .  .  .  .  . 16
            Nationwide Values .  .  .  .  .  .  .  .  .  .  .  .  .  .  .  .  .  .  .  .  .  .  .  .  .  .  .  .  .  .  .  .  .  .  .  .  .  .  .  .  .  .  .  .  .  .  .  .  .  .  .  .  .  .  .  .  .  .  .  .  .  .  .  .  .  .  .  . 18
             House Price Index .  .  .  .  .  .  .  .  .  .  .  .  .  .  .  .  .  .  .  .  .  .  .  .  .  .  .  .  .  .  .  .  .  .  .  .  .  .  .  .  .  .  .  .  .  .  .  .  .  .  .  .  .  .  .  .  .  .  .  .  .  .  .  .  .  .  .  . 19
             Rent.  .  .  .  .  .  .  .  .  .  .  .  .  .  .  .  .  .  .  .  .  .  .  .  .  .  .  .  .  .  .  .  .  .  .  .  .  .  .  .  .  .  .  .  .  .  .  .  .  .  .  .  .  .  .  .  .  .  .  .  .  .  .  .  .  .  .  .  .  .  .  .  .  .  .  .  .  .  .  .  . 22
             Buyer Classification .  .  .  .  .  .  .  .  .  .  .  .  .  .  .  .  .  .  .  .  .  .  .  .  .  .  .  .  .  .  .  .  .  .  .  .  .  .  .  .  .  .  .  .  .  .  .  .  .  .  .  .  .  .  .  .  .  .  .  .  .  .  .  .  .  .  . 23
    Main Cities Housing Market Indicators. .  .  .  .  .  .  .  .  .  .  .  .  .  .  .  .  .  .  .  .  .  .  .  .  .  .  .  .  .  .  .  .  .  .  .  .  .  .  .  .  .  .  .  .  .  .  .  .  . 24
            Auckland Market Activity. .  .  .  .  .  .  .  .  .  .  .  .  .  .  .  .  .  .  .  .  .  .  .  .  .  .  .  .  .  .  .  .  .  .  .  .  .  .  .  .  .  .  .  .  .  .  .  .  .  .  .  .  .  .  .  .  .  .  .  .  .  . 26
             Auckland Values .  .  .  .  .  .  .  .  .  .  .  .  .  .  .  .  .  .  .  .  .  .  .  .  .  .  .  .  .  .  .  .  .  .  .  .  .  .  .  .  .  .  .  .  .  .  .  .  .  .  .  .  .  .  .  .  .  .  .  .  .  .  .  .  .  .  .  .  .  . 27
            Auckland Suburb Value Change .  .  .  .  .  .  .  .  .  .  .  .  .  .  .  .  .  .  .  .  .  .  .  .  .  .  .  .  .  .  .  .  .  .  .  .  .  .  .  .  .  .  .  .  .  .  .  .  .  .  .  .  .  .  .  . 28
             Current Auckland Suburb Values .  .  .  .  .  .  .  .  .  .  .  .  .  .  .  .  .  .  .  .  .  .  .  .  .  .  .  .  .  .  .  .  .  .  .  .  .  .  .  .  .  .  .  .  .  .  .  .  .  .  .  .  .  .  . 30
             Hamilton Market Activity. .  .  .  .  .  .  .  .  .  .  .  .  .  .  .  .  .  .  .  .  .  .  .  .  .  .  .  .  .  .  .  .  .  .  .  .  .  .  .  .  .  .  .  .  .  .  .  .  .  .  .  .  .  .  .  .  .  .  .  .  .  . 32
            Hamilton Values .  .  .  .  .  .  .  .  .  .  .  .  .  .  .  .  .  .  .  .  .  .  .  .  .  .  .  .  .  .  .  .  .  .  .  .  .  .  .  .  .  .  .  .  .  .  .  .  .  .  .  .  .  .  .  .  .  .  .  .  .  .  .  .  .  .  .  .  .  . 33
            Tauranga Market Activity. . . . . . . . . . . . . . . . . . . . . . . . . . . . . . . . . . . . . . . . . . . . . . . . . . . . . . . . . . . . . . 34
             Tauranga Values.  .  .  .  .  .  .  .  .  .  .  .  .  .  .  .  .  .  .  .  .  .  .  .  .  .  .  .  .  .  .  .  .  .  .  .  .  .  .  .  .  .  .  .  .  .  .  .  .  .  .  .  .  .  .  .  .  .  .  .  .  .  .  .  .  .  .  .  .  . 35
            Wellington Market Activity .  .  .  .  .  .  .  .  .  .  .  .  .  .  .  .  .  .  .  .  .  .  .  .  .  .  .  .  .  .  .  .  .  .  .  .  .  .  .  .  .  .  .  .  .  .  .  .  .  .  .  .  .  .  .  .  .  .  .  .  . 36
             Wellington Values.  .  .  .  .  .  .  .  .  .  .  .  .  .  .  .  .  .  .  .  .  .  .  .  .  .  .  .  .  .  .  .  .  .  .  .  .  .  .  .  .  .  .  .  .  .  .  .  .  .  .  .  .  .  .  .  .  .  .  .  .  .  .  .  .  .  .  .  . 37
            Christchurch Market Activity.  .  .  .  .  .  .  .  .  .  .  .  .  .  .  .  .  .  .  .  .  .  .  .  .  .  .  .  .  .  .  .  .  .  .  .  .  .  .  .  .  .  .  .  .  .  .  .  .  .  .  .  .  .  .  .  .  .  . 38
             Christchurch Values.  .  .  .  .  .  .  .  .  .  .  .  .  .  .  .  .  .  .  .  .  .  .  .  .  .  .  .  .  .  .  .  .  .  .  .  .  .  .  .  .  .  .  .  .  .  .  .  .  .  .  .  .  .  .  .  .  .  .  .  .  .  .  .  .  .  . 39
            Dunedin Market Activity.  .  .  .  .  .  .  .  .  .  .  .  .  .  .  .  .  .  .  .  .  .  .  .  .  .  .  .  .  .  .  .  .  .  .  .  .  .  .  .  .  .  .  .  .  .  .  .  .  .  .  .  .  .  .  .  .  .  .  .  .  .  . 40
             Dunedin Values. .  .  .  .  .  .  .  .  .  .  .  .  .  .  .  .  .  .  .  .  .  .  .  .  .  .  .  .  .  .  .  .  .  .  .  .  .  .  .  .  .  .  .  .  .  .  .  .  .  .  .  .  .  .  .  .  .  .  .  .  .  .  .  .  .  .  .  .  .  . 41
    CoreLogic Data and Analytics .  .  .  .  .  .  .  .  .  .  .  .  .  .  .  .  .  .  .  .  .  .  .  .  .  .  .  .  .  .  .  .  .  .  .  .  .  .  .  .  .  .  .  .  .  .  .  .  .  .  .  .  .  .  .  .  . 42
2            Legal Disclaimer .  .  .  .  .  .  .  .  .  .  .  .  .  .  .  .  .  .  .  .  .  .  .  .  .  .  .  .  .  .  .  .  .  .  .  .  .  .  .  .  .  .  .  .  .  .  .  .  .  .  .  .  .  .  .  .  .  .  .  .  .  .  .  .  .  .  .  .  .  . 43
About CoreLogic

CoreLogic is a leading property information, analytics and               Contact
services provider in the United States, Australia and New Zealand.
                                                                         Call us 0800 355 355
CoreLogic helps clients identify and manage growth opportunities,
improve performance and mitigate risk, by providing clients with         Wellington office
innovative, technology-based services and access to rich data            Level 2, 275 Cuba Street
and analytics.                                                           PO Box 4072
                                                                         Wellington 6140
Whilst all reasonable effort is made to ensure the information in this
publication is current, CoreLogic does not warrant the accuracy,         Auckland office
currency or completeness of the data and commentary contained in         Level 5
this publication and to the full extent not prohibited by law excludes   41 Shortland Street
all loss or damage arising in connection with the data and               Auckland 1010
commentary contained in this publication.                                Email: reports@corelogic.co.nz

                                                                         corelogic.co.nz                  3
Executive Summary
    The last time we produced this report three months          cases, existing owner-occupiers are choosing to stay
    ago, uncertainty about how the property market              where they are due to already high debt levels and
    would emerge from lockdown was still high. Indeed,          the extra costs of moving house (such as legal,
    sales volumes were looking a little fragile, and values     estate agent etc). But in other cases, people aren’t
    themselves had also dropped slightly in certain             moving because they simply can’t find the ideal next
    areas. However, roll forward three months, and it’s         property, given the tight supply of available listings.
    been striking how quickly the situation has turned          In turn, that is feeding back into an even tighter
    more positive.                                              listings picture.

    In fact, sales volumes in September were nothing            In terms of property values, most of the country has
    but exceptional. The estimated total for both agent         seen resilience in the past few months, and in many
    and private sales of 9,666 was the single strongest         cases further increases (even the previous falls in
    month for more than four years, and it ranks sixth in       Queenstown seem to be abating). The national
    the list of most active months dating back to May           average property value rose by 0.8% in September
    2007. To be fair, given that year to date volumes are       (to $743,678) and is 2.1% higher than six months ago.
    essentially at parity with the same stage in 2019,          The main centres are broadly following that pattern,
    there is probably still some ‘catch up’ growth taking       albeit there are hints that Dunedin’s previously very
    place after the lull of April/May. Even so, considering     strong momentum may have slowed a little in the
    the current economic environment, they’re still             past few months.
    some impressive sales figures.
                                                                In the coming months, there are clearly some risks
    Moreover, sales volumes may have been higher still,         to be aware of for the property market. Most
    if not for the shortage of listings actually available on   importantly, the wage subsidy is now wearing off and
    the market. With mortgage credit still accessible,          unemployment could start to rise more significantly.
    and interest rates low, the strength of buyer               This may affect younger and lower-paid people the
    demand is not giving that listings situation any time       most, so could flow through more significantly to the
    to resolve itself, and this is feeding through into         rental side of the property market rather than
    higher prices. The General Election has also                owner-occupied.
    obviously been and gone, with no material effect on
    the market.                                                 Even so, that risk doesn’t seem enough to knock the
                                                                property market off course in the short term. After
    The third quarter of the year saw a continued strong        all, the Reserve Bank is doing everything it can to
    presence for first home buyers (FHBs) and                   help protect jobs now, and is willing to accept rising
    mortgaged multiple property owners (MPOs, or                asset prices (e.g. houses) as a result of their
    investors) in the market, but existing owner-               continued support measures, such as a Funding for
    occupiers (movers) continued to sit on the sidelines        Lending Programme and further drops in interest
    in many cases. For investors, the ability to enter with     rates.
    a 20% deposit now, rather than the previous 30%,
    has been a factor – alongside the low returns               Earlier in the year, property sales volumes looked
    available on other assets, such as bank deposits.           like they might be as low as 65,000 for 2020 as a
    Their share of purchases in Q3 was 26%, the highest         whole, but now they look on track to be about
    since 28% in Q3 2016.                                       85,000 – a similar figure to last year. Meanwhile,
                                                                property values also seem set to continue to rise
    Meanwhile, FHBs are making use of KiwiSaver for             into 2021. Overall, it’s been a remarkable turnaround
    their deposits (or at least part of it), while would-be     in the past three months.
    OE’ers who are now instead purchasing a property
    are also helping to boost overall FHB demand. In            As always, we keep a running monitor on the
    fact, the share of property purchases in Q3 made by         property market every week via our NZ Property
    FHBs was 25%, up from 23% in Q2, and the highest            Market Pulse articles, so be sure to check these out
    figure in the history of our Buyer Classification series    on our website http://www.corelogic.co.nz/
    (topping the previous peak of 24% in 2006-07).              news-research/all-news/. Our podcast is also a
                                                                great source of data and commentary: https://
    Looking at movers, their share of purchases dipped          corelogicnzpropertymarket.buzzsprout.com/.
4   to just 25% in Q3, an historically low level. In some                                                           4
Macro Economic and
Demographic Indicators

                         5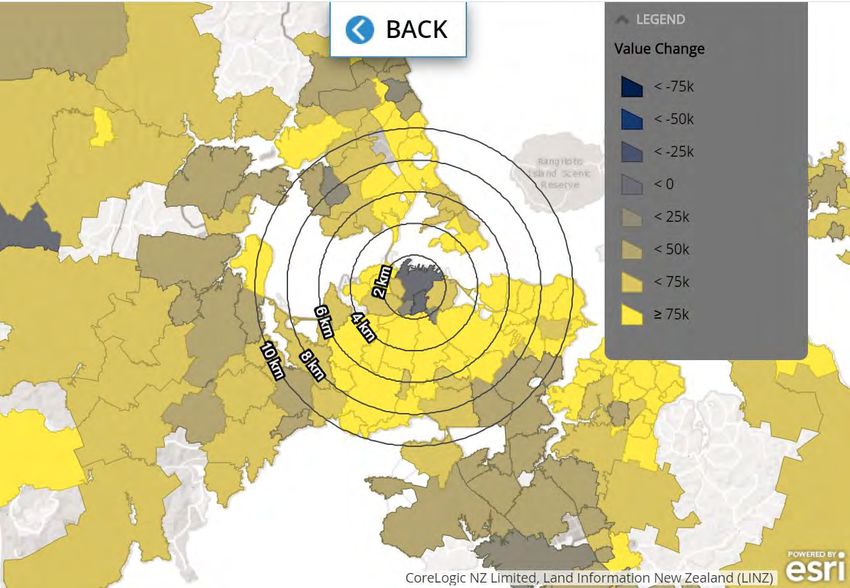
New Zealand Asset Classes

                          RESIDENTIAL REAL ESTATE

                          $1.25 trillion
                          $289 billion in home loans

                          COMMERCIAL/INDUSTRIAL REAL ESTATE

                          $227 billion
                          NZ LISTED STOCKS

                          $180 billion
                          NZ SUPER & KIWISAVER

                          $118 billion

    The value of residential property across the country has rebounded from a slight dip in Q2, and sat at $1.25
    trillion in Q3. Mortgages are secured against 23% of this value, or in other words, 77% of the value of the
    property market is household equity. However, it’s also important to note that household debt is high relative
    to income, and to some extent the debt has only been sustainable in recent years because of low mortgage
    rates.

    After a volatile period during March and April, a steady upwards trend has re-emerged for the value of shares
    and pooled investment funds. The NZX50 has recently gone back above the 12,000 mark (surpassing pre-
    COVID peaks), while the values of KiwiSaver pots and the NZ Super Fund have also rebounded strongly.

6   Sources: CoreLogic NZ, Reserve Bank of NZ, NZX, NZ Super Fund                                              6
New Zealand and Australia GDP growth
New Zealand’s GDP dropped                   Annual Average GDP Growth (%)
by a record 12% from Q1 to
Q2, but of course this was                  8
pretty much expected, given
                                            7
the alert level four lockdown
and severe restrictions on                  6
economic activity in April.
That followed a drop in GDP                 5

in Q1 as well, so it meant that
                                            4
NZ was in technical recession
in the first half of the year.              3
Sectors such as transport,
                                            2
construction, and hospitality
were the hardest hit by the                 1
lockdown.
                                            0
However, most economic
activity indicators have                   -1
bounced back strongly since
                                           -2
Q2 (albeit some of the
momentum was stifled by the                -3
move back up the alert levels                1990          1994     1998       2002     2006   2010          2014   2018
in August) and it’s inevitable
that the GDP figures for the                         Australia        NZ
third quarter will be much
improved. That said, it will be
a while yet until the size of               Annual Change in New Zealand Activity Index and GDP (%)
the economy returns to
where it was pre-COVID,                    10%
given that we’ve lost
international tourism for now.                  5%

Indeed, for the calendar year
2020, the economy may                           0%
shrink by 5-6% in total, only
rebounding by 2-3% in 2021
                                            -5%
– albeit that recovery would
be faster were the borders to
re-open sooner than                        -10%
expected.

                                           -15%

                                           -20%

                                           -25%
                                               2004                 2008              2012            2016             2020

                                                     GDP          NZ Activity Index

Source: Reserve Bank of New Zealand, Stats NZ                                                                                 7
New Zealand Population
    Quarterly Change in National                                                Population Change Composition
    Population (persons per quarter)                                            (persons per quarter)
                                                                                    40000
    45000
                                                                                    35000

    40000
                                                                                    30000

    35000
                                                                                    25000

    30000
                                                                                    20000

    25000
                                                                                    15000

    20000                                                                           10000

    15000                                                                            5000

    10000                                                                               0

     5000                                                                            -5000

       0                                                                            -10000
            1992    1996   2000      2004    2008   2012       2016   2020                   1996   2000         2004   2008           2012   2016        2020

              4 quarter moving average                                                         Natural increase
              Quarterly population change                                                      Net migration

     Annual Change in Population (persons)
               76000

                                  24400

                                                                             3900                                          5300
                                                     3600
                                                                                                      1400                                       1200

            New Zealand           Auckland          Hamilton             Tauranga                   Wellington          Christchurch            Dunedin

    National population growth slowed in Q2 2020, from an annual pace of 2.3% in Q1 to 2.1%. Our population
    passed the 5m mark in the third quarter last year, and is now approaching 5.1m. As ever, the natural rate of
    increase (births minus deaths) remains pretty steady, at 6,000-7,000 people per quarter, or 25,000-30,000
    per year. Not surprisingly, it was the net migration part of the question that slowed the overall population
    growth rate in Q2. Stats NZ estimates that overall net migration from April to June was just 800 people, the
    lowest quarterly figure since 300 in Q2 2013.

    With borders closed, the gross flows of migrants (i.e. non-citizens arriving, non-citizens departing, kiwis
    leaving, kiwis returning) have all tailed off since March, and as noted above the net balance of all of these
    combined has also dropped. However, although the ‘flood’ of returning kiwis post-COVID has probably been
    exaggerated a bit, it’s still true that the net balance for kiwi migration is much stronger than it was in the
    2000s and early 2010s, when the so-called brain drain was in full swing. Indeed, in 2011-12, we lost more than
    40,000 NZ citizens in net terms, whereas over the past 12 months we’ve gained about 20,000.

8   Source: Statistics New Zealand
Long term migration (12-month rolling totals)
200,000 Net
Arrivals
Departures
150,000
100,000
50,000
0
-50,000
2002 2006 2010 2014 2018
Comparison of old and new net migration series (12-month rolling totals)
100,000 Old method
New method
80,000
60,000
40,000
20,000
0
-20,000
-40,000
2002 2006 2010 2014 2018
Source: Statistics New Zealand 9Regional Building Consents
New dwelling consents trend (consents per month)
1,600 Auckland region
Waikato region
1,400 Wellington region
Canterbury region
1,200 Rest of NI
Rest of SI
1,000
800
600
400
200
0
1995 1999 2003 2007 2011 2015 2019
Despite being one of the hardest hit sectors of the economy during April’s lockdown and the immediate
aftermath, residential construction activity is another area that has held up better than many would have
expected in the past 2-3 months. Indeed, after an annual drop of 9% in new dwelling consents in the three
months to May, growth has returned and consents in the three months to August were 5% higher than a year
earlier. Over the past 12 months, there has been a total of almost 37,500 new residential dwelling consents
issued, not far off the recent peak of about 37,900 in February.
Much of the resilience of dwelling consents (and the previous strong growth) can be attributed to smaller
dwellings, such as townhouses and apartments – especially in Auckland. This trend seems logical, as we face
the need to accommodate an ever-growing population in a more intensified dwelling stock. Of course, at the
same time, consents issued for alterations to existing properties are also running at high levels, with more
people choosing to renovate rather than relocate. This is also a useful trend in terms of improving the quality
of housing.
Looking ahead, the previous peaks in dwelling consents mean that builders still have a solid pipeline of work
for a number of months yet, potentially carrying them through well into 2021. In addition, with the available
listings of existing houses running at multi-year lows, some households may continue to have little choice but
to consider building a house in order to get the property that want. Meanwhile, both the Labour and National
parties have indicated that they would continue with a strong state house construction programme,
supporting the industry.
That said, as banks continue to assess mortgages closely, it’s conceivable that construction finance will
become harder to obtain – and a reduction in general household confidence (as unemployment rises) would
also tend to dampen the demand for any finance, even if it’s available. These are headwinds for residential
construction.
10 Source: Statistics New ZealandConsumer Confidence
ANZ-Roy Morgan Consumer Confidence (index, monthly)
160
140
120
Average
100
80
60
40
20
0
2004 2006 2008 2010 2012 2014 2016 2018 2020
The latest ANZ Roy Morgan measure showed consumer confidence holding steady in August and September, at a
score of around 100. These levels are lower than pre-COVID (e.g. 2019’s average was 120), but still higher than the
outright weakness we saw in April (85). Consumer confidence is also higher than was typical for much of 2008-09 when
the GFC was biting hard.
In other words, confidence amongst households has rebounded from the worst point of alert level four lockdown, but
there’s still significant caution. It’ll be interesting to see how the end of the wage subsidy affects consumer confidence,
but at the same time, there’ll be support coming through from continued low mortgage rates. On the whole, relative
caution amongst households certainly isn’t holding back the housing market to any great degree at present, but we do
need to keep an eye on the risks ahead.
As an aside, a similar message applies for business confidence – it’s generally lower than it was pre-COVID, but has
recovered from April/May’s lows. Again, however, any flow-through effects from this to the housing market don’t seem
to be too major at present.
Sources: ANZ, Roy Morgan 11Employment
Annual change in employment, Labour force
full time and part time participation rate (%)
72
10%
8% 70
6%
68
4%
66
2%
0% 64
-2%
62
-4%
Full time 60
Part time
-6%
-8% 58
1987 1998 2009 2020 1987 1990 1993 1996 1999 2002 2005 2008 2011 2014 2017 2020
Number of Jobseeker
Unemployment rate (%) Support claimants
12
240,000
10
220,000
8 200,000
180,000
6
160,000
4
140,000
2
120,000
0 100,000
1986 1990 1994 1998 2002 2006 2010 2014 2018 Jan-20 Feb-20 Mar-20 Apr-20 May-20 Jun-20 Jul-20 Aug-20 Sep-20
In the second three months of the year, overall employment rose at a consistent pace of 1.6% from a year
earlier, the same figure as Q1. However, this is less encouraging than it might seem. For a start, COVID and
survey/sampling issues meant that the labour market data faced some distortions in the second quarter. But
more importantly, full-time employment (which is the best for the wider economy) growth slowed from 2.1%
in Q1 to just 1.4% in Q2, the lowest in almost eight years. Meanwhile, the data backed up other evidence
suggesting that one way firms were dealing with the recession was to cut back hours – indeed, part-time
employment (which had been falling for most of 2018 and 2019 as some people switched to full-time work)
grew by 2.5%.
The labour force participation rate (people employed or looking for work as a percentage of the working age
population) also dropped below 70% in Q2 – for the first time in four years – as some people left the
workforce altogether, in some cases because they simply couldn’t look for work during lockdown. This also
resulted in a ‘quirky’ unemployment rate result for Q2 of 4.0% (despite COVID it was lower than Q1’s 4.2%), as
those people who physically couldn’t look for work weren’t counted as unemployed.
Looking ahead, with the wage subsidy now winding down, the unemployment rate seems pretty likely to rise
from now on, and most forecasts are that it will peak at about 8% next year or even into 2022. Indeed, data
from the Ministry of Social Development on Jobseeker Support claimants suggests that the unemployment
rate may already have risen to about 6%. All else equal, higher unemployment will tend to be a restraint for
the housing market, although to the extent that it’s younger/lower-paid workers who feel more of the brunt, it
may be the tenant/rental sector that gets more affected than owner-occupation.
12 Source: Stats NZ, Ministry of Social DevelopmentInterest Rates
In the past few months, the Reserve Bank (RBNZ) has Mortgage Interest Rates (%)
reaffirmed its commitment to ensuring that the economic 25
recovery won’t be undermined by the general bank 2 year fixed rate
funding/lending or interest rate environment – their asset Floating mortgage interest rates
purchase programme now stands at $100bn out to June 20
2022, NZ could have a Funding for Lending Programme
(where the RBNZ lends directly to banks at the official cash 15
rate or close to it) before the end of 2020, and we might
also have a negative OCR early in 2021. The RBNZ has also
10
emphasised that it wants to prevent unnecessary job
losses now, and it is prepared to live with the
consequences for asset prices – i.e. that they’ll continue to 5
face upwards pressure from low interest rates. Also bear in
mind that the mortgage payment deferral scheme will still 0
run until March next year, the extra bank capital 1965 1971 1977 1983 1989 1995 2001 2007 2013 2019
requirements have also been delayed, and the loan to
value ratio speed limits are likely to be on hold until at least
May.
Official Cash Rate and Mortgage Rates (%)
12
OCR history
In this environment, it’s no surprise that mortgage rates OCR projection
continue to drift downwards, and most indications suggest 10 2-yr fixed mortgage
that a typical one or two year fixed rate might be below 2%
next year. It’s worth noting that higher debt levels do mean 8
that if/when mortgage rates eventually rise, households
will need to be careful. But for now, higher mortgage rates 6
are a long way away, and continued ultra-low rates point to
scope for further growth in property values in 2020 and 4
2021.
2
0
2000 2009 2018
Average Two Year Fixed Mortgage Rates (%)
5.2%
5.0%
4.8%
4.6%
4.4%
4.2%
4.0%
3.8%
3.6%
3.4%
2018 2019 2020
Source: Reserve Bank of NZ, interest.co.nz 13Housing Overview 14
Early Property Market Indicators
During alert level four lockdown, measures relating to the early stages of a sale process – i.e. pre-listing (such as appraisals
generated by real estate agents) and pre-mortgage (valuations ordered by banks) – fell away sharply, which was no surprise.
However, as our Early Market Indicators Report shows, they then bounced back steadily, and have recently been running at
around normal levels: https://www.corelogic.co.nz/early-market-indicators

In other words, the early stages of both the supply (appraisals, which lead to listings) and demand (borrowers requesting a
mortgage, hence the bank ordering a valuation) pipelines are holding up well, which points to further resilience for property
sales volumes in the coming months.

Listings
Weekly flow of new for-sale listings                                Weekly flow of new for-rent listings
                                                                    4,000
4,000                                                2020                                                                2020
                                                     2019           3,500                                                2019
3,500

                                                                    3,000
3,000

                                                                    2,500
2,500

                                                                    2,000
2,000

                                                                    1,500
1,500

                                                                    1,000
1,000

 500                                                                 500

   0                                                                   0

A key and ongoing feature of the NZ property market in recent times has been the low supply of listings available on the
market, which has been bolstering property values as buyers continue to face limited choice. There has been no material
change in the tight listings situation in the past three months either, with the total stock of existing properties available for
sale running at multi-year lows.

In turn, that has reflected both a continued stream of achieved sales (which removes listings at the end of pipeline) but also
only a ‘normal’ flow of new listings coming onto the market at the start of the pipeline. Indeed, after the listings lull of April/
May, it was possible that we’d subsequently see new listings running above previous levels – but this hasn’t happened.

In some ways, there is a vicious circle going on for listings, with some existing owner-occupiers not moving house because
they don’t have much choice about their next property. And of course, those owners are then not listing their own house,
which feeds back into even tighter supply conditions. Similarly, other active buyer groups at present – namely first home
buyers (FHBs) and mortgaged investors – aren’t generally selling any property before they purchase either (certainly FHBs
are not selling anything, by definition).

A similar message applies for new rental listings. In recent weeks, they’ve only been running at ‘normal’ levels, despite the
lack of activity in April/May.
Source: CoreLogic                                                                                                                15
Lending conditions
Annual Change in Gross New Lending Flows ($m per month)
2,000
1,500
1,000
500
0
-500
-1,000
-1,500
-2,000
-2,500
-3,000
2016 2017 2018 2019 2020
Investor Owner-occupier
After the tumultuous period in April/May when mortgage lenders had to focus on their existing clients and
process a large number of mortgage payment deferral applications (as well extensions to loan lengths and
switches to interest-only payments), attention has now firmly switched back to new mortgage lending activity.
Indeed, in July, new lending surged back up to $6.6bn (about $680m higher than a year earlier) and rose even
further to $6.8bn in August – a massive $1.4bn higher than the same month in 2019.
However, despite the temporary removal of the loan to value ratio (LVR) speed limits, the bounce-back in
mortgage flows hasn’t been driven by a rebound in high LVR lending or a surge in interest-only lending.
Indeed, in August, interest-only lending only accounted for 26% of the total – still way below the figures of 40%
in 2015-16. Meanwhile, the share of August’s lending at 80% LVR or above was only 11% – for context, bear in
mind that the previous high LVR speed limit for owner-occupiers was 20% (and for investors it was 5%).
In other words, banks are still keeping a pretty close eye on lending standards. In addition to the continued
deposit requirements, stringent testing of income is still being carried out, as well as checking that a borrower
could pay the mortgage at today’s interest rates (circa 2.5%) but also in an alternative scenario where rates
spiked to somewhere around 6-6.5%. Mortgage pricing is most attractive to borrowers at a fixed term of
about one year at present. Hence, it’s not surprising that nearly 60% of the stock of existing mortgages are
fixed for up to one year. About 30% of loans are fixed for more than one year, leaving only a small share on
floating rates.
16 Sources: Reserve Bank of New ZealandLooking ahead, the availability High LVR Lending to Owners and Investors (% of new lending)
of mortgage finance looks set
to stay pretty favourable for 25%
borrowers. After all, the
Reserve Bank has
acknowledged that it does not
20%
want to risk a recession and job
losses just because credit has
been prevented from flowing
(or because banks face funding 15%
pressures arising from savers
ending their term deposits due
to low returns). To this end, 10%
pretty shortly we could have a
Funding for Lending
Programme in NZ, where the
5%
RBNZ lends directly to banks, at
an interest close to or at the
OCR. These funds would then
be available to lend out as 0%
2014 2015 2016 2017 2018 2019 2020
mortgages or business loans at
low interest rates.
Finally, it’s worth bearing in Refinancing Profile for Mortgages (% of stock)
mind that although very few 40%
new applications for mortgage
payment deferrals are being 35%
processed each week at
present, there are still many
30%
existing deferral plans that will
run through to March next year.
25%
It’ll be important to keep an eye
on how smoothly they roll off
those deferrals from April. 20%
15%
10%
5%
0%
Floating Fixed < 1 year Fixed > 1 year
Investor Owner-occupier
Sources: Reserve Bank of New Zealand 17Sales Volumes
After the distortions of April/May, it’s fair to say that Nationwide Sales Volumes
the subsequent rebound in property sales volumes (monthly total)
has been rapid. The estimated total for September
(both agent and private) of almost 9,700 was the 14,000
13,000
highest for any month since May 2016 and also the
12,000
sixth highest of any month in the past 15 years or 11,000
so. The rebound in activity has been seen in most 10,000
parts of the country – and it’s worth noting that 9,000
8,000
sales activity may have been even higher still, were it
7,000
not for the low supply of property listed and actually 6,000
available to buy. 5,000
4,000
There’s no denying that genuine, new demand has 3,000
come forward to buy property in the past few 2,000
1,000
months – not least from investors who are unhappy 0
1996 1999 2002 2005 2008 2011 2014 2017 2020
with low term deposit rates and can also now get
into the property market with a 20% deposit rather
than the previous 30%. Nationwide Annual Change
However, some of the strength in property sales in Sales Volumes (%)
volumes in the past few months is also likely to be
some ‘catch up’ for the earlier weakness. Indeed, the 40%
cumulative total for the year to date in 2020 is still a
20%
touch below where it was in 2019, suggesting that to
some degree there has been a shift of activity out of 0%
April/May and into the more recent months.
-20%
Looking ahead, the environment looks favourable -40%
for more solid levels of property market activity in
the coming months. Admittedly, with the wage -60%
subsidy winding down, we need to be wary of the -80%
threat of higher unemployment. However, mortgage 1996 1999 2002 2005 2008 2011 2014 2017 2020
rates are low and potentially set to fall even further,
so this points to support for property market activity
levels and prices.
Regional Sales Volumes
(year-on-year % change)
40%
35%
30%
25%
20%
15%
10%
5%
0% 29 .7% 42 .0% 29 .0% 37 .7% 26 .7% 18 .6% 9 .7%
NZ AUK HAM TAU WE L C HC DUN
18 Source: CoreLogicValues
After a lot of uncertainty from Average Value of Housing Stock - New Zealand ($)
April to June about how
property values might fare
$743,678
during the COVID phase and
$700,000
economic recession, that mood
has turned more positive lately
and indeed values themselves $600,000
have generally continued to
hold up across the country –
$500,000
primarily reflecting low
mortgage rates and the tight
supply/demand balance of $400,000
property on the market.
$300,000
In September, national average
property values rose by 0.8% in $ 7 4 3 , 6 7 8
the month, to stand at almost $200,000
$744,000. That also left the
three month change at 0.8%
$100,000
(values had held steady in July
and August), and they’re
currently 2.1% higher than six $0
months ago. The annual change 2005 2008 2011 2014 2017 2020
perhaps isn’t the most useful
measure at present, given that Annual and Quarterly Change in Value (%)
it looks back to pre-COVID
September last year, but for 20%
what it’s worth that figure is
currently 7.6%.
15%
On the whole, the performance
of property values in the past
few months has certainly defied 10%
the gloomy predictions from
April/May and it would appear
that the momentum for values 5%
is firmly upwards for now. That
said, we shouldn’t get carried
away – small falls in values 0%
couldn’t be ruled out if
unemployment rises more
-5% Quarterly Change $5,660 0 .8%
sharply over 2021 than is
Annual Change $52,281 7 .6%
currently envisaged, and
5 Year Change $204,691 38%
borrowers rolling off mortgage
-10%
payment deferrals perhaps find
it tougher than they thought. 2005 2008 2011 2014 2017 2020
Annual Change %
Quarterly Change %
19House Price Index
The general resilience of national property values Average Dwelling Value ($)
to COVID-related uncertainty, economic recession,
and rising unemployment has been mirrored in New Zealand
$1,000,000 Auckland
each of the main centres. Hamilton
Tauranga
$800,000 Wellington
In Auckland, average values have actually dipped a Christchurch
Dunedin
little in the past three months (-0.4%), but over a
$600,000
longer period are currently 1.2% higher than six
months ago. Those rises have been driven by
$400,000
Franklin, Papakura, Waitakere, and Manukau, with
Rodney, City, and North Shore a little softer (but $200,000
still with values higher than they were six months
ago). $0
2008 2011 2014 2017 2020
Elsewhere, Hamilton and Wellington have been
solid performers in the past few months, with
average values up by 3.2% and 1.7% respectively since June. Compared to a year ago, values in both those
centres are up by around the 10% mark. Tauranga’s values edged down by 0.3% in September alone and have
been flat since June. But continued growth over April to June means that values there are still 2.9% higher
than six months ago.
In the South Island, both Christchurch and Dunedin have seen average values rise by around 1.5% since
March. However, Dunedin’s values have been flat since June and there are signs that the previous strong
upwards momentum in that part of the country has eased. That wouldn’t be surprising, given that a sustained
upswing since around 2015 has seen housing affordability pressures emerge.
September 2020
Current value 1 month 3 months 12 months 5 years
New Zealand $743,678 0.8% 0.8% 7.6% 38%
Auckland $1,078,326 0.5% -0.4% 5.0% 20%
Hamilton $647,777 0.8% 3.2% 9.7% 56%
Tauranga $795,182 -0.3% 0.1% 6.4% 58%
Wellington $797,196 1.1% 1.7% 11.4% 74%
Christchurch $522,057 0.5% 0.7% 5.0% 10%
Dunedin $547,429 0.4% 0.0% 15.6% 81%
20Annual Value Change (%)
-9% 21%
© 2020 Mapbox © OpenStreetMap
Over a longer horizon of 12 months which includes both pre- and post-COVID phases,
average property values have risen in almost all parts of the country, with strength most
evident around Dunedin and Southland, as well as the central and lower North Island.
Queenstown clearly stands out as hardest hit part of the country.
21Three Month Value Change (%)
-2% 5%
© 2020 Mapbox © OpenStreetMap
Over the timelier three month (post-COVID) period since June, again there is stability or
even further growth evident for average property values in most parts of the country.
However, the most expensive parts of the country – i.e. Queenstown and parts of Auckland
(namely City and North Shore) – have been a little softer.
22Rent
National Annual Change Gross Rental Yield – National (%)
in Value and Rent (%)
20% Annual change in rent
4.5%
Annual change in value
15% 4.0%
3.5%
10%
3.0%
5%
2.5%
0% 2.0%
1.5%
-5%
1.0%
-10%
0.5%
-15% 0.0%
2005 2008 2011 2014 2017 2020 2005 2008 2011 2014 2017 2020
National rents averaged $444 per week in the three months to September, up by 3.3% from the same quarter a year earlier.
There isn’t any widespread evidence of rents falling across large parts of the country, although it is looking clearer that the
previous upwards momentum has slowed. Indeed, for most of 2019, rental growth was averaging more than 5% annually,
so the slowdown to around 3% is quite marked.
Many of the main centres are still seeing solid demand for rental property and, with listings also relatively restrained, rents
are holding firm (albeit growth rates have slowed). Auckland’s figure for the three months to September was 2.0% higher
than a year earlier, with Christchurch at 2.5%. In Hamilton and Tauranga, average weekly rents are growing at rates of more
than 4% per annum. Dunedin is still seeing growth too.
Outside the main centres, however, the trends are a little patchier. There are still hotspots in areas such as Gisborne (14.5%
rise in rents in the past year), Invercargill (12.4%), and Palmerston North (11.5%). But there is clearer weakness for example
in Carterton (1.4% decline in rents), Central Otago (-4.1%), and especially Queenstown (-16.7%). That illustrates the effects of
the closed borders on our most tourism-dependent area, and translates into a fall in weekly rents from almost $590 a year
ago to just $490 now.
Rental yields around the main centres range from 2.6% in Auckland up to 3.9% in Dunedin. With term deposit rates falling
(and borrowing getting cheaper too), the rising presence of investors in the market shows that those property yields are
starting to look increasingly attractive.
Med Weekly Rent Ann chg rent Gross yield
Auckland $533 2.0% 2.6%
Hamilton $405 4.2% 3.3%
Tauranga $502 5.1% 3.3%
Wellington $500 0.7% 2.9%
Christchurch $357 2.5% 3.6%
Dunedin $406 9.4% 3.9%
23Buyer Classification
Buyer Classification – NZ Property Transfers by Non-Citizens
New Zealand (% of sales) or no Resident Visa (% of total
transfers)
3.5%
3.0%
30% 30%
26%
26% 2.5%
25%
25%
21%
2.0%
20%
1.5%
10% 10% 12% 1.0%
5% 5% 0.5%
4% 5%
4% 2%
0% 0.0%
2005 2008 2011 2014 2017 2020
Mover Multiple property owner mortgage Investor Owner-occupier
First home buyer Multiple property owner cash
New to market ReEntry Other
The third quarter of the year saw a continued strong presence for first home buyers (FHBs) and mortgaged
multiple property owners (MPOs, or investors) in the market, but existing owner-occupiers (movers)
continued to sit on the sidelines in many cases.
Starting with mortgaged investors, their share of purchases rose from 24% in Q2 to 26% in Q3, the highest
figure since Q3 2016 (which was just prior to the Reserve Bank introducing the 40% deposit requirement for
investors). The low interest rate environment is having a two-way effect on investors – it’s cheap to borrow, so
they’re actively seeking property because of that. But at the same time, low rates on term deposits are also
creating an incentive to take money out of the bank and look for alternative asset choices, such as property.
Indeed, the stock of money held in bank term deposits has actually fallen in recent months. Meanwhile,
investor demand for property has also been stimulated by the temporary removal of the LVR speed limits,
which has allowed more buyers to get in with a 20% deposit rather than the previous 30%.
The share of property purchases in Q3 made by first home buyers (FHBs) was 25%, up from 23% in Q2, and
the highest figure in the history of our Buyer Classification series (topping the previous peak of 24% in
2006-07). In some cases, FHBs are accessing the property market by switching property type (e.g. standalone
house to apartment) or looking at cheaper, more peripheral locations. However, FHB demand has also been
boosted by would-be OE’ers who are now instead buying a house earlier than anticipated, as well as any
returning kiwis who are also entering the property market without owning before. The upwards trend in
KiwiSaver balances has also boosted deposits for some FHBs and gives them a small advantage over other
buyer groups.
Looking at movers, their share of purchases dipped to just 25% in Q3, an historically low level. In some cases,
existing owner-occupiers are choosing to stay where they are due to already high debt levels and the extra
costs of moving house (such as legal, estate agent etc). But in other cases, people aren’t moving because they
simply can’t find the ideal next property, given the tight supply of available listings. In turn, that is feeding back
into an even tighter listings picture.
Looking ahead, it wouldn’t be a surprise to see these broad trends remain in place over the next few months,
with investors and FHBs still remaining pretty active, but movers quieter.
24 Source: Statistics New ZealandMain Cities Housing
Market Indicators
25Auckland Market Activity
Buyer Classification – Auckland Buyer Classification – Northland
(% of purchases) region (% of purchases)
40%
30%
28% 29% 32%
27% 28% 30%
27% 27%
20%
20% 21%
21%
20% 20%
19%
15%
10% 11% 12%
10%
7% 8% 7%
6% 7%
4% 5% 4%
1% 4% 2%
0% 0%
2005 2008 2011 2014 2017 2020 2004 2006 2008 2010 2012 2014 2016 2018 2020
Mover Multiple property owner mortgage Mover Multiple property owner mortgage
First home buyer Multiple property owner cash First home buyer Multiple property owner cash
New to market ReEntry Other New to market ReEntry Other
The composition of Auckland’s property purchasers in the last three months has broadly mirrored the
national trends, with first home buyers and mortgaged investors showing a strong presence, but existing
owner-occupiers (movers) not particularly active.
The share of purchases going to FHBs in Auckland in Q3 was 29%, up from 26% in Q2, and on a par with the
previous peak back in 2006. As with the trends nationally, FHBs in Auckland are accessing the market via
being willing to compromise on the property type or location, as well as using their KiwiSaver to fund the
deposit.
Mortgaged investors also raised their share of purchases in Auckland in Q3, up from 26% in Q2 2020 to 28%.
That’s the highest figure in around three years, and again reflects cheap borrowing costs, low returns on
other assets, and also the ability to enter with a lower deposit than before.
Meanwhile, the activity from movers has plunged around Auckland in recent months, with their share of
purchases only coming in at 20% in Q3. The lack of available listings will be a factor keeping more existing
owner occupiers where they are, but there’s also a pretty clear trend for Aucklanders to want to renovate
rather than relocating at present.
Around Auckland’s neighbouring areas, the mix of buyers is quite different in Northland, with movers
accounting for the highest share of activity so far in 2020, at 29% (albeit only 27% in the Q3 alone). It’s also
different to see that first home buyers have lost a little market share in Northland so far this year (although it
did tick up in Q3), but in tune with the rest of the country, investors’ presence has increased over the past few
quarters.
26Auckland Values
Average value of housing stock Annual and quarterly value change
Auckland ($) Auckland (%)
$1,100,000
$1,078,326
25%
$1,000,000
20%
$900,000
$800,000 15%
$700,000
10%
$600,000
$500,000 5%
$400,000
$300,000
$1,078,326 0%
-5% -$4,215 -0 .4%
$200,000 Quarterly Change
Annual Change $50,934 5 .0%
$100,000 -10% 5 Year Change $181,525 20%
2005 2008 2011 2014 2017 2020 2005 2008 2011 2014 2017 2020
Annual Change %
Quarterly Change %
Generally speaking, average property values across Auckland have held up pretty well in this post-COVID phase, even
though Auckland has obviously experienced more disruption than the rest of the country.
Over the past three months, Franklin and Papakura have seen values rise by about 2%, while Waitakere, Manukau, and
Rodney have also seen continued increases, albeit at slower rates.
In the more expensive parts of Auckland, i.e. the old City TA (central area) and the North Shore, the past three months have
been a little softer, with declines in average property values of 1.2% and 0.9% respectively. However, in September alone,
both of those areas saw values rise, so the dips on a three-month basis reflect sluggishness in July and August – which may
now have come to an end.
In broad terms, first home buyers and mortgaged investors tend to be more active in cheaper areas, while movers are
more important in more expensive areas (where a higher amount of equity is required). This pattern for buyer types – with
FHBs and investors generally busy at present; but movers quieter – would help to explain continued value gains in cheaper
parts of Auckland, but a more subdued picture in the central city/North Shore
SEPTEMBER 2020
Current value 1 month 3 month 12 months 5 years
Rodney $985,539 -0.2% 0.3% 4.7% 29%
North Shore $1,235,527 0.7% -0.9% 5.3% 17%
Waitakere $863,707 1.0% 0.7% 6.2% 20%
Auckland City $1,262,799 0.5% -1.2% 3.9% 19%
Manukau $945,550 0.4% 0.6% 6.7% 24%
Papakura $740,029 0.4% 1.6% 6.2% 30%
Franklin $711,065 0.7% 2.2% 5.9% 28%
27Current Suburb Values:
‘Mapping the Market’
Auckland suburb value change 2020 ($)
Generally speaking, property values around the country (except for Queenstown) have been more resilient
since lockdown than was initially predicted. CoreLogic’s interactive ‘Mapping the Market’ product shows the
changes over the past 12 months (covering a pre- and post-COVID phase), it’s freely available and updated
quarterly. The heatmaps in ‘Mapping the Market’ are point-in-time snapshots of median values from 2019 and
2020, and show the % and $ change over that period too. See www.corelogic.co.nz/mapping-market
Auckland is illustrated in the heatmap here. As at September 2020, Herne Bay remains the highest priced
suburb in Auckland, with a median property value of $2.71m. Auckland Central has the lowest median value
(reflecting its concentration of apartments), at about $540,000. Only four suburbs have a median value29
Hamilton Market Activity
     Buyer Classification – Hamilton                                            Buyer Classification – Waikato region
     (% of purchases)                                                           (% of purchases)
                                                                                40%
     40%

                                                                          35%                                                                       32%
     30% 31%                                                                    30% 31%

            27%                                                           26%
            25%                                                                        25%
                                                                                                                                                    22%
     20%                                                                        20%
                                                                                                                                                    19%
                                                                          19%          17%
                                                                                       14%                                                          14%
                                                                          12%
     10%                                                                        10%
             7%                                                                         6%
                                                                          4%            4%                                                          5%
             4%                                                                                                                                     5%
             3%                                                           3%            3%
                                                                          1%                                                                        2%
     0%                                                                         0%
                  2006   2008   2010   2012   2014   2016   2018   2020                  2004   2006   2008    2010   2012   2014   2016   2018   2020

           Mover                Multiple property owner mortgage                      Mover                   Multiple property owner mortgage
           First home buyer     Multiple property owner cash                          First home buyer        Multiple property owner cash
           New to market        ReEntry       Other                                   New to market           ReEntry       Other

     Hamilton’s Buyer Classification trends have also mirrored the national picture lately, but with the upswing in
     market share for mortgaged investors even more pronounced.

     Indeed, in the third quarter of 2020, mortgaged investors accounted for 35% of property purchases in
     Hamilton, well above the national figure of 26% (which itself was pretty high). After easing lower throughout
     2019, the market share for cash investors has also rebounded lately in Hamilton (currently 12%).

     Meanwhile, first home buyers held steady at a 26% share of purchases in Hamilton in Q3. That’s pretty much
     in line with where the share for FHBs has hovered for about the last two years now, and certainly much higher
     than the trough of just 17% in Q3 2015 (when mortgaged investors were running at a rampant 40% share).
     Finally, the share going to movers fall away in Q3, and is now just 19%, a record low.

     Around the wider Waikato region (excluding Hamilton), buyer classification patterns in Q3 saw movers’ share
     hold relatively steady (at about 32%), but FHBs and mortgaged investors edge higher – at the expense of cash
     investors (which fell from 17% in Q2 to 14% in Q3).

30
Hamilton Values
Average value of housing stock Annual and quarterly value change
Hamilton ($) Hamilton (%)
$647,777
$600,000 30%
25%
$500,000
20%
$400,000
15%
10%
$300,000
5%
$200,000
0%
$100,000 -5%
Quarterly Change $20,000 3 .2%
Annual Change $57,277 9 .7%
-10%
$0 5 Year Change $231,487 56%
2005 2008 2011 2014 2017 2020 2005 2008 2011 2014 2017 2020
Annual Change %
Quarterly Change %
Hamilton’s average property values have been pretty strong in the past few months, up by 0.8% in September alone and by
3.2% since June. The level is now just short of $648,000.
The growth in September was pretty broad-based across Hamilton, albeit South East did see a small dip of 0.5%. But over a
three-month horizon, all parts of the city have seen increases (ranging from 2.4% up to 3.7%), and looking on an annual
basis South East and Central & North West are into double-digit gains.
SEPTEMBER 2020
Current value 1 month 3 month 12 months 5 years
Hamilton Central &
$608,988 2.6% 3.7% 12.4% 57%
North West
Hamilton North East $787,131 1.4% 2.6% 6.9% 49%
Hamilton South East $601,129 -0.5% 2.4% 10.1% 57%
Hamilton South West $580,378 0.4% 3.3% 9.9% 59%
31Tauranga Market Activity
Buyer Classification – Tauranga Buyer Classification – Bay of Plenty
(% of purchases) region (% of purchases)
40%
40%
30% 30%
33%
30%
31% 27%
27%
25%
25% 22%
23% 20%
20% 18%
19%
16% 14%
15% 13%
15%
10%
10%
6% 6% 6%
5% 5%
4%
4%
4%
3% 3% 1%
2% 0%
0%
2006 2008 2010 2012 2014 2016 2018 2020 2003 2006 2009 2012 2015 2018 2021
Mover Multiple property owner mortgage Mover Multiple property owner mortgage
First home buyer Multiple property owner cash First home buyer Multiple property owner cash
New to market ReEntry Other New to market ReEntry Other
During the period from July to September, movers remained the key buyer group in Tauranga, accounting for
31% of purchases. The high market share for movers contrasts with all of the other main centres, and
potentially illustrates how a solid base of equity/wealth (which movers have, either from having lived locally or
bringing in equity from other parts of the country) is important in Tauranga, rather than necessarily local
wages being a key driver for a property purchase.
Even so, both first home buyers and mortgaged investors increased their market share in Q3. For FHBs, the
rise was from 17% in Q2 to 19%, and for mortgaged investors it was 23% to 25%. You have to go back almost
three years for a time when mortgaged investors had a stronger presence in Tauranga than they currently
have. Around the wider Bay of Plenty region (excl. Tauranga), mortgaged investors are also seeing a solid
market share at present, with movers quieter.
32Tauranga Values
Average value of housing stock Annual and quarterly value change
Tauranga ($) Tauranga (%)
$800,000
$795,182
30%
$700,000
25%
$600,000
20%
$500,000
15%
$400,000
10%
$300,000 5%
0%
$200,000
-5%
$100,000 Quarterly Change $993 0 .1%
Annual Change $47,689 6 .4%
-10%
$0 5 Year Change $292,411 58%
2005 2008 2011 2014 2017 2020 2005 2008 2011 2014 2017 2020
Annual Change %
Quarterly Change %
Tauranga’s average property values have lost a little steam since June, dipping by a minor 0.3% in September, which left
them flat for the past three months. However, gains from April to June mean that they’re still 2.9% higher than in March, and
6.4% above a year ago. The average value in Tauranga is now $795,200.
Momentum remains stronger in other areas such as Rotorua (rise in average values of 5.2% since June) and Whakatane
(2.0%), although the level of prices is still sub-$550,000 in both those markets.
33Wellington Market Activity
Buyer Classification – Wellington Buyer Classification – Lower Hutt
(% of purchases) region (% of purchases)
40%
30% 30%
27% 29%
27%
30% 30% 32%
30%
28%
20% 20% 25%
20% 21%
10%
8% 10%
8% 8%
6% 5%
4% 4% 4% 5%
3% 3% 3%
2% 2%
0% 0%
2005 2008 2011 2014 2017 2020 2004 2006 2008 2010 2012 2014 2016 2018 2020
Mover Multiple property owner mortgage Mover Multiple property owner mortgage
First home buyer Multiple property owner cash First home buyer Multiple property owner cash
New to market ReEntry Other New to market ReEntry Other
Across the four main territorial authorities in Wellington (City, Lower Hutt, Upper Hutt, Porirua), first home
buyers remained the largest buyer group in Q3, accounting for 30% of property purchases. But mortgaged
investors continued to close the gap, rising from a 27% market share in Q2 2020 to 29% in Q3. Porirua has
been a key contributor to that rise, with mortgaged investors there accounting for 28% of purchases so far in
2020, up sharply from 24% in 2019.
Meanwhile, existing owner occupiers are very quiet around Wellington at present, accounting for just 20% of
purchases in Q3, a new record low for the 15 year history of this series. As with other parts of the country, the
tight supply of available listings is meaning that many would-be movers are instead just staying where they
are, and potentially renovating (rather than run the risk of selling and not being able to find their ideal next
home).
At a more detailed level, FHBs remain key in Lower Hutt (36% of purchases so far in 2020), while in Upper Hutt
movers slightly retain the upper hand (33% share versus 31% to FHBs). Mortgaged investors and FHBs have
close market shares in Wellington City (about 30% each), while there’s been a big rise for mortgaged investors
in Porirua so far this year – up from 24% share in 2019, to 28% in 2020 to date. Over the hill, Masterton
remains a movers market, as does South Wairarapa. Kapiti Coast has seen a rising market share for
mortgaged investors this year, but movers still dominate.
34Wellington Values
Average value of housing stock Annual and quarterly value change
Wellington ($) Wellington (%)
$800,000
$797,196
$700,000
20%
$600,000
15%
$500,000
10%
$400,000
5%
$300,000
0%
$200,000
-5% Quarterly Change $13,541 1 .7%
$100,000
Annual Change $81,456 11 .4%
-10% 5 Year Change $339,426 74%
$0
2005 2008 2011 2014 2017 2020 2005 2008 2011 2014 2017 2020
Annual Change %
Quarterly Change %
The wider Wellington property market has been resilient in recent months, with values having risen across the board since
June – ranging from 0.6% in Masterton up to 5.0% in South Wairarapa. Kapiti Coast, Porirua, and Upper Hutt have all had
gains since June of about 3% or more.
Perhaps reflecting the higher level of prices (almost $900,000) and tougher affordability, Wellington City itself has been a
little more subdued in terms of growth, but 1.3% in the past three months and 8.7% over the past year are still relatively
strong figures.
SEPTEMBER 2020
Current value 1 month 3 month 12 months 5 years
Porirua $710,763 2.7% 2.8% 16.2% 87%
Upper Hutt $661,211 1.5% 3.4% 15.1% 96%
Lower Hutt $697,171 1.2% 1.6% 14.7% 87%
Wellington City $899,358 0.6% 1.3% 8.7% 65%
Carterton $496,900 0.8% 4.2% 12.9% 86%
Masterton $442,605 -0.2% 0.6% 11.4% 90%
South Wairarapa $607,813 7.3% 5.0% 13.0% 94%
Kapiti Coast $688,424 2.4% 2.8% 12.3% 79%
35Christchurch Market Activity
Buyer Classification – Christchurch Buyer Classification – Canterbury
(% of purchases) region (% of purchases)
40%
40%
33%
35% 36%
30%
28% 30%
24% 26%
23% 21%
20% 22% 22%
20% 19%
16%
13%
13%
10% 11%
10%
8%
6% 6% 6%
4% 5% 5% 5%
4% 3% 1%
2%
0% 0%
2005 2008 2011 2014 2017 2020 2003 2006 2009 2012 2015 2018 2021
Mover Multiple property owner mortgage Mover Multiple property owner mortgage
First home buyer Multiple property owner cash First home buyer Multiple property owner cash
New to market ReEntry Other New to market ReEntry Other
Christchurch is seeing very similar Buyer Classification trends to the other main centres, with first home
buyers and mortgaged investors active, but movers quiet.
Indeed, the market share for FHBs rose back from 25% in Q2 2020 to 28% in Q3 – pretty much as high as it’s
ever been. Mortgaged investors have also continued their return from the lulls of 2018, and their market
share rose to 26% in Q3, up from 24% a year ago. Movers’ market share in Christchurch was just 21% in Q3, a
low only matched once before (in Q4 2013).
Around the wider Canterbury region, movers play a bigger role than in Christchurch itself, such as in
Ashburton where movers have been 32% of activity so far in 2020 (albeit down from 38% in 2019). Timaru has
also seen the movers’ market share fall so far in 2020 (36% in 2019 to 32%), with mortgaged investors more
active. Meanwhile, Selwyn has seen movers’ share top 40% this year, no doubt reflecting to some extent
existing owners (either from Selwyn or other parts of Canterbury) seeking out a new-build. A similar pattern
has been seen in Waimakariri in 2020 so far too.
36Greater Christchurch Values
Average value of housing stock Annual and quarterly value change
Christchurch ($) Christchurch (%)
$522,057
$500,000
35%
30%
$400,000
25%
20%
$300,000
15%
10%
$200,000
5%
0%
$100,000
-5% Quarterly Change $3,688 0 .7%
Annual Change $24,767 5 .0%
-10%
$0 5 Year Change $47,243 10%
2005 2008 2011 2014 2017 2020 2005 2008 2011 2014 2017 2020
Annual Change %
Quarterly Change %
Christchurch’s housing affordability is better than each of the other main centres and although this may not necessarily set
it up for immediate outperformance, it does help to explain a little about why values have been resilient to the recession.
Across the city as a whole, average values now stand at $522,057, about 1.5% higher than six months ago. Each sub-market
in Christchurch has also held up pretty well in recent months, and Selwyn and Waimakariri have also shown growth in the
past three months (0.4% and 0.9% respectively).
SEPTEMBER 2020
Current value 1 month 3 month 12 months 5 years
Banks Peninsula $552,939 2.9% 2.6% 6.6% 12%
Christchurch Central &
$609,761 0.3% 0.4% 4.8% 10%
North
Christchurch East $395,749 0.7% 0.7% 4.6% 10%
Christchurch Hills $709,894 -0.3% 0.0% 4.9% 11%
Christchurch Southwest $497,464 0.9% 1.1% 5.0% 10%
Selwyn $569,967 -0.1% 0.4% 2.5% 10%
Waimakariri $469,805 0.7% 0.9% 4.1% 13%
37Dunedin Market Activity
Buyer Classification – Dunedin Buyer Classification – Otago
(% of purchases) region (% of purchases)
30% 30%
30%
29% 27%
28% 27% 24%
26% 23% 22%
20% 22%
20% 20% 18% 19%
15%
10%
10%
9% 8%
8%
7% 6%
4% 5%
4% 4% 3%
3%
2% 2%
0% 0%
2005 2008 2011 2014 2017 2020 2003 2006 2009 2012 2015 2018 2021
Mover Multiple property owner mortgage Mover Multiple property owner mortgage
First home buyer Multiple property owner cash First home buyer Multiple property owner cash
New to market ReEntry Other New to market ReEntry Other
Mortgaged investors remained a key buyer group in Dunedin in Q3, with 27% of purchases – more or less a
record high. However, it was perhaps even more interesting that the share of purchases made by first home
buyers also climbed to 27%, and the share for movers dipped to 26%. That is the first time in the 15 year
history of this series that FHBs have had a higher quarterly market share than movers in Dunedin. Once again,
the lack of listings is likely to be a key factor for why more owner occupiers are choosing to stay where they
are.
38You can also read