ORANGEVILLE LAND NEEDS ASSESSMENT AND COMMERCIAL MARKET ANALYSIS - PREPARED FOR TOWN OF ORANGEVILLE
←
→
Page content transcription
If your browser does not render page correctly, please read the page content below
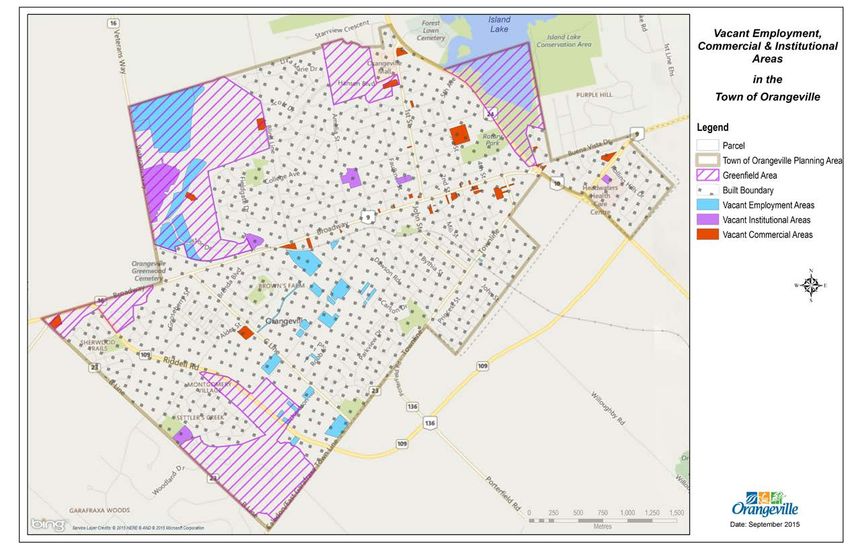
Image Credit: Town of Orangeville

               ORANGEVILLE LAND NEEDS ASSESSMENT AND
                         COMMERCIAL MARKET ANALYSIS
                                 PREPARED FOR TOWN OF ORANGEVILLE

2 March 2016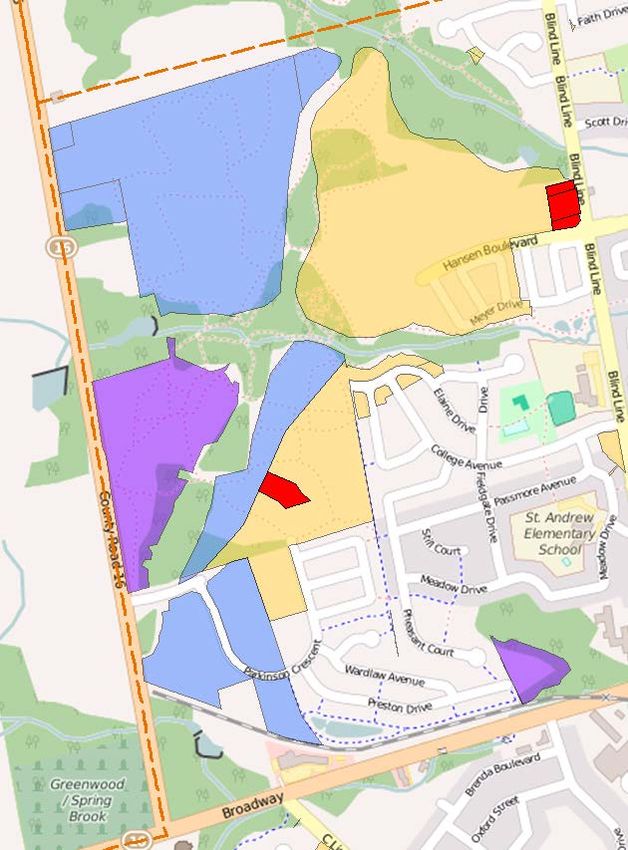
Orangeville Land Needs Assessment and Commercial Market Analysis

2 March 2016,

Ms. Nancy Tuckett,
Director of Economic Development, Planning and Innovation,
Department of Economic Development, Planning and Innovation
Town of Orangeville
87 Broadway,
Orangeville, Ontario
L9W 1K1

Dear Nancy,

RE: Orangeville Land Needs Assessment and Commercial Market Analysis

urbanMetrics inc. has been retained by the Town of Orangeville, together with MHBC, to evaluate the land needs for the Town of
Orangeville as part of their five year review of their Official Plan. urbanMetrics inc. is pleased to submit our report which examines:
         •   The future demand for commercial space in the Town of Orangeville to full build out;

         •   Recommendations with respect to benefits of commercial/retail development relative to employment development;

         •   Market and economic recommendations in terms of types of employment uses for the currently vacant employment
             corridors (i.e. Hansen Boulevard, Veterans’ Way, Parkinson Crescent, etc.);

         •   The economic impact and merits of the current and/or re-designation of the Humber Lands (12.02 ha) in the town
             (highest and best use);

                                                                                                                                          1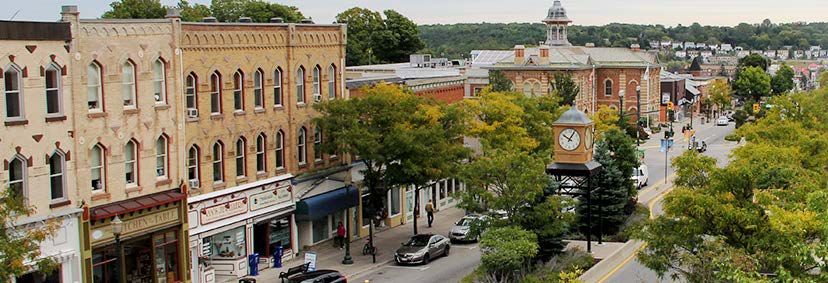
Orangeville Land Needs Assessment and Commercial Market Analysis

We appreciate the opportunity to conduct this assignment on your behalf and we look forward to discussing the results of our report
with you.
Yours truly,
urbanMetrics inc.

Rowan F.J. Faludi, MCIP, RPP, PLE, CMC
Partner

                                                                                                                                  2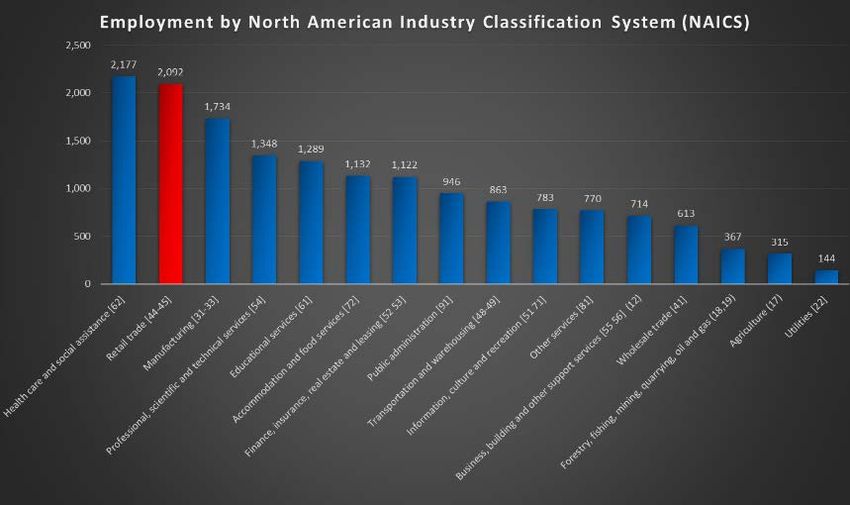
Orangeville Land Needs Assessment and Commercial Market Analysis

Table of Contents
1 Introduction                                                                                                                                                                             6
    1.1   Background ......................................................................................................................................................................6
    1.2   Objectives ........................................................................................................................................................................6
    1.3   Approach..........................................................................................................................................................................7
    1.4   Assumptions ....................................................................................................................................................................8
2     Orangeville Market Characteristics                                                                                                                                                   9
    2.1   Growth Projections ...........................................................................................................................................................9
      2.1.1       Growth Plan for the Greater Golden Horseshoe                                                                                                                             9
      2.1.2       Dufferin County Official Plan                                                                                                                                           10
      2.1.3       Town of Orangeville Official Plan                                                                                                                                       11
      2.1.4       Population Forecast Summary                                                                                                                                             12
      2.1.5       Employment Forecast Summary                                                                                                                                             12
    2.2   Demographic Characteristics .........................................................................................................................................13
    2.3   Labour Market ................................................................................................................................................................14
3     Commercial Market Analysis                                                                                                                                                          19
    3.1   Commercial Supply ........................................................................................................................................................19
    3.2   Commercial Demand......................................................................................................................................................21
    3.3   Reconciliation of Supply & Demand – Commercial Space ..............................................................................................25
    3.4   Reconciliation of Supply & Demand – Commercial Lands ..............................................................................................25
    3.5   Comparison With MHBC Commercial Land Use Projections ..........................................................................................26
4     Issue #1: Commercial/ Retail Development vs Employment Development                                                                                                                  27
5     Issue #2: Vacant Employment Corridors                                                                                                                                               30

                                                                                                                                                                                                 3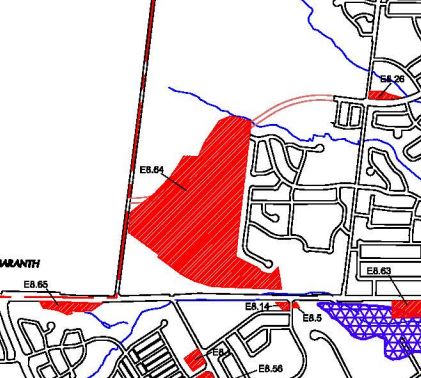
Orangeville Land Needs Assessment and Commercial Market Analysis

    5.1   Corridor Description .......................................................................................................................................................30
    5.2   Land Use Designation ....................................................................................................................................................31
    5.3   Market Recommendations .............................................................................................................................................32
6     Issue #3: Humber Lands                                                                                                                                                         33
    6.1   Existing Conditions .........................................................................................................................................................33
    6.2   Permitted Uses - Institutional Lands ...............................................................................................................................34
    6.3   Market Recommendations .............................................................................................................................................34
7     Overall Findings                                                                                                                                                               36
Appendix A: Commuter Flows                                                                                                                                                           38

                                                                                                                                                                                            4
Orangeville Land Needs Assessment and Commercial Market Analysis

                                                                          List of Figures
Figure 2-1: Growth Plan Projections: Dufferin County ........................................................................................................................ 9
Figure 2-2: County of Dufferin: Population Forecasts ....................................................................................................................... 10
Figure 2-3: County of Dufferin: Employment Forecasts .................................................................................................................... 11
Figure 2-4: Employment Targets ...................................................................................................................................................... 13
Figure 2-5: Demographic Indicators ................................................................................................................................................. 14
Figure 2-6: Labour Market ................................................................................................................................................................ 15
Figure 2-7: Employment by Industry: Town of Orangeville (2006, 2011 and 2014) - Graph .............................................................. 17
Figure 2-8: Employment by Industry: Town of Orangeville (2006, 2011 and 2014) - Data ................................................................ 18
Figure 3-1: Development Applications with Commercial Space Proposed........................................................................................ 20
Figure 3-2: Per Capita Space Analysis (Square Feet) ...................................................................................................................... 23
Figure 3-3: Per Capita Space Analysis continued (Square Feet) ...................................................................................................... 24
Figure 4-2: Employment by Industry (2014) ..................................................................................................................................... 29
Figure 5-1: Vacant Employment Corridors ....................................................................................................................................... 30
Figure 5-2: Special Policy Area E8.64, Schedule B, Town of Orangeville Official Plan ..................................................................... 32
Figure 6-1: Humber Lands ............................................................................................................................................................... 33
Figure A-1: Commuter Flows, 2011.................................................................................................................................................. 38

                                                                                                                                                                                           5
Orangeville Land Needs Assessment and Commercial Market Analysis
1 Introduction
1.1 BACKGROUND
urbanMetrics inc. has been retained by the Town of Orangeville, together with MHBC, to evaluate the land needs for the Town of
Orangeville as part of their five year Official Plan review. Based on the projected population and employment forecasts for the Town
of Orangeville and the lands needs analysis prepared by MHBC (hereafter referred to as the “MHBC Study”), urbanMetrics has
prepared a Commercial Demand and Market Analysis to identify the future commercial space required to meet the Town’s projected
population growth. As part of the overall study, MHBC was requested to develop employment and land use targets based on the
future allocation of reserved employment by Dufferin County. We have also considered the impacts to the land use needs arising
from these employment targets. We have also prepared a review of the Labour Market in the Town of Orangeville and provided
specific market recommendations to the Town on a number of land use issues.
1.2 OBJECTIVES
The purpose of the study is to provide direction to the Town of Orangeville regarding the future demand for commercial space, as
well as providing strategic market recommendations in relation to the vacant employment and institutional lands that exist in the
north-west of the Town.
Specifically, the fundamental inquiries of this study area addressed by urbanMetrics are as follows:
1. What is the future demand for commercial space in the Town of Orangeville to full build out?
2. Recommendations with respect to benefits of commercial/retail development relative to employment development;
3. Market and economic recommendations in terms of types of employment uses for the currently vacant employment
corridors (i.e. Hansen Boulevard, Veterans’ Way, Parkinson Crescent, etc.); and
4. The economic impact and merits of the current and/or re-designation of the Humber Lands (12.02 ha) in the town
(highest and best use).
6Orangeville Land Needs Assessment and Commercial Market Analysis
1.3 APPROACH
The following provides an overview of the various work steps that have been undertaken by urbanMetrics in preparing this study
• Collection, Review and Analysis of Relevant Background Materials
We have collected and reviewed a variety of relevant background information from the Town of Orangeville, as well as
through our own independent research. This includes a review of the Towns’ existing Official Plan policies; Development
Charges background studies, recent market demand and impact analyses undertaken in the Town of Orangeville;
development application statistics; as well as population and employment forecasts prepared by the Town of Orangeville,
Dufferin County and other nearby municipalities.
• Determination of the Town of Orangeville’s Market Characteristics
We have undertaken a detailed demographic and trend analysis for the Town as a whole, including a review of the Town’s
growth projections, economic and labour characteristics and demographics.
• Analysis of the Town of Orangeville’s Commercial Needs Assessment
We have undertaken a detailed per capita space market demand analysis by major store type; including Food Store Retail
(FSR) and Non-Food Store Retail (NFSR) and Services. In particular, this analysis has relied on build out population
estimates and this analysis has been used to project commercial space needs in the Town to full build out. Similarly, this
analysis has also been used to determine how well the existing supply of commercial land and space will be able to
accommodate existing and future retail and service commercial needs throughout this period.
• Market Recommendations
Based on the results of the various research and analysis described in the previous work steps, we have provided a
summary of our key research findings and conclusions. We have also developed a number of recommendations as to how
the Town should plan to best market its vacant employment corridors and the vacant Humber Lands including what future
uses could be accommodated on these lands based on the Industrial, Commercial and Institutional (ICI) Land Use Analysis
conducted by MHBC. For further details on the land needs assessments analysis, the “Land Needs Assessment, Town of
Orangeville”, 2016, prepared by MHBC should be referenced (the “MHBC Study”). The market recommendations prepared
by urbanMetrics have considered the findings of the MHBC Study’s “Land Needs Assessment”. Cross-references to the
MHBC Study are included as part of the urbanMetrics report. The urbanMetrics study should be read together with the
MHBC Study.
7Orangeville Land Needs Assessment and Commercial Market Analysis
1.4 ASSUMPTIONS
In any analysis requiring estimates of future conditions, it is necessary to make certain basic assumptions, as follows:
• Over the forecast period, a reasonable degree of economic growth and stability will prevail in Canada, Ontario and
specifically in Dufferin County.
• The population and employment forecasts are assumed reasonable and will not vary significantly from actual counts in the
future.
The findings and recommendations presented in this report represent our best judgment based upon the information available to
us as of the date of our research.
If, for any reason, there are significant deviations from any of these assumptions, the report and its conclusions should be
reviewed or re‐examined.
8Orangeville Land Needs Assessment and Commercial Market Analysis
2 Orangeville Market Characteristics
2.1 GROWTH PROJECTIONS
We have reviewed the growth projections at Provincial, County and Municipal level for Dufferin County and the Town of Orangeville
to assess the potential growth of the Town’s population and employment base. The results are summarised as follows.
2.1.1 Growth Plan for the Greater Golden Horseshoe
Amendment 2 to the Growth Plan for the Greater Golden Horseshoe (“Growth Plan”) sets out the growth projections for the County
of Dufferin. The County’s population growth is projected to grow moderately to 2036 at a rate of 200 persons per year, increasing to
800 persons per year in the last years of the forecast, between 2036 and 2041.
Employment growth to 2036 is projected to grow at a significantly higher rate than the population growth. However, it is projected to
slow down in the five year period to 2041.
Figure 2-1: Growth Plan Projections: Dufferin County
GROWTH PLAN, AMENDMENT NO. 2 PROJECTIONS
County of Dufferin 2031 2036 2041
Population 80,000 81,000 85,000
Annual Growth 200 800
Average Annual Growth Rate 0.3% 1.0%
Employment 29,000 31,000 32,000
Annual Growth 400 200
Average Annual Growth Rate 1.4% 0.6%
SOURCE: Schedule 3 Distribution of Population and Employment for the Greater Golden Horseshoe to 2041,
Amendment 2 to the Growth Plan for the Greater Golden Horseshoe (2013).
9Orangeville Land Needs Assessment and Commercial Market Analysis
2.1.2 Dufferin County Official Plan
The Dufferin County Official Plan (“County Official Plan”) was approved in March 25, 2015 and is now in effect with the exception of
three sections which are under appeal. The growth allocations are not subject to any of these appeals. At the time of the Official
Plan’s preparation, the County was unable to distribute the total population and employment growth allocated. As a result, there are
reserved future population and employment allocations to 2036. The reserved population is intended to be accommodated within
the three urban settlements (i.e. Town of Orangeville, Town of Shelburne and Town of Grand Valley).
The Dufferin County Official Plan allocates the County’s overall population growth projections, as follows:
Figure 2-2: County of Dufferin: Population Forecasts
COUNTY OF DUFFERIN, POPULATION FORECASTS AND ALLOCATIONS TO LOCAL MUNICIPALITIES
2011
(excluding under- 2031 2036
count)
Orangeville 27,975 36,490 36,490
1
Shelburne 5,846 8,400 8,400
Grand Valley 2,726 7,478 7,503
Amaranth 3,963 4,680 4,710
East Garafraxa 2,595 3,150 3,180
Melancthon 2,839 3,410 3,430
Mono 7,546 9,770 9,890
Mulmur 3,391 4,290 4,340
Sub-Total Excluding Future Reserved Allocation 79,268 79,543
Future Reserved Allocation 2,332 3,057
Total for the County of Dufferin 56,881 80,000 81,000
SOURCE: Dufferin County Official Plan, Table 3.2a (Approved: March 25, 2015)
1
1,600 persons of Future Reserved Allocation is intended to be accomodated in Shelburne for a total of
10,000 persons.
10Orangeville Land Needs Assessment and Commercial Market Analysis
The Dufferin County Official Plan allocates the County’s overall employment growth projections, as follows:
Figure 2-3: County of Dufferin: Employment Forecasts
COUNTY OF DUFFERIN, EMPLOYMENT FORECASTS AND ALLOCATIONS TO LOCAL MUNICIPALITIES
Employment
2011 Stats 2031 2036
Canada
Orangeville 14,681 14,740 14,740
Shelburne 2,866 3,560 3,560
Grand Valley 634 1,190 1,190
Amaranth 701 810 810
East Garafraxa 295 570 570
Melancthon 332 380 380
Mono 1,851 2,020 2,020
Mulmur 640 820 820
No Fixed Place of Work Employment 2,910 2,910
Future Reserved Allocation 2,000 4,000
Total for the County of Dufferin 22,000 29,000 31,000
SOURCE: Dufferin County Official Plan, Table 3.2a (Approved: March 25, 2015)
The County is projected to increase its employment base by 9,000 jobs between 2011 and 2036. Based on these projections, there
is negligible employment growth projected between now and 2031 (and 2036) for the Town of Orangeville. However, there are an
additional 4,000 jobs planned to 2036 as a “future reserved allocation” which are not yet allocated. The reserved employment
growth is to be allocated within the urban settlements and community settlement areas.
Based on the existing allocations, the Town of Orangeville is expected to accommodate at least 45% of the County’s total
population base of 81,000 and 48% of the total employment base by 2036 (excluding allocations in reserve).
2.1.3 Town of Orangeville Official Plan
The Town of Orangeville Official Plan (“Official Plan”) was approved by the Ministry on October 21, 1985 and was last consolidated
on September 24, 2013. Section C2 of the Official Plan sets out the growth projections for the Town of 36,490 persons and 14,740
11Orangeville Land Needs Assessment and Commercial Market Analysis
jobs by 2031. These projections are in line with the Dufferin County 2031 projections. The Official Plan also recognises that the
population projections are contingent on adequate sewage capacity and water supply to accommodate the additional growth.
2.1.4 Population Forecast Summary
Based on the population projections reviewed by the MHBC Study, which considers the growth projections prepared for the Town
as part of the Watson & Associates 2014 Development Charges Background Study (“Watson Study”) as well as servicing capacity,
a future population of 36,490 persons is projected for the Town. This would result in an increase of 6,950 persons between early
2014 and full build out.
2.1.5 Employment Forecast Summary
Based on the population increase to 36,490 persons as forecasted in the Watson Study, total employment for the Town of
Orangeville (excluding work at home and No Fixed Place of Work (NFPOW) employment) is anticipated to reach approximately
12,230 at buildout based on Watson Study 1. The resulting increase in employment growth as a result is 870 jobs.
As discussed in Section 2.1.2, the Dufferin County Official Plan has not allocated additional employment growth to the Town of
Orangeville at this time. However, we note that the County’s projections include 4,000 jobs that are reserved for future allocation. As
the Town of Orangeville is the largest and most urbanised settlement in Dufferin County, the logical location for the majority of these
jobs will be to the Town. As part of this overall study, MHBC have prepared employment targets based on achieving a target ratio of
1 job for every two persons which results in a total target of 3,475 jobs at full build out. This approach is discussed in further detail
in Section 3 of the MHBC Study which states that establishing a target will guide the Town toward being a complete community in
conformity with the Growth Plan and County Plan.
Utilizing the same breakdown in employment growth sectors completed in the Watson Study, MHBC have provided a breakdown of
the total targeted 3,475 jobs. These employment targets have been replicated for reference purposes in the following table.
1
Discrepancies between total employment forecasts for the Town of Orangeville are due to the inclusion of Work at Home jobs.
Dufferin County employment projections for the Town of Orangeville exclude “Work at Home”. Town of Orangeville employment
projections include “Work at Home”.
12Orangeville Land Needs Assessment and Commercial Market Analysis
Figure 2-4: Employment Targets
Type Future Jobs New Jobs
Industrial 61% 2,120
Commercial 30% 1,043
Institutional 9% 313
Work at Home n.a. n.a.
Total 100% 3,475
SOURCE: MHBC Land Needs Assessment, Town of Orangeville, 2016, Table 8
2.2 DEMOGRAPHIC CHARACTERISTICS
The following section provides a comparative review of the Town of Orangeville’s demographics to Dufferin County and the
Province. Overall, the Town of Orangeville’s population is younger and each household is slightly larger than average. The Town of
Orangeville has lower income levels, lower education attainment levels and has grown at historically lower rates than both the
Province and County.
13Orangeville Land Needs Assessment and Commercial Market Analysis
Figure 2-5: Demographic Indicators
Population Growth Age Profile (2015)
Average Annual Growth Rate (2006-2011) 25.00%
1.0%
20.00%
0.8%
15.00%
0.6%
10.00%
0.4%
0.9%
0.7% 5.00%
0.6%
0.2%
0.00%
0 to 4 5 to 19 20 to 24 25 to 34 35 to 44 45 to 54 55 to 64 65 to 74 75 years
0.0% years years years years years years years years & over
Town of Orangeville Dufferin County Ontario
Town of Orangeville Dufferin County Ontario
Income Index to Province (2015) Education (2015)
1.02 35%
1.00 30%
0.98 25%
0.96 20%
0.94 15% 32%
0.92 1.00 10%
18%
0.90 16%
0.95 5%
0.88
0.90 0%
0.86 2015 Educational Attainment, University certificate, diploma or degree at
0.84 bachelor level or above
Town of Orangeville Dufferin County Ontario Town of Orangeville Dufferin County Ontario
SOURCE: urbanMetrics inc. based on Statistics Canada (2006 Census and 2011 National Household Survey) and 2015 Environics
Analytics data.
2.3 LABOUR MARKET
Based on Statistics Canada 2011 National Household Survey, the Town of Orangeville had an unemployment rate of 7.5%. While
lower than the Provincial average, it is slightly higher than the 7% rate in Dufferin County at that time. The Town’s unemployment
rate has increased significantly from 4.8% in 2006. A similar rise in County-wide unemployment rates also occurred during this time
14Orangeville Land Needs Assessment and Commercial Market Analysis
period. Both the Town and County have experienced increases in their unemployment rates at a much higher levels than the
Province.
Figure 2-6: Labour Market
Unemployment Rates % Work Status
84.0%
83.8%
9.0%
8.0%
7.0%
6.0%
5.0%
4.0%
7.5% 8.3%
7.0%
11.0%
10.8%
3.0% 6.4%
5.0%
5.0%
4.8% 4.5%
0.3%
0.1%
2.0%
1.0%
0.0% Worked at home Worked outside No fixed workplace Worked at usual
Town of Orangeville Dufferin County Ontario Canada address place
2006 2011 2006 2011
SOURCE: urbanMetrics inc. based on Statistics Canada (2006 Census and 2011 National Household Survey).
Note: Dufferin County includes the Town of Orangeville for all Labour Market Indicators including unemployment rates)
There has been little change to the overall composition of work place categorization (i.e. work status) in which Orangeville residents
are employed. Based on commuting flows, 55% of all residents travel outside of the Town of Orangeville for work. Mississauga and
Brampton each account for 14% of all journey-to-work trips. The proportion of residents who travel outside of the Town for work (i.e.
outflow) is higher than the inflow of workers to the Town. Out-of-town workers are attracted from a range of places owing to the
Town’s proximity to a wide range of rural communities. Approximately 21% of these commuters travel from Mono, Caledon and
Shelburne. (See Appendix A for further details).
With respect to the number of jobs in each employment industries in the Town of Orangeville, as shown in Figure 2-7, the key
change in the types of industries employing workers is the decline in occupations relating to manufacturing since 2006. In the same
time, there Town has experienced increases in more service and healthcare orientated industries.
15Orangeville Land Needs Assessment and Commercial Market Analysis
While this employment data points to the general scale and trends within each NAICS (North American Industrial Classification
System) category, it has certain limitations that must be recognized. First, due to the changing nature of Statistics Canada data, the
three years shown in this table are not directly comparable. The 2006 figures are considered most reliable as they are based on the
2006 Census (20% survey). The 2011 figures are derived from the less reliable Household Voluntary Survey completed in tandem
with the 2011 Census, while the 2014 figures are estimates compiled by Ontario Ministry of Agriculture, Food and Rural Affairs
(OMAFRA) analyst web-based tool prepared for the Town’s Orangeville Annual Economic Development Report 2014.
As shown in Figure 2-7, between 2006 and 2014 the number of manufacturing jobs has declined by 34% (i.e. a decline of 776
employees). However, the data suggests that most of this decline occurred between 2006 and 2011, with a slight upsurge in
manufacturing jobs in more recent years between 2011 and 2014 (+169).
In the same period between 2006 and 2014, the top industries with the biggest gains in actual job numbers include Health Care and
Social Assistance (+450 jobs); Construction (+237 jobs); Accommodation and Food Services (+204 jobs); Retail Trade (+194 jobs);
Administrative and support waste management and remediation services (+188 jobs); Information and cultural industry (+164 jobs);
and Finance and insurance (+124 jobs)
The industries which showed the highest levels of relative growth in that same period, include Information & cultural industries
(increase of 76%); Construction (+64%); Public Administration (+48%); Administrative and support waste management and
remediation services (+42%); Finance and insurance (+35%) and Health care and social assistance (+30%).
As noted above there was a very significant decline in manufacturing employment between 2006 and 2014. This is consistent with
broader statistical trends, although the figures shown on the table may not be precise owing to the different employment survey
methodologies. The smaller changes between periods are less likely to be conclusive.
Secondly, the NAICS categories were not designed from a land use perspective, so that a translation of the size of each category or
changes over time into the need for specific land uses (e.g. employment lands, commercial, institutional etc.) is very complex and
will vary between municipalities.
For example, the Finance and Insurance category includes head office functions that would locate in major office buildings; as well
as; a wide array of bank branches; lending outlets; and small scale agencies that would be more likely to locate in retail or smaller
scale commercial outlets. Growth in this category in a small to mid-sized community, such as Orangeville may not translate into a
need for specialised office space, as it may be of the type more appropriately accommodated within retail commercial facilities.
Information and cultural industries includes a wide range of employment types, such as film and recording studios, producers, as
well as, movie theatres, and film festivals. Growth in this type of employment may require large studio space, such as might be
accommodated in employment lands, but would also require a wide range of other types of space, including traditional office space
and home-offices, as well as movie theatres.
16Orangeville Land Needs Assessment and Commercial Market Analysis
Health care and social assistance would include hospitals, clinics, a wide range of social service providers, as well as day-care
centres.
As a result, this data should be used as a general guide to employment trends within the community, but not as a definitive source
to explain land use needs.
Figure 2-7: Employment by Industry: Town of Orangeville (2006, 2011 and 2014) - Graph
3000
2500
2000
Employment (Persons)
1500
1000
500
0
2006 2011 2014
SOURCE: Statistics Canada, Place of Work data (2006 & 2011); and Town of Orangeville, "Orangeville Annual Economic
Development Report 2014" by Town of Orangeville Economic Development/ SBEC, Sector Performance data compiled by
OMAFRA Analyst Data EMSI 2014.3
17Orangeville Land Needs Assessment and Commercial Market Analysis
Figure 2-8: Employment by Industry: Town of Orangeville (2006, 2011 and 2014) - Data
2006 2011 2014 2006 to 2014
Town of
National Change (#) % Change
Industry Orangeville,
Census Household 2006 to Increase/
OMAFRA
Survey 2014 Decrease
Analyst Data
Agriculture, forestry, fishing and hunting 55 60 58 3 5%
Mining, quarrying, and oil and gas extraction 10 - - -10 -100%
Utilities 120 165 154 34 28%
Construction 370 355 607 237 64%
Manufacturing 2,270 1,325 1,494 -776 -34%
Wholesale trade 295 255 245 -50 -17%
Retail trade 2,285 2,425 2,479 194 8%
Transportation and warehousing 165 120 152 -13 -8%
Information and cultural industries 215 230 379 164 76%
Finance and insurance 355 510 479 124 35%
Real estate and rental and leasing 225 190 91 -134 -60%
Professional, scientific and technical services 525 650 535 10 2%
Management of companies and enterprises - - - - 0%
Administrative and support, waste management and
remediation services 450 345 638 188 42%
Educational services 855 810 792 -63 -7%
Health care and social assistance 1,520 1,890 1,970 450 30%
Arts, entertainment and recreation 230 165 151 -79 -34%
Accommodation and food services 1,155 1,165 1,359 204 18%
Other services (except public administration) 790 775 587 -203 -26%
Public administration 365 475 539 174 48%
TOTAL EMPLOYMENT 12,255 11,910 12,709 454 4%
SOURCE: Statistics Canada, Place of Work data (2006 & 2011); and Town of Orangeville, "Orangeville Annual Economic
Development Report 2014" by Town of Orangeville Economic Development/ SBEC, Sector Performance data compiled by
OMAFRA Analyst Data EMSI 2014.3
Industry classification based on North American Industry Classification System (NAICS) 2007
18Orangeville Land Needs Assessment and Commercial Market Analysis
3 Commercial Market Analysis
3.1 COMMERCIAL SUPPLY
Based on recent work conducted by urbanMetrics in 2010, there was approximately 1.3 million square feet of food and non-food
retail space, excluding services, in the Town of Orangeville 2. There was an estimated 235,100 square feet of service space in the
downtown area. Large vacant units at that time included the 31,000 square feet former Sobeys supermarket at Westdale Mall on
Broadway. This space has since re-opened under the FreshCo banner.
The Town’s newest commercial area, the Westside Market Village located on Riddell Road, includes this relocated Sobeys as its
anchor tenant (46,000 square feet). Other big box stores that have developed in the Westside Market Village include the Brick,
LCBO, Dollarama and a number of other retailers. Directly opposite the Westside Market Village is the Westside Business Centre
(50,519 square feet), which is a mixed use plaza anchored by Sears, Fabricland and Anytime Fitness. In 2012, the Town approved
OPA 111 that re-designated the site from Employment Area to Neighbourhood Commercial to permit commercial uses in the
existing building. There are a number of available commercial units in both these new commercial areas. 3
Other notable changes to the commercial market since 2010 include the re-tenanting of the former Zellers, located at Orangeville
Mall, to a HomeSense and SportChek.
Based on a review of the Town of Orangeville’s development applications, there are three key commercial applications of note 4.
2
Peer Review of the September 10, 2010, Retail Market Demand and Impact Analysis, Town of Orangeville, prepared by Tate
Economic Research Inc. (“TER”) on behalf of Southdown Builders (Wesdale) Limited.
3
http://www.blackwoodpartners.com/retail-opportunities/Details/24llage
http://www.blackwoodpartners.com/retail-opportunities/Details/25/westside-business-centre-riddell-road-centennial-road-orangeville-
ontario
4
Town of Orangeville, Current Official Plan and Zoning Amendments and Other Planning Applications, February 2015 (accessed
October 2015).
19Orangeville Land Needs Assessment and Commercial Market Analysis
Figure 3-1: Development Applications with Commercial Space Proposed
Stoneridge Mixed Use
2,000 square feet (Ref# SP 5/10),
0.4 ha - Neighbourhood Commercial
Sobeys planned expansion
10,515 square feet (Ref# SP 5/14),
Not on Designated Vacant Commercial
Riddell Village
17,071 square feet (Ref# SP 4/14),
1.3 ha - Neighbourhood Commercial
SOURCE: urbanMetrics based on development application information provided by the Town of Orangeville.
20Orangeville Land Needs Assessment and Commercial Market Analysis
The proposed Riddell Village, located at Riddell Road and Spencer Avenue includes approximately 17,071 square feet of
commercial space and is expected to include three restaurants, a pharmacy, a gas station, a convenience retail building and two
commercial units 5. The proposed development has been approved through settlement at the OMB.
The second application of note includes the expansion of the existing Sobeys by approximately 10,000 square feet.
A third application relates to a four-storey mixed use building on Broadway by Stoneridge Holdings that includes two commercial
units (approximately 2,000 square feet in total) and forty -three apartment units.
We are also aware that the Town recently refused a proposed development at the South West Corner of C Line & Alder Street by
2203256 Ontario Ltd. Leaders Group. The applicants sought an Official Plan Amendment and re-zoning to allow a mixed use
development (from Neighbourhood Commercial to Neighbourhood Mixed Use). The application is currently under appeal to the
Ontario Municipal Board. The site has existing permission for a 30,000 square feet commercial plaza. The current applicants are
seeking a re-designation of the site to include residential uses and less than 4,000 square feet of commercial space, reasoning that
that the commercial facility is not economically feasible for the property 6. We have excluded the site from consideration in terms of
planned commercial space given the uncertainty regarding the future development concept for this site.
Based on the above therefore, there is approximately 29,600 square feet (rounded) of commercial space in the development
pipeline.
We also note that there are Employment Lands located in the north-west of the Town in an area referred to as Veteran’s Way South
Community that are subject to a Specific Area Policy in the Town of Orangeville Official Plan which includes a provision for
commercial facilities to serve the immediate residential community and planned Humber College campus (Policy E8.64). For the
purposes of this study, the lands are considered part of the vacant employment land inventory. However, we recognise that these
lands may also accommodate future commercial space.
3.2 COMMERCIAL DEMAND
For selected retail and service categories, a per capita space analysis has been undertaken. This approach applies typical space
per capita ratios to the forecast population growth to estimate future market need (i.e. the addition of 6,950 persons) recognizing
that typical space needs requirements are usually in the 40± square feet per capita range.
5
http://www.orangeville.ca/documents/2015/08/10/august-10-2015-council-news
6
Based on Report PL-2014-36, Town of Orangeville, Council Meeting Agenda, December 8, 2014
21Orangeville Land Needs Assessment and Commercial Market Analysis
The following summarizes the methodology and assumptions utilized in our analysis, which is detailed in Figure 3-2:
Column A:
Based on our experience in other similar sized Ontario markets, as well as our review of the existing retail/service supply situation in
Orangeville, we have estimated new residents’ space per capita space requirements for each retail and service category.
Column B:
The space per capita ratios are applied to the anticipated population to provide an estimate of the total space required by new
residents. This space would include locations both within Orangeville and elsewhere (i.e. Brampton and Caledon).
Column C:
Target local shares, or the percentage of space that could be supported locally in Orangeville by new residents have been
estimated for food store retailers (FSR), non-food store retailers (NFSR), and a range of se3rvice establishments. We have not
included department stores or building/ out-door supply stores in our calculations recognizing that certain population thresholds are
required to support store types of this type and scale.
The Orangeville shares have been varied by category. For local serving retail and services (e.g. supermarkets, convenience food,
health care, personal services), a higher target local share has been utilized, with lower target shares for comparison goods (e.g.
general merchandise, apparel, home furnishings) and services which could be served regionally.
Column D:
The target local shares have been applied to the square feet that could be supported by Study Area residents in Orangeville to
calculate the supportable space locally by new residents
Column E:
In Column E, we have estimated inflow factors. The inflow factors generally reflect what could be achieved on the subject site and
assume that some sales would be derived from elsewhere due to the location of the site on Highway 10, a major route through this
area of Ontario.
Column F:
An estimate of the total space that could be supported in Orangeville, including inflow from outside residents, has been calculated in
Column F. The resulting figures indicate the amount of additional retail and service space would be warranted in Orangeville to
build out.
22Orangeville Land Needs Assessment and Commercial Market Analysis
Figure 3-2: Per Capita Space Analysis (Square Feet)
Total Demand
Orangeville for Space in
Orangeville Total Space Space Orangeville
Residents Per Required by Target Trade Supported by by Future
Capita Space Future New Area Future New New
Requirements Orangeville Capture Orangeville Residents
Category (1 Residents Rate Residents Inflow (rounded)
Study Area A B C D E F
Population Growth to Build Out 6,950 (A X Pop'n) (B X C) D/(1-E)
FOOD STORE RETAIL (FSR)
FSR: Convenience & Specialty Food 1.2 8,340 90.0% 7,506 20% 9,400
FSR: Supermarket & Grocery 3.8 26,410 90.0% 23,769 20% 29,700
SUB TOTAL 5.0 34,750 90.0% 31,275 39,100
NON FOOD STORE RETAIL (NFSR)
NFSR: Department Store 5.0 34,750 0.0% 0 20% 0
NFSR: Other General Merchandise (e.g. Canadian Tire) 1.5 10,425 80.0% 8,340 20% 10,400
NFSR: Building & Outdoor Supply Stores 3.0 20,850 0.0% 0 20% 0
NFSR: Health and Personal Care Stores 1.5 10,425 80.0% 8,340 20% 10,400
NFSR: Clothing & Accessories Stores 2.0 13,900 50.0% 6,950 20% 8,700
NFSR: Furniture, Home Furnishings & Electronics Stores 3.0 20,850 50.0% 10,425 20% 13,000
NFSR: Selected Automotive 0.5 3,475 75.0% 2,606 20% 3,300
NFSR: Other (Sporting Goods, Hobby stores etc.) 4.5 31,275 60.0% 18,765 20% 23,500
SUB TOTAL 21 145,950 38.0% 55,426 69,300
Continued….
23Orangeville Land Needs Assessment and Commercial Market Analysis
Figure 3-3: Per Capita Space Analysis continued (Square Feet)
Total Demand
Orangeville for Space in
Orangeville Total Space Space Orangeville
Residents Per Required by Target Trade Supported by by Future
Capita Space Future New Area Future New New
Requirements Orangeville Capture Orangeville Residents
Category (1 Residents Rate Residents Inflow (rounded)
Study Area A B C D E F
Population Growth to Build Out 6,950 (A X Pop'n) (B X C) D/(1-E)
OTHER RETAIL
Other: Liquor / Beer / Wine 0.5 3,475 85.0% 2,954 20% 3,700
SUB TOTAL 0.5 3,475 85.0% 2,954 3,700
SERVICES
Services: Financial Services (including banks & other financial) 1.0 6,950 75.0% 5,213 20% 6,500
Services: Eating & Drinking Establishments 3.5 24,325 75.0% 18,244 40% 30,400
Services: Personal Care Services 1.5 10,425 90.0% 9,383 10% 10,400
Services: Entertainment & Fitness Establishments 3.0 20,850 80.0% 16,680 10% 18,500
Services: Other Services (e.g. auto-repair, educational services) 2.5 17,375 70.0% 12,163 20% 15,200
Services: Insurance and Real Estate Services 0.8 5,560 70.0% 3,892 20% 4,900
Services: Health Care Services 1.5 10,425 75.0% 7,819 20% 9,800
Services: Professional, Scientific & Technical Services 0.8 5,560 75.0% 4,170 20% 5,200
TOTAL 15 101,470 76.4% 77,562 100,900
GRAND TOTAL 41 285,645 58.5% 167,217 27.4% 213,000
SOURCE: urbanMetrics inc.
1) urbanMetrics inc. estimates based on our market experience and existing service levels in Orangeville. Rounded to the nearest
100.
24Orangeville Land Needs Assessment and Commercial Market Analysis
As indicated in Figure 3-2 and Figure 3-3, based on future population growth and our target shares and inflow factors, additional
retail and service space will be required in Orangeville in future years. By total build out, an estimated 213,000 square feet of
additional retail and service space could be accommodated in Orangeville.
3.3 RECONCILIATION OF SUPPLY & DEMAND – COMMERCIAL SPACE
Based on the results of our per capita space analysis, it is estimated that there is market demand for 213,000 square feet of
commercial space in Orangeville. To determine what this means in terms of demand for commercial lands, we must first consider
what factors are influencing the supply of commercial space and how this impacts the overall demand for space.
Based on the review of development applications in Section 3.1, we conservatively estimated that there is the potential to develop
29,600 square feet of commercial space in the near future (potentially more pending the outcome of the appeal on lands located
at C Line & Alder Street). The 231,000 square feet warranted commercial space, less this 29,600 square feet of commercial space
proposed in the development application pipeline results in a net demand for approximately 183,400 square feet of additional
commercial space.
3.4 RECONCILIATION OF SUPPLY & DEMAND – COMMERCIAL LANDS
In estimating the amount of commercial land that would be required to facilitate 183,400 square feet, we have applied a lot
coverage estimate.
Based on a conservative lot coverage rate of 25% lot coverage, we estimate that 6.8 hectares of commercial land would be
required to accommodate 183,400 square feet (and serve the needs of an additional 6,950 persons in Orangeville). We recognise
that the demand for commercial lands could be less than this if higher lot coverage rates were to be achieved, through mixed use
development.
Based on the vacant land inventory prepared by the Town of Orangeville and MHBC, there are 14.6 hectares of vacant commercial
lands in Orangeville (MHBC Land Needs Assessment, Town of Orangeville, 2016, Table 10). Excluding the lands subject to
development applications reviewed in Section 3.1 - Commercial Supply, the remaining supply of vacant commercial lands is 11.9
hectares.
As the additional population will only require an estimated 6.8 hectares of vacant commercial land to accommodate their future
commercial needs, this suggests an over-supply of commercial lands amounting to 5.1 hectares. This over-supply could in fact be
even greater given that the existing commercial uses in the Town can be expected to accommodate a portion of these needs within
the community and particularly those that are convenience and local serving uses. Additionally, some of the space needs could also
25Orangeville Land Needs Assessment and Commercial Market Analysis
be accommodated in existing vacant units in Orangeville such as at the new commercial centres described in Section 3.1, as well
as opportunity for some commercial uses on the Employment Lands in the Veteran’s Way South Community.
Overall therefore, there is a sufficient supply of designated commercial lands to meet the projected demand from new population.
The vacant Commercial Land inventory shows a wide range of commercial designated sites within the Town to suit the market
needs of new retailers. In terms of serving the local needs of new residents, a review of the designated vacant neighbourhood
commercial sites in the Town show that these sites are located close to developing residential areas and are expected to serve the
needs of new residents.
3.5 COMPARISON WITH MHBC COMMERCIAL LAND USE PROJECTIONS
It is important to note that this 6.8 ha of commercial land use demand relates to traditional retail and service uses commonly found
in urban commercial areas i.e. in shopping centres, plazas and downtown commercial cores. The MHBC Study, conducted on the
basis of targeting 1 job for each two persons, establishes a target number of “Commercial Employment” jobs which we have
summarised previously in Figure 2-4.
Based on the targeted 1,043 Commercial Employment jobs, the MHBC Study suggests that this would result in demand for 22.5 ha
of commercial land, which is notably higher than the demand for 6.8 ha projected by our market analysis. (Please refer to MHBC
Study, Table 12: Overview of ICI Land Demand and Land Supply in Orangeville).
However, the two definitions of commercial in this instance differ significantly as the types and range of jobs categorised as
Commercial Employment are much wider than the types of retail uses considered in a typical market analysis. For example,
Commercial Employment include jobs associated with accommodations (i.e. hotels/ motels), a broad range of arts, entertainment
and recreational facilities (i.e. golf courses, museums, recreation facilities), establishments such as funeral homes, places of
worship and institutions as well as jobs such as domestic servants/ maids among many others. The resulting demand for
commercial land use based on an employment target approach will be much higher than the retail market analysis as it includes a
much broader range of jobs/ land uses.
It is also important to recognise that the retail and services space market projections conducted by us are directly related to the
needs of the future population. For the most part, the other uses in the Commercial Employment analysed by MHBC are associated
with very different demand characteristics (such as golf courses, funeral homes and cemeteries, recreation and entertainment,
professional and community organisations, accommodations etc.) and would be more sporadic in terms of development phasing
and timing. The MHBC target of 22.6 hectares would include both retail and these other uses. For this reason, the market based
demand projection of 6.8 ha of commercial land to serve the projected population increase of 6,950 persons is considered to be the
most appropriate methodology in assessing the future designated retail commercial land needs.
26Orangeville Land Needs Assessment and Commercial Market Analysis
4 Issue #1: Commercial/ Retail Development vs Employment
Development
The Town has asked for our recommendations with respect to the benefits of commercial/retail development relative to more
traditional employment development. As shown in Figure 4-2, “Retail Trade” is now the second largest industry in Canada in terms
of employment (second to Health Care and Social Assistance). Therefore, retail employment represents a key opportunity to
provide significant employment opportunities to meet the needs of the growing Town’s population base. A retail building typically
provides 3 to 5 times as many jobs as the same sized industrial building. It also provides important socio-economic benefits such as
a gateway to the workforce for youths as well as flexible employment for older adults. The retail trade industry also acts as an
incubator for small businesses.
In Section 2.3, we reviewed the employment trends within each NAICS category for the Town of Orangeville based on available
data (Figure 2-7). One of the categories that showed significant recent job growth is "Retail Trade”. Other categories with high
growth rates were Health Care and Social Assistance; Accommodation and Food Services; Administrative and support waste
management and remediation services; Information and cultural industry; and Finance and insurance. Many of these other growing
industries can be accommodated in retail commercial structures. Commercial structures that house retail facilities, e.g. shopping
centres, plazas, street front units, etc. are both very flexible in the type of employment that they can maintain and very adaptable to
changing demand patterns.
Although in most commercial structures, “Retail Trade” is the most common NAICS code among businesses, it is very common that
for many commercial structures to house businesses in a broad range of NAICS categories. For example,
• Finance and Insurance (e.g. banks, financial advisory offices);
• Information and Cultural Industries (e.g. cinemas, cell phone outlets)
• Real Estate and Real Estate Leasing (e.g. real estate offices, mall management offices)
• Educational services (e.g. commercial schools, learning and language centres)
• Health and social assistance (e.g. doctors/dentist offices, day care centres)
• Accommodation and food services (restaurants, fast food outlets)
• Other services (e.g. dry cleaners, hair salons)
• Public administration (e.g. government service centres, libraries)
27Orangeville Land Needs Assessment and Commercial Market Analysis
• Administrative and Support, Waste Management and Remediation (e.g. travel agencies, employment centres)
• Professional, Scientific and Technical Services (e.g. tax preparation offices, veterinary clinics)
Many of these non-retail uses require street front access to serve their clientele and would commonly locate in retail commercial
buildings.
It is also important to note that many retail facilities have the ability to be transitioned to other uses as economic conditions
changed. Large retail vacant units, for example, are now being converted to call centres, government and community offices, public
libraries, schools, courthouses, and medical centres.
Notwithstanding this, industrial development will continue to be important to the town in terms of accommodating a range of
employment generating uses, such as manufacturing and distribution facilities, as well as other uses that are not appropriate for
commercial lands. However, we caution that over-designating employment lands is a financial risk when traditional employment
sectors are in decline, and could result in the loss of tax and development charge revenues from more readily marketable uses.
Furthermore, the employment data presented in Figure 2-7 suggests a reduction in the Town’s manufacturing/warehousing
employment which implies a reduced need for facilities and land to accommodate these types of jobs. This reduction of 776
manufacturing jobs between 2006 and 2014 indicates that the existing manufacturing operations are likely operating with reduced
staffing levels. As a result, there may be excess capacity within the existing structures/ buildings as manufacturing uses operate on
reduced staff levels. A portion of the future growth in the traditional employment sectors may therefore be accommodated in existing
employment areas and buildings, as may not necessarily require significant new built space.
Overall, based on the significant role that retail can play in accommodating employment opportunities, the Town of Orangeville
should encourage the benefits of supporting commercial/ retail development uses as legitimate employment generators.
28Orangeville Land Needs Assessment and Commercial Market Analysis
Figure 4-1: Employment by Industry (2014)
SOURCE: Staistics Canada
29Orangeville Land Needs Assessment and Commercial Market Analysis
5 Issue #2: Vacant Employment Corridors
As shown in the land needs analysis prepared in the MHBC Study, a total of Figure 5-1: Vacant Employment Corridors
67.7 hectares of vacant employment lands have been identified within the
Town. Of these lands, 46.8 hectares are located outside of the built boundary.
These vacant lands are mostly concentrated in the north-west of the Town in
vacant corridors along both existing and planned roadways. As a result, the
Town has requested that we provide market and economic recommendations
in terms of types of employment uses for the currently vacant employment
corridors (i.e. Hansen Boulevard, Veterans’ Way, Parkinson Crescent).
b
5.1 CORRIDOR DESCRIPTION
There are eight parcels of vacant employment lands measuring between 0.36
hectares and 27.3 hectares all of which are privately owned, totalling 45.7
hectares. The lands are located in the north-west of the Town. The sites are
accessed via County Road 16 (a local road) which provides access primarily c
Humber
to the northerly and southerly parcels. The south parcels located south of Lands
Parkinson Crescent adjoin the decommissioned CN rail line. b
The lands are located on the opposite side of the Town to Highway 10, and
d
Future
are also located away from any major 400 Series highway which limits their Estate
exposure and restricts accessibility from a regional perspective. The GTA
West Corridor project (connecting Highway 401 to Highway 410), was planned
for a route 28km south of the Town via Highway 10, along the southern parts
of the Town of Caledon and the northern parts of the City of Brampton. In
December 2015, the Province suspended work on the corridor with an update
due in Spring 2016. Based on the planned location of the corridor away from a
Highway 10, should the GTA West corridor proceed it will not significantly
improve the overall connectivity and accessibility of the vacant land corridor. © OpenStreetMap contributors
The large parcel of employment land in the north-west, located at the south- SOURCE: urbanMetrics inc.
east corner of the County Road 16 and the Municipal boundary, is also a
30Orangeville Land Needs Assessment and Commercial Market Analysis
brownfield site and once operated as a gravel pit. As a result, it will require significant investment to redevelop and service.
All other vacant lands are located internally without frontage to County Road 16. These sites will have future access and frontage to
the planned Hansen Boulevard extension. We understand that servicing is available for these lands in the future. These internal
sites are also located adjacent to residential designated lands which are developing. The Humber Lands are located close to a large
number of the vacant employment parcels, although the Humber Lands are separated by Open Space Conservation lands.
County Road 16 also forms the municipal boundary between the Town of Orangeville and the Township of Amaranth. The
Township has designated greenbelt lands and planned estate residential west of County Road 16. The Township has also
designated Employment Areas further west along County Road 109 (Broadway). There are approximately 116.5 ha of lands
designated Employment owned by Blackwood Development in the Township of Amaranth and there is an additional 30 ha of
employment lands in Amaranth and 34 ha in East Garafraxa within a 1km of Orangeville’s boundary.
5.2 LAND USE DESIGNATION
The lands are designated as Employment Area and are located in the Greenfield. The Employment Area designation permits the
following primary uses:
• Industrial facilities including manufacturing, assembling, processing, fabricating, refining, repairing, warehousing, and
wholesaling, offices, transportation and communication uses, research and information processing facilities, recreational
uses and accessory uses (Section E3.2 of the Town of Orangeville Official Plan)
Other secondary permitted uses which are subject to various conditions, include:
• accessory retail
• limited service commercial to support employment uses (e.g restaurants, print shops, computer service facilities,
business/computer supply and service establishments);
• limited industrial/commercial uses including automotive uses, building contractor’s yards, and lumber yards
• day care facilities which do not have an outdoor play area
• residential dwelling units required for essential operational personnel
• adult entertainment parlours in free standing structures
• hotels or motels, including supporting conference and restaurant facilities that are located on the same property as the hotel
or motel, subject to the property being located adjacent to an arterial road
(Section E3.3 of the Town of Orangeville Official Plan)
31You can also read