2020 NONPROFIT EMPLOYMENT REPORT - Johns Hopkins Center ...
←
→
Page content transcription
If your browser does not render page correctly, please read the page content below
Johns Hopkins Center for Civil Society Studies
JOHNS HOPKINS NONPROFIT ECONOMIC DATA PROJECT

                                                                             2020 NONPROFIT
                                                                                EMPLOYMENT
                                                                                     REPORT

                                                                                                  Lester M. Salamon and
                                                                                                  Chelsea L. Newhouse
                                                June 2020
                                                                                                  with the technical assistance of
                                                Nonprofit Economic Data Bulletin no. 48           S. Wojciech Sokolowski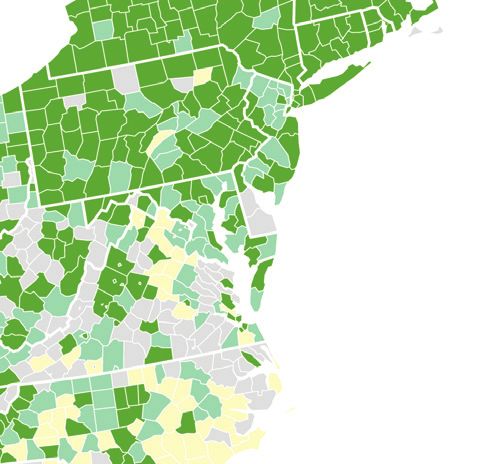
l   l   l    l    l   l    l    l    l   l    l    l   The 2020 Nonprofit Employment Report                 l    l   l    l    l    l    l   l    l    l    l   l

                  The 2020
        Nonprofit Employment Report
                                               Nonprofit Economic Bulletin no. 48 • June 2020

                                Lester M. Salamon and Chelsea L. Newhouse
                                                            with the technical assistance of
                                                           S. Wojciech Sokolowski

                                            Suggested citation:
     Lester M. Salamon and Chelsea L. Newhouse, “The 2020 Nonprofit Employment Report,” Nonprofit
    Economic Data Bulletin no. 48. (Baltimore: Johns Hopkins Center for Civil Society Studies, June 2020).
                                          Available at ccss.jhu.edu.

        The authors wish to express their appreciation to the Charles Stewart Mott Foundation whose support made this report
        possible. The findings and interpretations reported here are those of the authors only, however, and may or may not be
         consistent with those of any entities with which the authors are affiliated or that have assisted or supported the work.

                                                            © Lester M. Salamon, 2020
                 This work is licensed under a Creative Commons Attribution-NonCommercial-NoDerivatives 4.0 International License.

    Cover image: Nonprofit share of private employment by Metro Statistical Area, 2017. Green=above national average of 10.2%; Yellow=below national average.

                               Salamon and Newhouse              •    Nonprofit Economic Bulletin #48                •     page i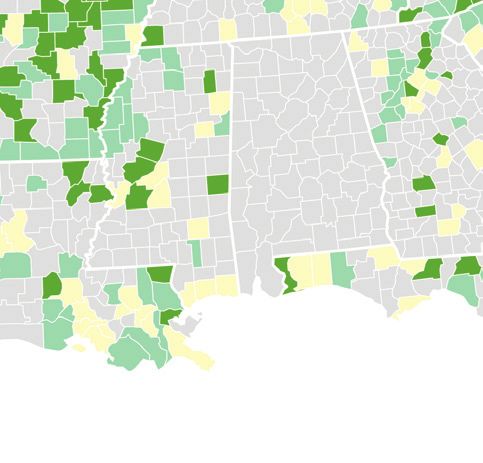
l   l    l    l    l    l   l    l    l    l    l    l   The 2020 Nonprofit Employment Report                  l   l    l    l    l    l    l    l   l    l    l    l

                                                    l    PREFACE l
This report is part of an on-going series that examines employment and wages in private, nonprofit
establishments1 in the United States. While our Center has been producing these reports for nearly 20 years,
this year’s report, like this year itself, is unique for several reasons.

As we began work on this report, the 2020 COVID-19 pandemic was just beginning to show its initial effects
around the world, and the resulting nation-wide economic and social impacts in the United States were still
only partially visible. However, as the pandemic reached the United States, it became clear that efforts to slow
its spread would have profound impacts on all aspects of our lives, and not least of all on the nonprofit sector.
But as is too often the case, these effects seemed especially likely to be ignored in the rush of attention to the
other sectors impacted by the pandemic. This not only made this year’s report especially important in order to
establish the most recent baseline of information possible against which to chart the virus’s impact, but also,
it induced us to go beyond our normal practice of reporting only on past developments by seeking information
that would allow us to make meaningful estimates of the impact of current developments, and current policy
responses, on this crucial sector in something approaching real time.

Accordingly, this report seeks to shed light on two aspects of the current nonprofit employment scene: first, the
pre-COVID-19 nonprofit workforce realities as they are visible in the unusual body of data we have succeeded
in tapping on U.S. nonprofit employment dynamics; and second, estimates of the scale of impacts on nonprofit
employment of both the enormous economic and social changes unleashed by the COVID-19 pandemic, and
the ability of nonprofit organizations to gain access to the policy measures put in place to shield American
society from this impact, as both of these are visible as of June 2020 when this report went to press.

In both respects, the data presented here can be of crucial importance to sector leaders, government
policymakers, the media, and citizens at large in comprehending the vital role that the nonprofit sector plays
in the social and economic well-being of the nation, the way in which COVID-19 is impacting this sector, and
the challenges that nonprofits have encountered in gaining access to the financial support that government
policy has theoretically opened up to the hundreds of thousands of nonprofit organizations and millions of
nonprofit employees that qualify as “small businesses” under the recent federal programs of assistance to such
organizations.

Also contributing to the special importance of this 2020 Johns Hopkins Nonprofit Employment Report is that
this report is the last to reflect directly the handiwork of our long-time colleague and friend, Dr. S. Wojciech
Sokolowski, who passed away on May 3, 2020 following a long illness, as this report neared completion.
Wojciech played a fundamentally central role in the Nonprofit Economic Data Project. His statistical
expertise, creative approach, and collaborative spirit were pivotal to developing and refining the methodology
used to identify nonprofits in the existing governmental data system on which this and previous reports
relied, and future reports will also make ample use of. This has opened a unique body of data on nonprofit
employment that is far more reliable, comprehensive, and detailed than any previously or presently available,
making it possible for the first time to get a clear view of the economic impact of nonprofit organizations locally
and nationally, and to compare them to other industries in a systematic and reliable way. The resulting body
of data has been crucial for nonprofit leaders nationally and locally to represent this important sector in policy
discussion, in the media, and to the public at large, making clear not just the social impact of this sector, but
also its economic impact in towns and communities throughout the nation. It is with gratitude and heavy
hearts that we therefore dedicate this 2020 Johns Hopkins Nonprofit Employment Report to him.

1
 For the purpose of this report, “nonprofit establishments” are defined as entities exempted from income taxation under Section 501(c)(3) of the Internal Revenue Code
(IRC). Included are private, nonprofit hospitals, higher education institutions, day care centers, nursing homes, social service agencies, museums, orchestras and
other cultural institutions, environmental organizations, advocacy groups, clinics, and other similar organizations.

                                Salamon and Newhouse               •     Nonprofit Economic Bulletin #48                •     page 1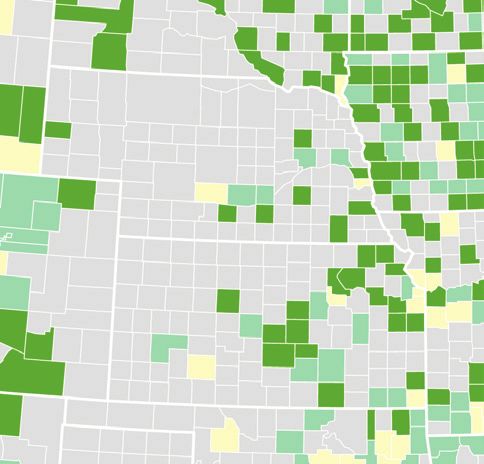
l   l    l    l    l   l    l    l    l    l   l    l   The 2020 Nonprofit Employment Report                 l    l    l   l    l    l    l   l    l    l    l     l

                            l        INTRODUCTION l
This report presents the latest-available data on nonprofit employment and wages generated by the U.S.
Bureau of Labor Statistics from the Quarterly Census of Employment and Wages using a technique first
developed by the Johns Hopkins Center for Civil Society Studies. QCEW is an administrative dataset collected
by states as a part of the federal Unemployment Insurance (UI) program and draws on the quarterly surveys
of workplaces that state employment security offices have conducted since the 1930s. Under federal law, all
nonprofit places of employment with four or more employees are required to participate in the unemployment
insurance system. However, 22 states also extend this requirement to places of employment with one or more
employees. Although the program does not cover self-employed and family workers, QCEW data encompass
approximately 97% of non-farm employment, providing a virtual census of employees and their wages as well
as the most complete universe of employment and wage data, by industry, at the State, regional, and county
levels.

The QCEW database has several advantages over alternative record systems available to track nonprofit
employment. Primary among these are: (a) nearly complete coverage of all nonprofit establishments in the
U.S.; (b) the use of the establishment, instead of the organization, as the unit of observation, which allows
pinpointing the exact geographic location of the workers instead of attributing all of them to the home office of
the parent organization; (c) use of the standard classification of organizations by field of activity used for other
economic sectors, making possible comparisons with other economic sectors such as for-profit businesses in
terms of the number of people employed, the economic field, and the average wages paid, by state, county,
and metro area; and (d) professional management by highly competent statistical experts in the U.S. Bureau
of Labor Statistics. (See Appendix B for additional detail about the QCEW and the methodology used for this
report).

Since the BLS unfortunately does not routinely separate QCEW data on nonprofit organizations from
data on private business enterprises but rather merges such data with data on for-profit enterprises into a
conglomerate identified only as “private employment,” the scale of the nation’s nonprofit workforce and how it
is distributed across the country or among the numerous activity areas has been historically obscured even
though such data have long been present in BLS computers. To correct this problem and bring the scale of
nonprofit employment into clear view for the first time, the Johns Hopkins Center for Civil Society Studies (JHU/
CCSS) found a way to identify nonprofit establishments in the BLS data system and extract data on nonprofit
employment from the BLS files. Through a special research arrangement, BLS granted JHU/CCSS researchers
access to these data to apply this method on several occasion in the 1990s and into the 2000s, and ultimately
took on the task of applying this methodology and creating special nonprofit data runs itself, but only on a
once-every-five-years basis beginning in 2012. The present report draws on the most recent BLS such data,
which cover the year 20172 and the intervening years between 2007 and 2017. We are deeply grateful to the
Charles Stewart Mott Foundation, which provided the financial support that made the development of this
special extraction methodology possible; and to David Talan, Kevin Cooksey, and their colleagues at the
Bureau of Labor Statistics, who carried out the tabulation.

2
 U.S. Bureau of Labor Statistics. (2019). “Nonprofit Data Files, 2017 Annual Averages.” (Washington, DC: Bureau of Labor Statistics). Available at: bls.gov/bdm/
nonprofits/nonprofits.htm.

                                Salamon and Newhouse             •     Nonprofit Economic Bulletin #48                •     page 2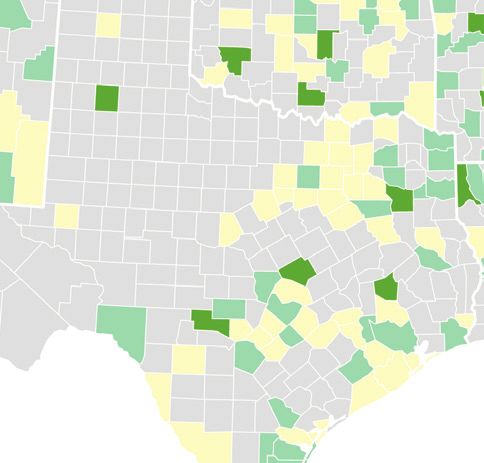
l   l   l   l   l   l   l    l   l   l   l   l   The 2020 Nonprofit Employment Report   l     l   l   l   l    l   l   l   l   l   l   l

The balance of this report falls into three major parts. Part I examines five key findings emerging from the
BLS data on nonprofit employment for 2017 and the years 2007 to 2016 that preceded it. In particular, it puts
the nonprofit paid workforce into context in terms of other major industries in the U.S. economy, shows the
even more substantial role this sector plays in the fields in which it is most active, documents the nonprofit
contribution to job growth, provides evidence on the nonprofit role as a generator of payroll income and hence
of tax revenue, and rebuts the widespread assumption that nonprofit wages lag behind those of the for-profit
sector. In the process, the data demonstrate that, side by side with their considerable social contributions,
U.S. nonprofit organizations comprise a far more sizable and dynamic economic force in this country than is
commonly appreciated.

Against this backdrop, Part II of this report provides a first approximation of the extent of job losses that
nonprofit organizations may have suffered through May of 2020, the first three months of the current COVID-19
crisis. In addition, it documents the extent to which this sector is made up of firms that should be benefiting
from the recently enacted federal government Payroll Protection Program by virtue of having fewer than 500
employees and thus qualifying as “small businesses.”

A final section then summarizes the implications of these various findings.

                            Salamon and Newhouse        •   Nonprofit Economic Bulletin #48       •   page 3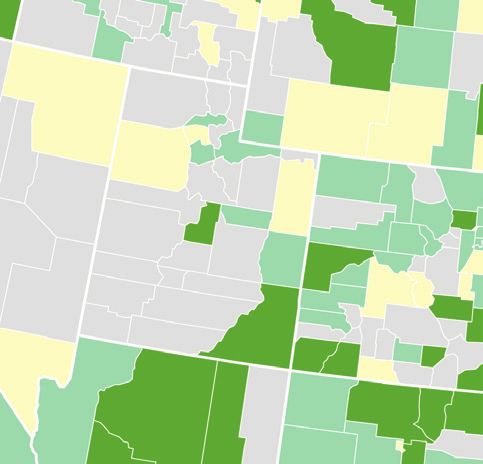
l l l l l l l l l l l l The 2020 Nonprofit Employment Report l l l l l l l l l l l l
l
PART I l
Key Findings: Nonprofit Employment—
A Mighty Economic Force
America’s Third Largest Workforce
Although the nonprofit sector is not itself an “industry,” but rather a distinctive set of institutions that operates
in various different industries—such as health, education, and social services—it is nevertheless instructive to
compare the scale of its workforce to that of the country’s five largest industries. When this is done, as shown
in FIGURE 1, a surprising conclusion emerges: as of 2017, the most recent year on which data are available,
U.S. nonprofits employed the third largest workforce of any U.S. industry, behind only retail trade and
accommodation and food service, but well ahead of all branches of manufacturing. In particular, with 12.5
million paid workers, nonprofits thus employed:
è More than twice as many workers as the nation’s finance and insurance industry.
è 81% more workers than the nation’s construction industry.
è Nearly 100,000 more workers than the nation’s manufacturing industry.
è Within 8% as many workers as the restaurant and hotel industry.
è And nearly 80% as many workers as the U.S. retail trade industry.
FIGURE 1 • Employment in nonprofits vs. private employment in key industries, 2017
15,760,970
Retail trade
13,568,696
Accommodation & food services
12,488,563
NONPROFIT SECTOR
12,399,293
Manufacturing
6,909,837
Construction
5,864,975
Finance & insurance
Total private employees
Salamon and Newhouse • Nonprofit Economic Bulletin #48 • page 4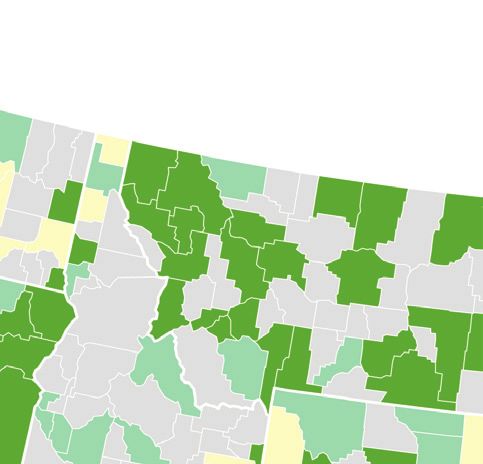
l   l   l   l   l   l   l    l   l   l   l   l   The 2020 Nonprofit Employment Report            l   l    l   l    l      l   l   l   l   l    l     l

Because the manufacturing
sector is often seen as a
                                                               FIGURE 2 • Nonprofit employment as a percent of
bellwether for the health and
                                                              manufacturing employment, by state and territory, 2017
vitality of a region’s economy,
it is especially revealing                         U.S. National                   101%
to note that nonprofits                                  Hawaii                                                                               434%
employ more workers than                              New York                                                            316%
                                                       Montana                                                     280%
manufacturing in over half                             Maryland                                                 262%
(28) of the country’s states                              Alaska                                                261%
and territories, including states                  Virgin Islands                                           229%
as diverse as Pennsylvania,                       Massachusetts                                            225%
Massachusetts, West Virginia,                      North Dakota                                           223%
                                                    New Mexico                                        197%
and Minnesota, as shown                                   Maine                                    182%
in FIGURE 2. In a further 4                            Delaware                                  175%
states, nonprofits represent                       Rhode Island                                 171%
over 85% of total manufacturing                    West Virginia                               167%
employment.                                             Vermont                                166%
                                                         Florida                            147%
                                                    Pennsylvania                           144%
For further detail on the scale                      New Jersey                          136%
of nonprofit employment in the                      Connecticut                         132%
states, see APPENDIX A.                                Wyoming                          132%
                                                 New Hampshire                         124%
                                                         Virginia                     122%
                                                   South Dakota                      120%
                                                         Arizona                     119%
                                                       Colorado                     116%
                                                      Minnesota                     115%
                                                         Oregon                   103%
                                                          Illinois                102%
                                                        Missouri                  100%
                                                      Louisiana                  97%
                                                                                                                              Over 100%
                                                    Washington                   96%
                                                       Nebraska                 88%
                                                                                                                              85%-99%
                                                      California                88%
                                                            Ohio               83%                                            Under 85%
                                                         Georgia             70%
                                                            Iowa             69%
                                                         Nevada              68%
                                                      Oklahoma              67%
                                                 North Carolina             66%
                                                       Michigan             65%
                                                    Puerto Rico             63%
                                                            Utah            63%
                                                      Wisconsin             63%
                                                           Idaho            62%
                                                       Kentucky             62%
                                                           Texas           61%
                                                        Arkansas           60%
                                                      Tennessee            58%
                                                         Kansas            58%
                                                         Indiana          50%
                                                     Mississippi        40%
                                                  South Carolina        39%
                                                        Alabama        30%
                                                                     Nonprofit employment as percent of manufacturing employment

                            Salamon and Newhouse          •     Nonprofit Economic Bulletin #48          •     page 5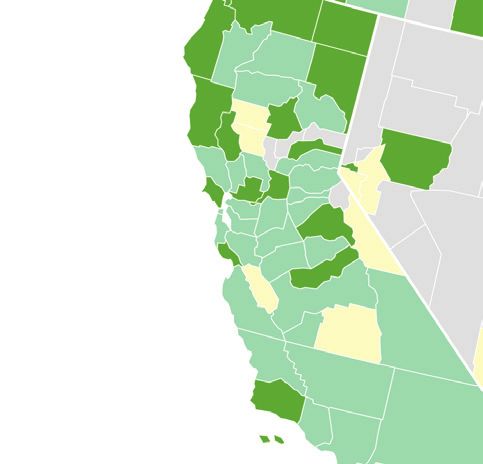
l l l l l l l l l l l l The 2020 Nonprofit Employment Report l l l l l l l l l l l l
An Even Larger Share of Private Employment
in Fields in which Nonprofits Are Active
Although nonprofits are present in many fields that are not commonly thought of as being amenable to the
nonprofit model—such as construction, manufacturing, and accommodations—they tend to concentrate
in a relative handful of primary fields—particularly health care, education, social assistance, and arts and
recreation. And in these fields, nonprofits constitute an especially large share of private employment. Thus, as
FIGURE 3 shows, nonprofits accounted in 2017 for:
è Nearly three quarters (71%) of the nation’s private employment in education,
including 84% of private elementary and secondary education employment and 92%
of private higher education employment.
è Over 41% of private employment in social assistance, including child day care, and
individual and family services.
è Over 43% of private employment in health services, including:
l 84% of private employment in hospitals;3
l Over a third of private employment in nursing homes; and
l Nearly 20% of private employment in ambulatory health care.4
è Nearly 60% of private employment in religious, civic, and professional
organizations.
è And 15.5% of private employment in arts and recreation, with considerably higher
shares of symphonies and museums.
FIGURE 3 • Nonprofit share of private employment, by selected industry, 2017
EDUCATION 70.9%
Elementary & secondary 91.6%
Higher education 84.3%
HEALTH CARE 43.4%
Hospitals 83.8%
Nursing homes 35.2%
Ambulatory health 19.3%
ASSOCIATIONS* 59.8%
SOCIAL ASSISTANCE 41.1%
ARTS & RECREATION 15.5%
Nonprofit share of private employment
*Includes religious, grantmaking, civic, professional, and similar organizations.
3
When public hospitals are included as well, nonprofits account for 66% of total hospital employment.
4
This figure likely understates the nonprofit role in this field because it compares nonprofit employment in what are mostly clinics and home health providers to for-
profit employment that includes all offices of private doctors and dentists.
Salamon and Newhouse • Nonprofit Economic Bulletin #48 • page 6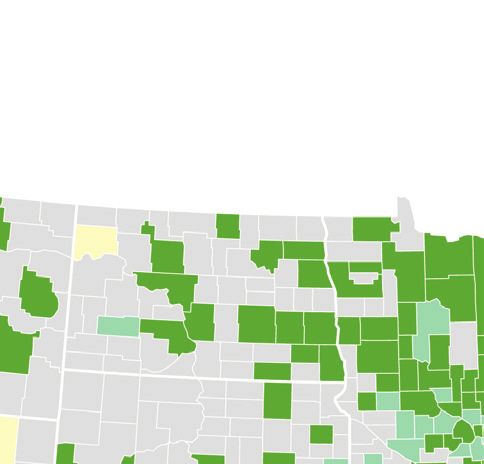
l l l l l l l l l l l l The 2020 Nonprofit Employment Report l l l l l l l l l l l l
A Major Generator of Income and Tax Revenue
Nonprofits paid over $670 billion in wages nationwide in 2017. As shown in FIGURE 4, this makes
the nonprofit sector the third largest generator of payroll income in the United States, behind only
professional and technical services and manufacturing. Retail trade, which employs the most workers in the
country, as shown in Figure 3 above, has only the 5th largest payroll.
FIGURE 4 • Total annual wages paid by nonprofits vs. key U.S. industries, 2017
Manufacturing $828,981,307,627
Professional & technical services $821,053,479,735
NONPROFIT SECTOR $670,218,053,000
Finance & insurance $623,229,937,522
Retail trade $492,828,657,599
Wholesale trade $447,499,793,133
Construction $419,802,333,869
Total wages paid
Salamon and Newhouse • Nonprofit Economic Bulletin #48 • page 7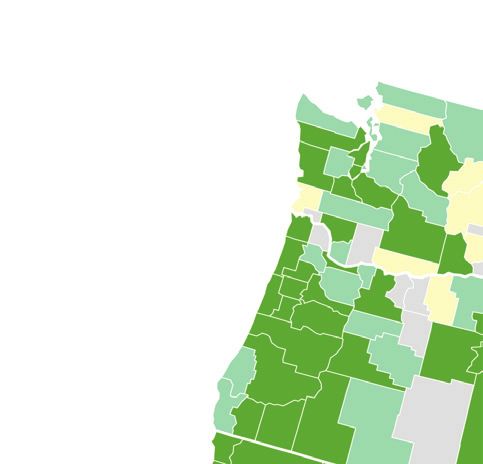
l      l     l   l    l    l    l    l    l    l    l    l   The 2020 Nonprofit Employment Report           l   l   l   l     l   l    l   l    l   l   l   l

Higher Average Wages in Most Fields
This substantial nonprofit payroll scale reflects not only the considerable size of the nonprofit workforce, but
also two facts that run counter to widespread misconceptions: first, the fact that while nonprofits may pay lower
wages than the average for-profit in the general economy, this disparity is far smaller than is frequently
assumed; and second, the fact that in the fields in which nonprofits operate, they actually pay wages that on
average are actually higher than for-profit firms in the same fields.

Thus, the national average weekly wage in the nonprofit sector in 2017, at $1,032, was 97% as large as the
average economy-wide weekly wage in the private for-profit sector. But in fields in which nonprofits and for-
profits are both heavily involved, nonprofit average weekly wages tend to be higher than those offered by
for-profit firms in the same fields. In particular, as FIGURE 5 shows:

                 è Nonprofit individual and family services and home health care organizations pay
                   over 70% more than their for-profit counterparts.
                 è Nonprofit social assistance organizations pay 56% more than for-profits operating in
                   the same field.
                 è Nonprofit educational institutions pay on average 50% more than for-profit
                   educational institutions. This includes an average of 9% more in elementary and
                   secondary schools and 37% more in colleges, universities, and professional schools.
                 è Nonprofit ambulatory health care organizations pay 26% more on average than
                   for-profits in that field; nonprofit hospital weekly wages exceed those in for-profits by
                   15%, and nonprofit nursing homes pay an average of 5% more than for-profit homes.
                 è In only three of the major fields in which nonprofits operate do for-profit firms pay
                    higher average weekly wages than nonprofits, but these are all non-human service
                    fields and the special case of arts and recreation, which includes professional sports.

                           FIGURE 5 • Nonprofit average weekly wages as a share of for-profit
                                 average weekly wages, major nonprofit fields, 2017
                                   All fields                                                             97%
                Individual & family services                                                                                                       177%
                         Home health care                                                                                                       170%
                           Social assistance                                                                                             156%
                       Educational services                                                                                           150%
                         Higher education                                                                                      137%
                              Associations*                                                                                 131%
                    Ambulatory health care                                                                            126%
                             Child day care                                                                         121%
                                  Hospitals                                                                      115%
           Elementary & secondary schools                                                                     109%
                            Nursing homes                                                                   105%
           Professional & techcnical sevices                                                        86%
                          Arts & recreation                                                   76%
                 Management of companies                                                54%
                                                                                  Nonprofit average weekly wage as a percent of for-profit wages
    *Includes religious, grantmaking, civic, professional, and similar organizations.

                                    Salamon and Newhouse               •      Nonprofit Economic Bulletin #48       •   page 8
l l l l l l l l l l l l The 2020 Nonprofit Employment Report l l l l l l l l l l l l
A Dynamic Sector Contributing Significantly
to Employment Growth
As FIGURE 6 shows, the nonprofit sector saw significant growth over the period 2007 to 2017, increasing its
workforce by a total of 18.6%. By contrast, for-profit employment in the economy as a whole grew by a much
more tepid 6.2%.
Especially notable was the growth of nonprofit employment during the recessionary period following the
2007-08 financial crisis. During this 2007-2012 period, nonprofits boosted their employment by 8.5% while
for-profit businesses reduced their economy-wide employment by an aggregate total of -4.1%. The growth in
nonprofit employment likely reflects the combination of the counter-cyclical programs already on the federal
government’s books and the passage of the Affordable Care Act, which pumped additional support into the
health care arena where nonprofits are especially active.
For-profits recovered significantly in the latter portion of this 11-year period, but nonprofits continued to
grow their employment base as well. As a result, over the entire 2007 to 2017 period nonprofits outpaced
economy-wide for-profit job growth by a factor of 3:1 (18.6% vs. 6.2%).
FIGURE 6 • Employment growth rate, nonprofit vs. for-profit, 2007-2012, 2012-17, 2007-17
Nonprofit For-profit
18.6%
Percent change
10.8%
9.3%
8.5%
6.2%
-4.1%
2007-2012 2012-2017 2007-2017
Salamon and Newhouse • Nonprofit Economic Bulletin #48 • page 9l l l l l l l l l l l l The 2020 Nonprofit Employment Report l l l l l l l l l l l l
This pattern of vigorous nonprofit job growth was
evident in virtually every state, moreover, as shown
TABLE 1 • Nonprofit employment growth
in TABLE 1.
rates, by state, 2007-2012, 2012-17, 2007-17
In fact, in 28 of the states and territories for which 2007-2012 2012-2017 2007-2017
there are longitudinal data, the growth of nonprofit National 8.5% 9.3% 18.6%
jobs during the full 2007-2017 period exceeded the Alabama 5.6% 2.2% 7.9%
Alaska 16.3% 5.6% 22.9%
national average of 18.6%. In 25 of the 50 states,
Arizona 16.1% 16.0% 34.8%
nonprofit job growth exceeded 20 percent over this Arkansas 10.2% 9.5% 20.7%
period. What is more, nonprofit employment in all but California 10.0% 10.5% 21.6%
4 states and Puerto Rico experienced a nonprofit job Colorado 14.4% 14.7% 31.3%
growth rate that exceeded the average economy- Connecticut 9.6% 5.2% 15.3%
Delaware 14.7% 12.6% 29.2%
wide for-profit job growth rate of 6.2% between
District of Columbia 11.1% 7.0% 18.9%
2007-2017, and only one state—Rhode Island— Florida 9.1% 14.7% 25.2%
experienced a cumulative decrease in nonprofit Georgia 10.1% 16.8% 28.6%
employment (-2.3%) over this period. Hawaii 6.2% 10.0% 16.8%
Idaho 18.9% 16.4% 38.5%
Illinois 6.2% 6.6% 13.1%
Indiana 12.1% 9.1% 22.3%
Iowa 5.4% 3.6% 9.2%
Kansas 6.7% -0.7% 6.0%
Kentucky 11.8% 10.9% 24.1%
Louisiana 16.6% 16.2% 35.4%
Maine 7.9% 7.4% 16.0%
Maryland 10.0% 4.5% 14.9%
Massachusetts 5.9% 9.9% 16.3%
Michigan 1.0% 5.0% 6.1%
Minnesota 9.1% 12.3% 22.5%
Mississippi 9.5% 8.1% 18.4%
Missouri 9.2% 8.7% 18.7%
Montana 11.2% 8.4% 20.5%
Nebraska 7.4% 6.0% 13.8%
Nevada 10.9% 21.5% 34.8%
New Hampshire 7.6% 10.9% 19.4%
New Jersey 3.7% 5.0% 8.8%
New Mexico 7.2% 6.1% 13.8%
New York 5.6% 8.2% 14.3%
North Carolina 15.8% 9.5% 26.8%
North Dakota 15.3% 8.2% 24.8%
Ohio 6.7% 9.9% 17.2%
Oklahoma 9.6% 7.6% 18.0%
Oregon 9.5% 16.3% 27.3%
Pennsylvania 5.5% 4.0% 9.7%
Puerto Rico 4.9% 0.2% 5.1%
Rhode Island 0.0% -2.3% -2.3%
South Carolina 15.2% 15.3% 32.8%
South Dakota 14.8% 7.0% 22.8%
Tennessee 6.4% 9.5% 16.5%
Texas 13.2% 14.3% 29.3%
Utah 14.7% 20.8% 38.5%
Vermont 9.7% 11.0% 21.8%
Virginia 12.3% 11.8% 25.5%
Washington 13.7% 19.1% 35.4%
West Virginia 9.7% 8.1% 18.5%
Wisconsin 8.0% 3.6% 11.9%
Wyoming 4.1% -1.5% 2.6%
Salamon and Newhouse • Nonprofit Economic Bulletin #48 • page 10l l l l l l l l l l l l The 2020 Nonprofit Employment Report l l l l l l l l l l l l
As shown in FIGURE 7, nonprofit employment also grew in all fields between 2007 and 2017. The fastest
growth during this period occurred in industries where nonprofits represent relatively low shares of private
employment, including: retail trade (80%); management of companies (67%); ambulatory health care (58%); the
arts (39%); and administrative and waste services (36%).
FIGURE 7 • Nonprofit vs. for-profit employment growth rate, 2007-2017, by field
Nonprofit 123.8%
For-profit
Percent growth, 2007-2017
67.0%
58.0%
39.2%
27.8% 29.2%
25.2% 24.3%
19.5% 21.5% 19.6%
18.6% 18.2%
14.1%
10.4% 9.9%
6.2% 6.0%
2.6%
-6.4%
Management Ambulatory Arts & Educational Social Nursing
All fields of companies health care recreation Other** services assistance Hospitals Associations* homes
*Includes religious, grantmaking, civic, professional, and similar organizations.
**Other incudes: Information; Professional, scientific, and technical services; Retail trade; and Administrative & waste services management
Nonprofit Loss of Market Share
While nonprofits exceeded the employment growth rate of the for-profit sector in the economy overall between
2007-2017, a different picture is evident in many fields that nonprofits have long dominated. In particular, for-
profit employment in a number of traditional nonprofit fields grew faster than nonprofit employment—continuing
a trend identified in previous reports.5 Apparently, the same factors—especially expanded governmental
support—that fueled nonprofit growth in these field attracted for-profit competitors that offered lower wages
and therefore lower costs to cash-strapped governments and that likely had more aggressive marketing efforts
and were thus able to claim market share from nonprofit providers. While both sectors gained ground, the for-
profits gained the edge. Thus, as shown in Figure 7:
5
See Lester M. Salamon and Chelsea L. Newhouse, “The 2019 Nonprofit Employment Report,” Nonprofit Economic Data Bulletin no. 47. (Baltimore: Johns
Hopkins Center for Civil Society Studies, January 2019). Available at: ccss.jhu.edu/publications-findings/?did=507.
Salamon and Newhouse • Nonprofit Economic Bulletin #48 • page 11l l l l l l l l l l l l The 2020 Nonprofit Employment Report l l l l l l l l l l l l
è While nonprofit employment in nursing and residential care grew by 2.6% during
this period, for-profit employment in this field grew by nearly 20%.
è In hospitals, for-profit employment growth outpaced nonprofit employment growth
24.3% to 10.4%.
è In social assistance, for-profit employment growth outpaced nonprofit growth
roughly 124% to 18%.
è And in education, the for-profit edge was 29% to 22%.
As a consequence, in many of the fields in which nonprofits have traditionally dominated, for-profits made
significant inroads in terms of market share. In particular, as shown in FIGURE 8:
è In hospital care, it went from 85.4% in 2007 to 83.8% in 2017.
è In education, it declined from 72.2% in 2007 to 70.9% in 2017.
è In social assistance, it dropped precipitously—from 56.9% to 41.1%.
è In nursing and residential care, nonprofit employment went from 38.7% of all
private employment in 2007 down to 35.2% in 2017.
è The only major fields in which nonprofits gained market share over this period were
associations (+4%); ambulatory heath care (+3.1%); and the arts (+2.4%).
In short, while the data demonstrate the resilience of the nonprofit sector in the face of tough economic
circumstances, they also lay bare the challenges these organizations face in an increasingly competitive
environment.
FIGURE 8 • Nonprofit share of private employment, by industry, 2007 vs. 2017
9.2%
All fields 10.2%
85.4%
Hospitals 83.8%
72.2%
Education 70.9%
55.8%
Associations* 59.8%
56.9%
Social assistance
41.1%
38.7%
Nursing homes 2007
35.2%
Ambulatory health
16.2% 2017
19.3%
13.1%
Arts & recreation
15.5%
Nonprofit share of private employment
*Includes religious, grantmaking, civic, professional, and similar organizations.
Salamon and Newhouse • Nonprofit Economic Bulletin #48 • page 12l l l l l l l l l l l l The 2020 Nonprofit Employment Report l l l l l l l l l l l l
l
PART II l
Nonprofits & COVID-19
Nonprofit COVID-19 job losses
Despite its recent history of robust job growth, the nonprofit sector has not been immune from the job-killing
consequences of the recent COVID-19 pandemic. The precise scale of these losses is not yet clearly apparent,
however, since the Bureau of Labor Statistics has not yet done any update of its 2017 nonprofit employment
data. We therefore do not know whether nonprofits managed to repeat their prior documented practice of
resisting the sharper declines in employment that for-profit employers, even in the same service fields, imposed
on their workforces during previous recessions. Further complicating estimates during this recent crisis is the
fact that the May employment situation estimates reported by the Bureau of Labor Statistics have been subject
to a great deal of push-back from experts because the standard survey used for monthly employment reporting
did not sufficiently differentiate between workers who were actually “back to work” as opposed to those who
were being paid a salary through the federal Payroll Protection Program but not actually returning to work (see,
for example, “What to Make of the Rebound in the U.S. Jobs Report,” New York Times, June 5, 2020).
This is believed to have grossly over-estimated the apparent increase in employment reported in the May BLS
employment figures, especially in industries like those in which nonprofits are particularly involved where the
re-opening of retail stores and restaurants were not likely to have been involved.
In view of these technical problems in the available data, we were reduced to estimating the nonprofit job
losses during the critical first three months of the active impact of the coronavirus—March, April, and May,
2020. To do so, we took the conservative approach of assuming that nonprofit job losses were roughly
proportional to the share of nonprofit jobs in the various fields in which nonprofits were active as of the
latest date for which such data are available, i.e., 2017. Further, in view of the confusion surrounding worker
responses to the BLS surveys in May, we assumed that only half of the job additions in these fields reported in
May were actually job restorations, as opposed to artifacts of the way the data on salary coverage as opposed
to actual job gains were reported.
As shown in TABLE 2 below, these calculations yield an estimate of a sizable 1.6 million nonprofit job losses in
this three-month period. This means that 13% of nonprofit jobs disappeared in this period. While this translated
into almost 9% of all private job losses, in the fields in which nonprofits are active—which happen to be some
of the most critical fields of human service needed during a pandemic—the losses of nonprofit jobs were
proportionally much more sizable. Included here were:
è 71% of private educational service job losses, including 84% of those in private
elementary and secondary schools;
è 43% of private health care job losses, including 35% of those in nursing and residential
care facilities, 45% of those in outpatient care centers, and 84% of those in private hospitals;
è 41% of private job losses in social assistance, including 91% of those in private
community food and housing services and 86% of those in private vocational rehabilitation
services;
Salamon and Newhouse • Nonprofit Economic Bulletin #48 • page 13l l l l l l l l l l l l The 2020 Nonprofit Employment Report l l l l l l l l l l l l
è 57% of the job losses in private performing arts companies and 87% of those
in private museums and similar facilities; and
è 60% of the losses in private religious, civic, and professional organizations.
While there is no way to know yet whether these estimates reflect the situation on the ground, we hope that
they will provide a valuable baseline against which future data can be compared. In particular, understanding
the projected effects will allow us to see whether nonprofits’ historical resiliency holds up under this unique
economic pressure—as it did during the more traditional recessionary period following the 2008 economic
downturn.
TABLE 2 • Estimated nonprofit job losses by field, April thru May 2020,
based on BLS overall private employment situation data
Total job losses, NP job losses NP share of
Industry title March-May, March-May, private jobs
2020 2020 (estimated) lost (estimated)
All private non-farm employment -18,723,000 -1,643,128 8.8%
Professinal, Scientific, and Technical services -489,200 -14,689 3.0%
Educational Services -455,600 -323,201 70.9%
Elementary and secondary schools 84.3%
Colleges, univerities, and professional schools 91.6%
Educational support services 41.3%
Health Care -1,322,600 -574,530 43.4%
Ambulatory health care services -1,041,150 -200,942 19.3%
Offices of physicians -229,650 -58,345 25.4%
Offices of dentists -398,100 -4,189 1.1%
Offices of other health care practitioners -175,150 -8,552 4.9%
Outpatient care centers -83,600 -37,276 44.6%
Hospitals 26,700 22,381 83.8%
Nursing and residential care facilities 36,600 12,883 35.2%
Social Assistance -630,150 -259,007 41.1%
Individual and family services -223,900 -79,316 35.4%
Child day care centers -332,600 -97,568 29.3%
Community food and housing, other relief services -8,100 -7,389 91.2%
Vocational rehabilitation services -65,550 -56,421 86.1%
Arts, Entertainment, and Recreation -1,327,250 -205,964 15.5%
Performing arts, spectator sports, and similar -226,200 -48,723 21.5%
Performing arts companies -49,100 -42,492 57.0%
Museums, historical sites, and similar 86.5%
Other Services (except public administration) -1,155,000 -218,167 18.9%
Religious, grantmaking, civic, professional, and similar -246,050 -147,061 59.8%
Religious organizations 84.9%
Grantmaking and giving services 91.5%
Social advocacy organizations 87.6%
Civic and social organizations 71.3%
Business, professional, labor, political, and similar 13.8%
Other fields* -11,394,500 -47,570 0.4%
*Includes: Construction; Manufacturing; Wholesale trade; Retail trade; Transportation & warehousing; Information; Finance & insurance; and Accommodation & food services
Job loss data from BLS monthly employment situation reports for: March (bls.gov/news.release/archives/empsit_04032020.htm), April (bls.gov/news.release/archives/empsit_05082020.
htm), and May (bls.gov/news.release/archives/empsit_06052020.htm) 2020.
Salamon and Newhouse • Nonprofit Economic Bulletin #48 • page 14l l l l l l l l l l l l The 2020 Nonprofit Employment Report l l l l l l l l l l l l
Nonprofits and the Paycheck Protection Program
Fortunately, Congress enacted, and the President signed, an important protection for workers thrown out of
work by the coronavirus epidemic. Under the Coronavirus Aid, Relief, and Economic Security (CARES) Act,
signed into law on March 27, a Paycheck Protection Program (PPP) was put in place offering to “small
businesses” with fewer than 500 employees the ability to apply for forgivable loans of 2.5 times monthly payroll
expenses, up to $10 million, to cover payroll costs, rent and utilities, and interest on mortgage and debt.
Although the PPP legislation made provision for coverage of nonprofit firms, insufficient emphasis was
placed either in the program’s roll-out or in press coverage of it that nonprofits are “small businesses”
eligible for assistance under this law. Adding to the problem, the early management of this program by the
nation’s commercial banks channeled most of the available assistance to large, for-profit firms with multiple
establishments and with established connections with the financial institutions in charge of managing the
program. In fact, however, as shown in TABLE 3 below, data we have been able to secure from the Bureau of
Labor Statistics6 reveals that the vast majority (97.7%) of nonprofit firms fall into the category of being “small
businesses.” These organizations account for close to 5 million nonprofit employees and over $190 billion in
nonprofit payrolls. To date, however, the government has provided no information on the extent to which these
small nonprofit “businesses” have been able to benefit from this Paycheck Protection Program.
TABLE 3 • Nonprofit firms, employment, and wages eligible
for PPP support under the 500-employee limit
Dimension Number Share of
total nonprofit
Nonprofit firms below 500 employees 162,167 97.7%
Employees in nonprofit firms below 500 employees 4,782,982 38.3%
Wages in nonprofit firms below 500 employees $190,656,119 28.4%
6
Available at: https://www.bls.gov/bdm/nonprofits/nonprofits.htm
Salamon and Newhouse • Nonprofit Economic Bulletin #48 • page 15l l l l l l l l l l l l The 2020 Nonprofit Employment Report l l l l l l l l l l l l
l
PART III l
Conclusion & Implications
America’s nonprofit sector is thus a far more sizable and robust economic force in the American economy than
is widely recognized. In addition to its crucial programmatic contributions to the country’s health, education,
social service, and cultural activities, nonprofits constitute the country’s third largest workforce and generate its
third largest payroll of any national industry, and hence make important contributions to the tax revenue of the
country’s national, state, and local governments.
But this vital sector has not been immune from the negative impacts of the current COVID-19 pandemic. An
estimated 1.6 million nonprofit workers have lost their jobs, putting significant pressure on the crucial services
that these organizations have historically provided. These pressures come on top of the impacts these
organizations have experienced in recent years from the shift in government support to these organizations
from direct producer-side grants to indirect subsidies channeled to organizations through tax expenditures
and vouchers provided to consumers. The result has been to attract for-profit providers into markets originally
pioneered by nonprofit providers. Coupled with the access for-profit providers have to capital through the
issuance of stocks and bonds, the result has been to create an uneven playing field for nonprofit providers and
a steady deterioration of nonprofit market shares.
While competition certainly has its place in this field as in many others, the competition needs to be on a level
playing field—particularly given the special contributions that nonprofits have been found to make in devising
innovative forms of service, serving more disadvantaged clients, and staying the course even when economic
circumstances turn sour. If evidence of the sort provided here can call attention both to the unique strengths
and contributions that this sector has generated and some of the challenges it now faces, it will have served its
purpose well. The vitality of American life may well depend on it.
Salamon and Newhouse • Nonprofit Economic Bulletin #48 • page 16l l l l l l l l l l l l The 2020 Nonprofit Employment Report l l l l l l l l l l l l
l
APPENDIX A l
Additional Data
FIGURE A1 • Nonprofit share of private employment,
Economists regularly consider
any industry or economic sector by state, 2017
that employs 5% of a country’s
U.S. National 10.2%
workforce to be a “major” District of Columbia 25.6%
industry or sector. It is therefore Vermont 19.1%
Maine 18.1%
notable that the 12.3 million 17.8%
New York
paid workers employed by Massachusetts 17.7%
U.S. nonprofit establishments Rhode Island 16.6%
North Dakota 16.0%
as of 2017 accounted for a Pennsylvania 15.7%
substantial 10.2% of the total New Hampshire 15.0%
Minnesota 14.9%
U.S. private workforce. In over Montana 14.8%
half of the states and territories, South Dakota 14.8%
Connecticut 14.6%
moreover, nonprofits exceed 14.2%
West Virginia
the national average, and in Alaska 14.0%
12 states they account for Maryland 12.9%
Ohio 12.3%
~15% or more, including states Oregon 12.2%
as diverse as West Virginia, Delaware 11.9%
Wisconsin 11.8%
South Dakota, Connecticut, Hawaii 11.7%
and Alaska, as shown in Iowa 11.4%
APPENDIX FIGURE 1. Illinois 11.4%
Missouri 11.3%
Michigan 10.8%
Nebraska 10.7%
Indiana 10.2%
Washington 9.8%
Kentucky 9.8%
New Jersey 9.6%
Arkansas 9.3%
Virginia 9.0%
North Carolina 8.5%
Kansas 8.3%
New Mexico 8.2% Over 15%
Louisiana 8.2%
Arizona
Tennessee
8.2%
8.1% 10.2%-14.9%
California 7.9%
Colorado 7.6% Under 10.2%
Georgia 7.5%
Florida 7.2%
Idaho 7.0%
Puerto Rico 6.9%
Oklahoma 6.8%
Utah 6.7%
Mississippi 6.5%
Wyoming 6.1%
South Carolina 5.5%
Texas 5.1%
Alabama 5.1%
Virgin Islands 5.1%
Nevada 2.8%
Nonprofit percent of private employment
Salamon and Newhouse • Nonprofit Economic Bulletin #48 • page 17l l l l l l l l l l l l The 2020 Nonprofit Employment Report l l l l l l l l l l l l
There are significant regional differences in terms of nonprofit share of private employment, with nonprofits in
the Northeast (17%), Mid-Atlantic (14.2%), and Midwest (11.8%) regions comprising an above-average share of
the private workforce, and states in the West (9.6%), Southwest (7.7%), and Southeast (7.1%) falling below the
national average, as shown in APPENDIX FIGURE 2. In particular:
è All states in the Northeast region (Connecticut, New Hampshire, Rhode Island,
Massachusetts, New York, Maine, and Vermont) are above the national average, with
the smallest share being seen in Connecticut at 14.6%.
è In the Mid-Atlantic region (Delaware, Maryland, Pennsylvania, D.C., West Virginia,
Virginia, and New Jersey), only Virginia and New Jersey fall below the national
average, while in D.C., the nonprofit sector makes up over a quarter of the private
workforce.
è In the Midwest states, only Kentucky and Kansas fall below the national average
while all other states exceed that mark.
è In the West, 4 out of 9 states exceed the national average, however, Nevada at 2.8%
has the smallest nonprofit sector in the nation in terms of employment share.
è In both the Southeast (including the Virgin Islands and Puerto Rico) and Southwest,
the average nonprofit share of employment is just 7.1%, with the highest share in
these two regions in Arkansas at 9.3%.
FIGURE A2 • Nonprofit share of private employment, by region, 2017
17.0%
Average nonprofit share of private employment
14.2%
11.8%
9.6%
7.1% 7.1%
Northeast Mid-Atlantic Midwest West Southeast Southwest
Salamon and Newhouse • Nonprofit Economic Bulletin #48 • page 18l l l l l l l l l l l l The 2020 Nonprofit Employment Report l l l l l l l l l l l l
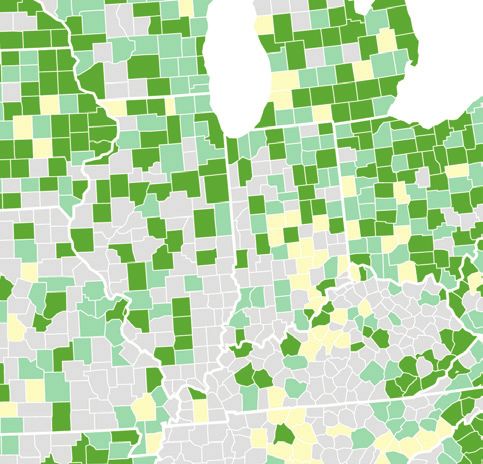
An even clearer picture of the relative position of nonprofit organizations vis-à-vis overall private employment
can be gained by examining this relationship at the county level. This is done in APPENDIX FIGURE 3, which
shows that nonprofits represented over 10% of total private employment in nearly half (47.1%) of the 1638
counties for which county-level data are available. In another 34.2% of these counties, nonprofits represented
between 5 and 10% of private employment, and in only 18.6% of the counties was it under 5%.
FIGURE A3 • Nonprofit share of private employment, by county, 2017
Over 10%
5%-10%
Under 5%
Salamon and Newhouse • Nonprofit Economic Bulletin #48 • page 19l l l l l l l l l l l l The 2020 Nonprofit Employment Report l l l l l l l l l l l l
A Ubiquitous Presence
While 88% of U.S. nonprofit employment is located in metropolitan areas—it is by no means the case that
nonprofit employment is a purely urban phenomenon. To the contrary, newly available regional data make
clear that the nonprofit share of private jobs in metropolitan areas is roughly equivalent to that in the nation as a
whole—10.4% vs. 10.2%. This reflects the fact that in nearly half (380) of the country’s metropolitan areas
for which data are available, the average share of private employment that nonprofits account for, at
7.1%, is well below the 8.7% average in the nation’s non-metropolitan areas. More revealingly, nearly half
(48%) of the 380 metropolitan areas for which data are newly available have nonprofit shares of their private
employment below the 10.2% U.S. average as shown in APPENDIX FIGURE 4.
FIGURE A4 • Nonprofit share of private employment, by Metro Statistical Area, 2017
Above 10.2%
Below 10.2%
Salamon and Newhouse • Nonprofit Economic Bulletin #48 • page 20l l l l l l l l l l l l The 2020 Nonprofit Employment Report l l l l l l l l l l l l
l
APPENDIX B l
Methodology
Quarterly Census of Employment and Wages (QCEW)
The data on IRS Section 501(c)3 tax exempt entities reported here come from the Quarterly Census of
Employment and Wages (QCEW), which is administered by state Labor Market Information agencies under
the supervision of the Bureau of Labor Statistics (BLS) in the U.S. Department of Labor. QCEW is an
administrative dataset collected by states as a part of the federal Unemployment Insurance (UI) program and
draws on the quarterly surveys of workplaces that state employment security offices have conducted since
the 1930s. Under federal law, all nonprofit places of employment with four or more employees are required to
participate in the unemployment insurance system. However, 22 states also extend this requirement to places
of employment with one or more employees.
The principal exclusions from the QCEW dataset vary by state and include employees of religious
organizations, railroad workers, small-scale agriculture workers, self-employed workers, domestic service
workers, crew members on small vessels, state and local government elected officials, and insurance and real
estate agents who receive payment solely by commission. However, QCEW data encompass approximately
97% of non-farm employment—providing a virtual census of employees and their wages as well as the most
complete universe of employment and wage data, by industry, at the State, regional, and county levels. In
terms of nonprofit employment, the exclusion of religious organizations as well as entities with less than
four employees is the most significant; however, religious organizations may elect to be covered by the
unemployment insurance program and those that do are covered in the data. At this time the exact number of
employees in tax-exempt establishments not covered by QCEW is not known, but we estimate it to be no more
than 3% of total employment in the nonprofit sector.
Finding Nonprofits in the QCEW
While nonprofit places of employment have long been covered by the QCEW surveys, the data generated by
these surveys have never broken out the nonprofit employment separately from the for-profit employment. As a
consequence, the nonprofit sector has essentially been buried in the data. To remedy this, the Johns Hopkins
Center for Civil Society Studies’ Nonprofit Economic Data Project developed a methodology for identifying
nonprofit employers in the QCEW micro-data by record matching with the publicly available register of tax-
exempt entities maintained by the Internal Revenue Service (IRS). The nonprofit micro-data were subsequently
aggregated by county and fields of activity to meet the federal disclosure rules mandated by law to protect the
confidentiality of company specific information.
The result is the most accurate and up-to-date picture of nonprofit employment yet available. This is so
because the QCEW data have a number of critical advantages over other data sources available to shed light
on nonprofit employment trends. In particular, these data:
è Are collected every quarter;
è Are closely monitored and verified for accuracy by the Labor Market Information offices
of state Employment Security agencies and the federal Bureau of Labor Statistics;
Salamon and Newhouse • Nonprofit Economic Bulletin #48 • page 21l l l l l l l l l l l l The 2020 Nonprofit Employment Report l l l l l l l l l l l l
è Are collected at the establishment level rather than the organization level, which is
important to avoid distortions otherwise caused by the existence of multipurpose and
multi-location organizations;
è Cover employment and wages, which is especially relevant for gauging the operations of
labor- intensive entities such as nonprofits;
è Are comprehensive, covering about 97% of all nonprofit employment;
è Record the results using a classification structure that is widely used in other official
economic data series, thus facilitating cross-sector comparisons; and
è Cover for-profit and government places of employment in the same data system, which
facilitates systematic comparisons among the sectors, a matter of increasing importance.
In 2014, BLS started releasing its own generated nonprofit data on a 5-year cycle at the national and state
level but not the county level, following a methodology of record matching similar to that pioneered by the
Johns Hopkins researchers. However, BLS improved that methodology by adding organizations called
“reimbursables” that were not included in the IRS business register. Reimbursables are organizations that
under state unemployment laws are not required to pay unemployment insurance contributions each quarter,
but rather are allowed to reimburse the unemployment insurance system when a claim is made. Most states
will restrict such units to 501(c)3 nonprofits. The QCEW micro data include information on reimbursables. The
data reported here cover the year 2017 as revised through May 2020, readers are advised that BLS frequently
makes adjustments to its initial estimates and future adjustments may affect certain aspects of the analysis.
More information, including the full data tables on nonprofit employment and wages, are available from the BLS
at: bls.gov/bdm/nonprofits/nonprofits.htm.
Data Limitations and Suppression
The primary limitation of the nonprofit employment data come from the federally mandated disclosure rules that
require suppression of statistical information that allows the identification of single institutional units.
This suppression is applied at the industry level. In practice, this suppression can take two forms. First, the
so-called “primary suppression” is applied when aggregates contain fewer than 3 units or when a single
unit exceeds 80% of the aggregate total. Due to the large number of nonprofit aggregates in these data, the
primary suppression rules that guided the data assembly by JHU researchers are somewhat stricter and
require at least 10 units per aggregate and a maximum 75% of the aggregate total per single unit. In addition,
the so-called “secondary suppression” must be applied if the value of the non-disclosable aggregate can be
calculated from the disclosed values (e.g. by subtraction); when this is the case, the disclosure of additional
aggregates must also be suppressed to eliminate this possibility.
For the purpose of this report, we focus on the “charitable” portion of the nonprofit sector because this
is the portion that most people have in mind when they think about the nonprofit sector. This includes all
organizations registered with the U.S. Internal Revenue Service under Section 501c(3) of the Internal
Revenue Code, which embraces private not-for-profit hospitals, clinics, colleges, universities, elementary
schools, social service agencies, day care centers, orchestras, museums, theaters, environmental
organizations, homeless shelters, soup kitchens and many more.
For more information about the methodology used to produce this report please contact ccss@jhu.edu or the
BLS Business Employment Dynamics information line (available via the BLS link above).
Salamon and Newhouse • Nonprofit Economic Bulletin #48 • page 22ABOUT THE CENTER FOR CIVIL SOCIETY STUDIES
The Johns Hopkins Center for Civil Society Studies is a leading source of
ground-breaking research and knowledge about the nonprofit sector, social investing,
and the tools of government. Working in collaboration with governments, international
organizations, investment innovators, and colleagues around the world, the Center
encourages the use of this knowledge to strengthen and mobilize the capabilities
and resources of the public, nonprofit, and for-profit sectors to address the complex
problems that face the world today. The Center conducts research and educational
programs that seek to improve current understanding, analyze emerging trends,
and promote promising innovations in the ways that government, civil society, and
business can collaborate to address social and environmental challenges.
ABOUT THE NONPROFIT ECONOMIC DATA PROJECT (NED)
Nonprofit organizations are facing increased pressures in states and localities
throughout the United States, but the nonprofit sector’s ability to respond to these
pressures has been limited by a lack of timely information about how prevailing
economic realities are affecting the sector. The Johns Hopkins Nonprofit
Economic Data Project (NED) is helping to tackle this problem by charting
economic trends in the nonprofit sector, and producing cutting-edge reports on key
components of the nonprofit economy in regions and states across the country.
Tapping a wide assortment of the best data sources available, the Center’s NED
reports cover nonprofit employment, revenues, expenditures, assets, philanthropic
resources, and volunteering for the sector as a whole and in particular fields, such as
health, education, social services, and arts and culture. They also document changes
over time and reveal how nonprofits stack up in comparison to for-profit organizations
overall and in key nonprofit fields. Over 40 such reports have been prepared,
making it possible for nonprofit leaders to put their sector on the mental maps of
policy-makers, the media, the sector itself, and citizens at large. For information on
how you can commission a report on the nonprofit economy in your state or region,
contact chelsea.newhouse@jhu.edu.
JUNE • 2020
ccss.jhu.edu
@jhuccss
facebook.com/jhuccss
ccss@jhu.edu
Johns Hopkins Krieger School of Arts and Sciences | Department of Political Science | Mergenthaler Hall, 3rd Floor | 3400 N. Charles St. | Baltimore, MD 21018You can also read