Early risk assessment for COVID 19 patients from emergency department data using machine learning - Nature
←
→
Page content transcription
If your browser does not render page correctly, please read the page content below
www.nature.com/scientificreports

                OPEN             Early risk assessment for COVID‑19
                                 patients from emergency
                                 department data using machine
                                 learning
                                 Frank S. Heldt1*, Marcela P. Vizcaychipi2,3, Sophie Peacock1, Mattia Cinelli1,
                                 Lachlan McLachlan1, Fernando Andreotti1, Stojan Jovanović1, Robert Dürichen1,
                                 Nadezda Lipunova1, Robert A. Fletcher1, Anne Hancock1, Alex McCarthy2,
                                 Richard A. Pointon2, Alexander Brown2, James Eaton2, Roberto Liddi1, Lucy Mackillop1,4,5,
                                 Lionel Tarassenko1,6 & Rabia T. Khan1

                                 Since its emergence in late 2019, the severe acute respiratory syndrome coronavirus 2 (SARS-CoV-2)
                                 has caused a pandemic with more than 55 million reported cases and 1.3 million estimated deaths
                                 worldwide. While epidemiological and clinical characteristics of COVID-19 have been reported,
                                 risk factors underlying the transition from mild to severe disease among patients remain poorly
                                 understood. In this retrospective study, we analysed data of 879 confirmed SARS-CoV-2 positive
                                 patients admitted to a two-site NHS Trust hospital in London, England, between January 1st and
                                 May 26th, 2020, with a majority of cases occurring in March and April. We extracted anonymised
                                 demographic data, physiological clinical variables and laboratory results from electronic healthcare
                                 records (EHR) and applied multivariate logistic regression, random forest and extreme gradient
                                 boosted trees. To evaluate the potential for early risk assessment, we used data available during
                                 patients’ initial presentation at the emergency department (ED) to predict deterioration to one of
                                 three clinical endpoints in the remainder of the hospital stay: admission to intensive care, need for
                                 invasive mechanical ventilation and in-hospital mortality. Based on the trained models, we extracted
                                 the most informative clinical features in determining these patient trajectories. Considering our
                                 inclusion criteria, we have identified 129 of 879 (15%) patients that required intensive care, 62 of 878
                                 (7%) patients needing mechanical ventilation, and 193 of 619 (31%) cases of in-hospital mortality.
                                 Our models learned successfully from early clinical data and predicted clinical endpoints with high
                                 accuracy, the best model achieving area under the receiver operating characteristic (AUC-ROC) scores
                                 of 0.76 to 0.87 (F1 scores of 0.42–0.60). Younger patient age was associated with an increased risk of
                                 receiving intensive care and ventilation, but lower risk of mortality. Clinical indicators of a patient’s
                                 oxygen supply and selected laboratory results, such as blood lactate and creatinine levels, were most
                                 predictive of COVID-19 patient trajectories. Among COVID-19 patients machine learning can aid in
                                 the early identification of those with a poor prognosis, using EHR data collected during a patient’s
                                 first presentation at ED. Patient age and measures of oxygenation status during ED stay are primary
                                 indicators of poor patient outcomes.

                                 COVID-19, caused by the severe acute respiratory syndrome coronavirus 2 (SARS-CoV-2), is a novel infectious
                                 disease that leads to severe acute respiratory distress in humans. In March 2020, the World Health Organisation

                                 1
                                  Sensyne Health Plc, Schrodinger Building, Heatley Road, Oxford Science Park, Oxford OX4 4GE, UK. 2Chelsea and
                                 Westminster Hospital NHS Foundation Trust, 369 Fulham Road, London SW10 9NH, UK. 3Academic Department
                                 of Anaesthesia and Intensive Care Medicine, Imperial College London, Chelsea and Westminster Campus, 369
                                 Fulham Road, London SW10 9NH, UK. 4Women’s Centre, Oxford University Hospitals NHS Foundation Trust,
                                 John Radcliffe Hospital, Headley Way, Headington, Oxford OX3 9DU, UK. 5Nuffield Department of Women’s and
                                 Reproductive Health, University of Oxford, Women’s Centre, John Radcliffe Hospital, Headley Way, Headington,
                                 Oxford OX3 9DU, UK. 6Institute of Biomedical Engineering, Department of Engineering Science, University of
                                 Oxford, Oxford OX3 7DQ, UK. *email: stefan.heldt@sensynehealth.com

Scientific Reports |   (2021) 11:4200               | https://doi.org/10.1038/s41598-021-83784-y                                              1

                                                                                                                                         Vol.:(0123456789)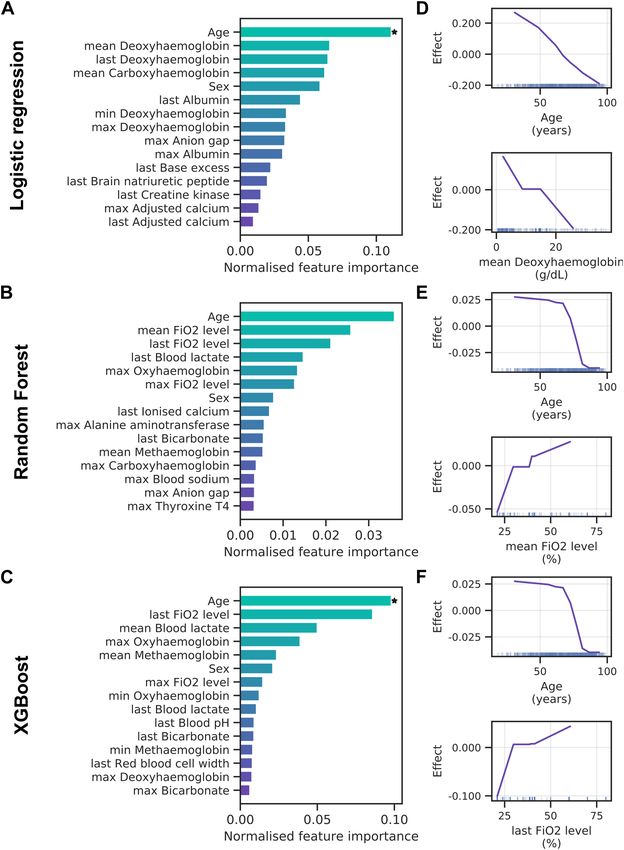
www.nature.com/scientificreports/
declared the outbreak a pandemic and, by November 2020, it had caused more than 55 million confirmed cases
and 1.3 million estimated deaths worldwide. Disease severity for COVID-19 varies drastically between patients,
including asymptomatic infection, mild upper respiratory tract illness and severe viral pneumonia with acute
respiratory distress, respiratory failure and thromboembolic events that can lead to d eath1–3. Initial reports
suggest that 6–10% of infected patients are likely to become critically ill, most of whom will require mechani-
cal ventilation and intensive c are2,4. Currently, few prognostic markers exist to forecast whether a COVID-19
patient may deteriorate to a critical condition and require intensive care. In general, patients can be grouped
into three phenotypes, being at risk of thromboembolic disease, respiratory deterioration and cytokine s torm5.
Clinical reports find that age, sex and underlying comorbidities, such as hypertension, cardiovascular disease
and diabetes, can adversely affect patient o utcomes6,7. However, few studies have leveraged machine learning
to systematically explore risk factors for poor prognosis and predict patient outcomes from early clinical data.
Increasingly, hospitals collate large amounts of patient data as electronic healthcare records (EHRs). Com-
bined with state-of-the-art machine learning algorithms, these data can help to predict patient outcomes with
greater accuracy than traditional methods8,9. However, EHR data for COVID-19 remains scarce in the public
domain, prompting many authors to focus on statistical analyses instead2,10–12. Where machine learning has
been applied to COVID-19, results have been promising, but most studies suffer from a lack of statistical power
owing to small sample s ize13–16. Jiang et al. applied predictive analytics to data from two hospitals in Wenzhou,
China, which included 53 hospitalised COVID-19 patients, to predict risk factors for acute respiratory distress
syndrome (ARDS)13. Exploring the risk factors for in-hospital deaths, Zhou and co-workers used univariate and
multivariate logistic regression on data of 191 patients in two hospitals in Wuhan, China14. Similarly, Xie et al.
used logistic regression to predict mortality, training a model on 299 patients and validating it on 145 patients
from a different hospital in Wuhan, C hina16. Gong et al. used a logistic regression model to identify patients at
risk of deterioration to severe COVID-19, applied to the data of 189 patients in Wuhan and Guangdong, China15.
Studies to date have used a combination of demographics, comorbidities, symptoms, and laboratory tests13–15,17.
These data typically comprise the patients’ entire historical record, as well as observations collected during the
current hospital stay14,16–18. While the inclusion of a patient’s full EHR history improves predictive performance,
such approaches may be limited in their clinical applicability to early risk-assessment; rarely is the entire EHR
of a patient available at the point of presentation in hospital.
In this work, we retrospectively apply machine learning to data of 879 confirmed COVID-19 patients from
two tertiary referral urban hospitals in London to predict patients’ risk of deterioration to one of three clinical
endpoints: (A) admission to an adult intensive care unit (AICU), (B) need for invasive mechanical ventilation,
and (C) in-hospital mortality. We restrict our analysis to EHR data available during a patient’s first presentation
in the emergency department (ED) as this more accurately resembles the hospital reality of early-risk assessment
and patient-stratification. Our analysis provides a proof of principle for COVID-19 risk assessment, with models
achieving a high prediction performance, indicating that patient age, oxygenation status and selected laboratory
tests are prime indicators of patient outcome.
Methods
Data collection and study design. Anonymised EHR data of patients admitted to a two-site hospital
Trust in London, England, between January 1st, 2020 and May 26th, 2020, were gathered by Chelsea & Westmin-
ster NHS Foundation Trust (NHS Trust, hereafter). The data was supplied in accordance with internal informa-
tion governance review, NHS Trust information governance approval, and General Data Protection Regulation
(GDPR) procedures outlined under the Strategic Research Agreement (SRA) and relative Data Sharing Agree-
ments (DSAs) signed by the NHS Trust and Sensyne Health plc on 25th July 2018. All analyses were conducted
on data with no personal identifying information. Therefore, informed consent was waived by the ethics com-
mittee of the Chelsea & Westminster NHS Foundation Trust, which provided ethical approval for the study.
Data encompasses clinical observations collated from inpatient encounters. The analysis was restricted to
adult patients aged between 18 and 100 years at the time of their COVID-19 related hospital admission. The
latter was defined as an admission with a confirmed SARS-CoV-2 infection determined by quantitative reverse-
transcription PCR (qRT-PCR). 63% of patients in the study cohort were male and 37% female (Table 1). The
majority were white British (28.3%) or did not state their ethnicity (23.3%) (see also Supplementary Fig. S1).
Cohort definition. A total of 1235 COVID-19 positive patients fell within the observation time and study
parameters. From these patients, three cohorts were derived, one for each clinical endpoint, as follows (see also
Supplementary Fig. S2). First, patients who did not have information relating to an admission to any hospital
department in 2020 were excluded, resulting in 968 patients. Then the following exclusion criteria were applied
to each of the considered endpoints: for cohort (A) patients without a documented ward location were excluded;
for cohort (B) patients without information on oxygen supply were excluded; for cohort (C) patients without
hospital discharge information were excluded. Finally, since our models were trained on data available during a
patient’s stay in the ED, we removed patients who did not have a documented ED visit. The final cohorts included
879, 878 and 619 patients for cohorts, A, B and C, respectively (Table 2). No significant differences in composi-
tion were found between these three cohorts (Supplementary Table S1).
Each cohort was divided into target and control groups (see Table 2). For AICU admission, target patients
comprise those that were admitted to an AICU at any time during their hospital stay, while control patients are
those that remained in any other ward for their entire admission. Target patients in the ventilation cohort were
defined as requiring invasive mechanical ventilation, whereas control patients required no or only minimal
breathing assistance. Both categories are based on clinical records of oxygen supply according to Table 3. Note
that from hospital data the total number of mechanically ventilated patients was 135. However only 62 of these
Scientific Reports | (2021) 11:4200 | https://doi.org/10.1038/s41598-021-83784-y 2
Vol:.(1234567890)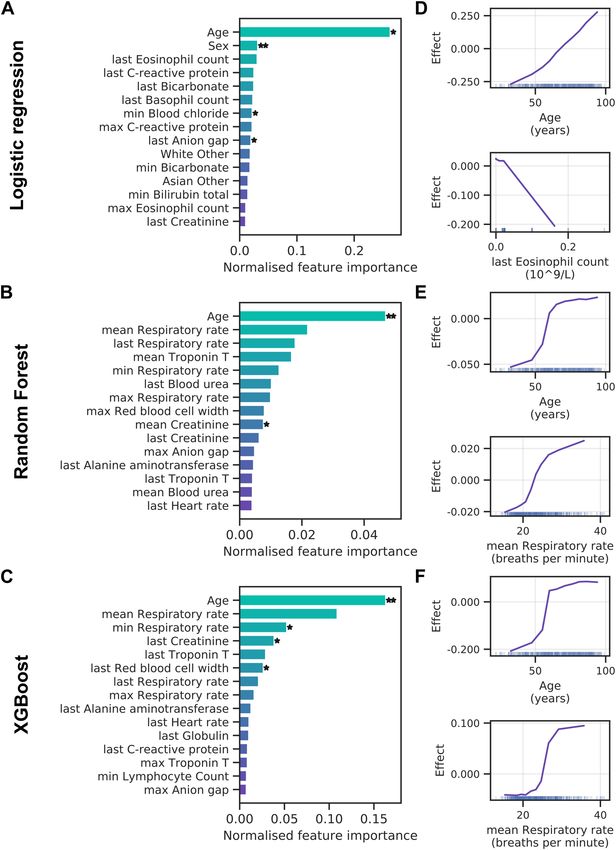
www.nature.com/scientificreports/

                                  Demographics
                                  Patient age (years)
                                  Range                                18.0–99.0
                                  Overall mean (std)                   67.6 (16.9)
                                  Female mean (std)                    70.0 (17.4)
                                  Male mean (std)                      66.3 (16.3)
                                  Sex (number of patients)
                                  Female                               324 (36.9%)
                                  Male                                 554 (63.0%)
                                  Unknown                              1 (0.1%)
                                  Ethnicity (number of patients)
                                  White British                        248 (28.2%)
                                  Not stated                           205 (23.3%)
                                  Ethnic other                         105 (11.9%)
                                  White other                          90 (10.2%)
                                  Asian Indian                         65 (7.4%)
                                  Asian other                          42 (4.8%)
                                  Unknown                              30 (3.4%)
                                  Black African                        26 (3.0%)
                                  Black Caribbean                      23 (2.6%)
                                  Asian Pakistani                      13 (1.5%)
                                  Other                                32 (3.6%)

                                  Table 1.  Composition of overall patient population.

                                                           Cohort A (AICU admission)        Cohort B (ventilation)    Cohort C (mortality)
                                  Number of patients       879                              878                       619
                                  Target patients          129 (15%)                        62 (7%)                   193 (31%)
                                  Control patients         750 (85%)                        816 (93%)                 426 (69%)

                                  Table 2.  Clinical endpoint cohorts.

                                  Category        Clinical observation value
                                                  Room air, air/none, nasal cannulae, high flow nasal cannulae, venturi mask, face mask, non-rebreather mask, simple face mask,
                                  Control
                                                  swedish nose with, oxygen, mask, HFOV, face/tracheostomy mask, CPAP, BiPAP
                                  Target          Ventilator, tracheostomy, CMV, VC-CMV, t-piece, HELIOX, IPPV, SIMV, PC-BIPAP, APRV, CPAP / ASB_SPN / CPAP/PS

                                  Table 3.  Target and control definition for ventilation cohort.

                                  135 patients were visible in our analysis. This results from staggered deployment of EHR data in the two hospitals
                                  such that one site is understood to lack certain data related to mechanical ventilation. Mortality data was based
                                  on the discharge destination (mortuary) in clinical records. All regularly discharged patients were considered
                                  part of the control cohort.

                                  Data processing and feature generation. The data set covered patients’ entire encounter history from
                                  presentation at the hospital’s ED to discharge, with a median length of in-hospital stay of 7.2 days. Features
                                  were only extracted from data available during a patient’s ED stay (median length of stay of 4.7 h). Variables
                                  with less than 5% coverage in the patient population were removed from our analysis resulting in a total of 64
                                  clinical features, including patient demographics (3 in total), vital signs (4 in total), laboratory measurements
                                  and clinical observations (57 in total). These features and their coverage across all three cohorts are listed in
                                  Supplementary S2. Categorical variables such as patient sex and ethnicity were one-hot encoded. For continu-
                                  ous variables patients may have received multiple test results during their stay. These values were aggregated for
                                  each feature to only retain the respective minimum, maximum, mean and last observation value in ED. Missing
                                  values in the feature set were imputed with the mean of the training data. For the logistic regression model (see
                                  below) each feature was also standardised to zero mean and unit variance based on the training set. To account
                                  for the class imbalance in the data set (see Table 2), we applied minority class oversampling to the training data

Scientific Reports |   (2021) 11:4200 |                     https://doi.org/10.1038/s41598-021-83784-y                                                                        3

                                                                                                                                                                       Vol.:(0123456789)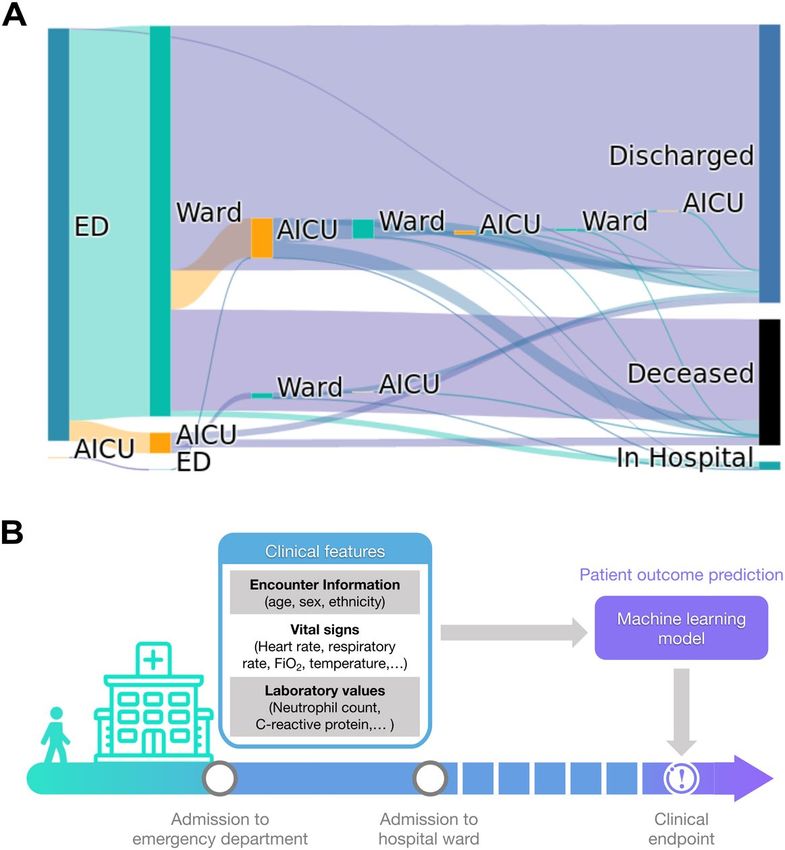
www.nature.com/scientificreports/
using SMOTE19. All models were trained using all features described in Supplementary Table S2. Mean feature
values across each of the three cohorts separated by control and target patients are provided in Supplementary
Tables S2-S4.
Patient outcome prediction. Three machine-learning algorithms were benchmarked to predict patient
outcomes from EHR data: logistic regression, random forest and Extreme Gradient Boosted Trees (XGBoost).
Logistic regression, which predicts the probability of a clinical endpoint as a linear function of the feature
space, was used as a baseline algorithm. The model was regularised with elastic net using equal weighting given
to L1 and L 2 penalties in order to account for the high dimensionality of the data set relative to the number
of observations20. A random forest21 was trained using 100 trees and splits were evaluated using Gini impu-
rity. Classes were inversely weighted to account for the class imbalance present in the data set. An XGBoost
algorithm22 was trained with its hyperparameters set to 100 trees, max tree-depth of 6, step-shrinkage of 0.3, no
subsampling and L 2 regularisation, to minimize log-loss. This tree-based algorithm trains decision trees sequen-
tially, with each new tree being trained on the residuals of previous trees.
Performance evaluation. All methods were evaluated using a threefold cross-validation strategy with a
stratified validation split based on target patients. The stratified cross-validation splits were kept the same for
all methods. For each cross-validation split an independent model was trained, resulting in three independent
models for each method. Results are reported as mean and standard deviation across these independent models.
Predictive performance was measured in terms of area under curve (AUC) of the receiver operating character-
istic (ROC) and, given the presence of class-imbalance, precision-recall curves are provided to assess expected
real-world performance relative to random classifiers. To further account for class imbalance, F1 scores and
confusion matrices at each model’s ideal classification threshold as derived by Youden’s J statistic on the ROC
curve were also computed.
In order to extract the clinical features most relevant to predictions, permutation feature importance (PFI)
was calculated for each model post-hoc21,23. To this end, each feature was individually randomised using ten
trials per feature. The model’s average precision on the validation sets was then compared to the average preci-
sion before the feature had been randomised. The changes in precision were normalised by the sum of absolute
changes over all features. Averages and standard deviations over the validation sets from three cross-validation
folds have been reported. From these results, statistical significance was assessed by computing p values based
on a one-sided t-test with the null hypothesis of no significant differences from zero mean.
Accumulated local effects (ALE) were computed to determine the directionality of a feature’s effect on model
predictions24. Specifically, the feature space was divided into ten percentile bins and each feature’s effect was
calculated as the difference in predicted risk between the upper and lower bounds of each bin, leaving all other
features unchanged. Binning features in this way can reduce the influence of correlated features often encountered
when trying to isolate the effect of a single f eature24.
Computation. The entire analysis was carried out in Python 3.6.8 on a Linux-based system. Data were pro-
cessed using numpy 1.18.125 and pandas 1.0.126. Models were constructed with scikit-learn 0.23.127 and xgboost
1.0.122. PFI was implemented using scikit-learn’s permutation_importance function. Results were visualised in
matplotlib 3.1.328 and seaborn 0.10.0.
Results
Patient pathways. A summary of observed patient in-hospital pathways is shown in Fig. 1A. Of the 630
patients for whom the complete pathway is available, 629 (99.8%) entered the hospital via the ED, while 1 (0.2%)
patient was admitted directly to AICU. Upon leaving the ED, 596 (94.6%) patients transitioned to regular wards
and 32 (5.1%) to an AICU. Of the 596 patients admitted to regular wards, 405 (68%) were ultimately discharged,
12 (2%) remained in hospital and 179 (30%) succumbed to the infection. Among the 596 ward patients, 60
(10.1%) patients required subsequent admission to an AICU. Hence, a total of 92 patients have been admitted
to an AICU at some point during their hospital journey. Of these 92 AICU patients, 50 (54.3%) were ultimately
discharged, 38 (41.3%) did not survive and 4 (4.3%) remained in hospital.
The median time from hospital presentation to receiving a positive COVID-19 test result was 26.2 h. Patients’
median length of stay in ED was 4.7 h (IQR 3.13 h). During this time, demographic information, vitals and
laboratory values were collected (Fig. 1B). To aid an early patient stratification, our models use data collected
during the ED stay only to predict whether a patient reached any of three clinical endpoints during their sub-
sequent admission.
AICU admission. First, we studied patients transitioning to critical care and requiring admission to an
AICU. All three models reach good prediction performance on this endpoint, as measured by area under the
curve (AUC) of the receiver operating characteristic (ROC) and precision-recall curves, significantly outper-
forming random classifiers (Fig. 2). The best performing model, XGBoost, reaches an AUC-ROC of 0.84 and an
F1 score of 0.52. Both tree-based methods perform better than logistic regression (Table 4). This is to be expected
since logistic regression cannot model interactions between features unless such interactions are explicitly
encoded into the training data set through feature engineering. To further corroborate model performance on
our imbalanced data set (see Table 2), we analysed the calibration of the models’ predicted patient risk against
true patient outcomes. Both the random forest and XGBoost models show close to ideal calibration with Brier
scores of 0.10, whereas logistic regression is calibrated noticeably worse, reaching a Brier score of 0.21 (Supple-
mentary Fig. S3A). Similarly, both tree-based methods yield a lower number of false positive predictions com-
Scientific Reports | (2021) 11:4200 | https://doi.org/10.1038/s41598-021-83784-y 4
Vol:.(1234567890)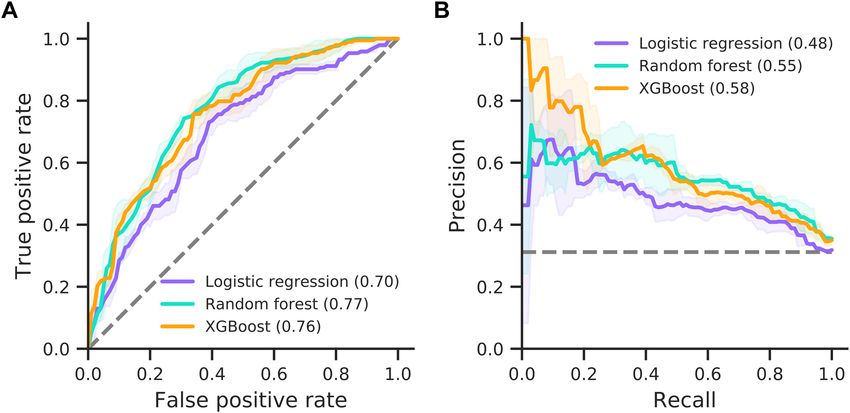
www.nature.com/scientificreports/

                                  Figure 1.  Patient pathways and outcome prediction. (A) Patient transitions between hospital departments are
                                  shown as bands proportional in size to patient numbers. Different departments are indicted by rectangles (ED,
                                  emergency department; Ward, regular hospital ward; AICU, adult intensive care unit). Patients who remain
                                  in hospital, are being discharged or die in hospital are indicated on the right. (B) Patient outcome prediction
                                  models use clinical data recorded within the ED stay of a patient to predict clinical endpoints during the
                                  remainder of the in-hospital stay.

                                  Figure 2.  Prediction performance for AICU admission. Model performances for the logistic regression,
                                  random forest and XGBoost models are shown as ROC (A) and precision-recall curves (B). AUC is provided
                                  in brackets. Solid lines and shaded areas indicate the mean and standard deviation across three cross-validation
                                  folds, respectively. Dashed lines indicate random classifiers.

Scientific Reports |   (2021) 11:4200 |               https://doi.org/10.1038/s41598-021-83784-y                                                     5

                                                                                                                                            Vol.:(0123456789)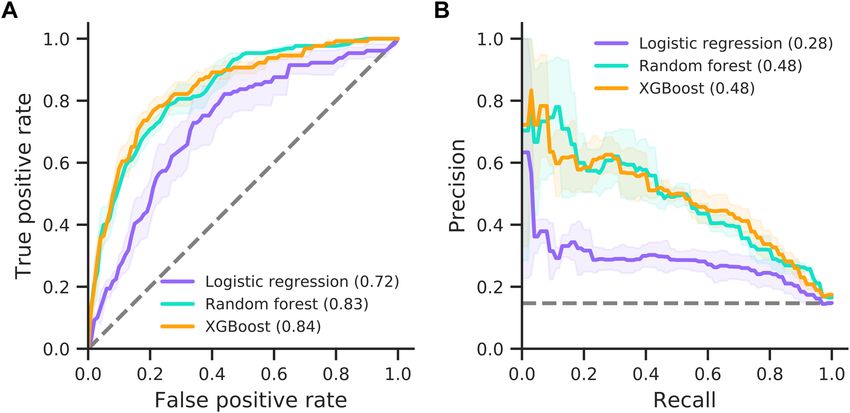
www.nature.com/scientificreports/
Endpoint A (AICU
admission) Endpoint B (ventilation) Endpoint C (mortality)
Model AUC F1 AUC F1 AUC F1
Logistic regression 0.72 (0.049) 0.40 (0.025) 0.74 (0.082) 0.23 (0.014) 0.70 (0.031) 0.56 (0.028)
Random forest 0.83 (0.005) 0.49 (0.036) 0.87 (0.028) 0.31 (0.030) 0.77 (0.030) 0.61 (0.026)
XGBoost 0.84 (0.014) 0.52 (0.012) 0.87 (0.028) 0.42 (0.059) 0.76 (0.034) 0.60 (0.032)
Table 4. Model performance on clinical endpoint prediction (standard deviation shown in brackets). Best
model in bold.
pared to logistic regression (Supplementary Fig. S4) as well as a higher sensitivity and specificity (Supplemen-
tary Table S6). All models show a moderate amount of variability across cross-validation folds (notice standard
deviations in Fig. 2 and Table 4), which can compromise subsequent analyses. This instability originates from the
limited number of patients and imbalance between target and control patients (see Table 2). Specifically, in each
of the three cross-validation folds the models are only trained and validated on two thirds and one third of the
data set, respectively, leaving few target patients for these tasks.
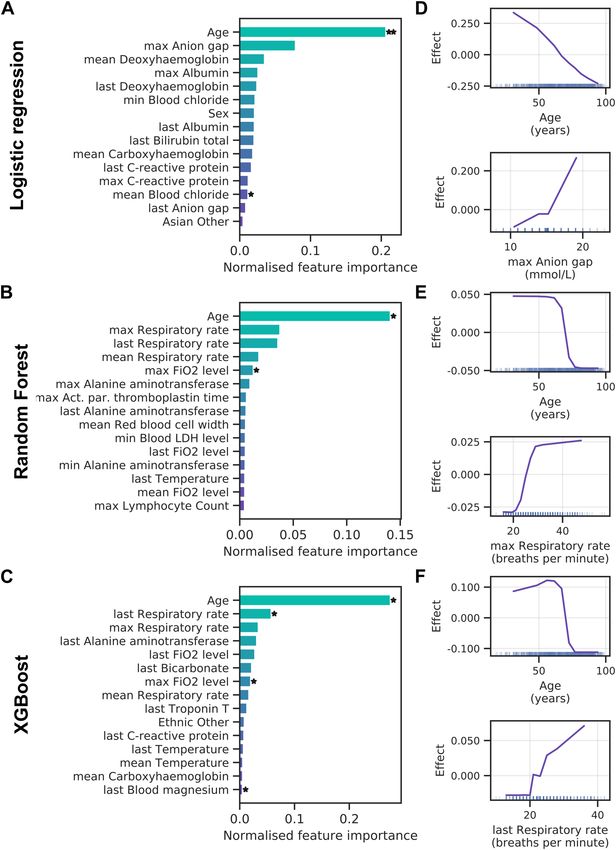
Next, we assessed which clinical variables contribute the most to model predictions by applying PFI. Figure 3A
presents the 15 most important features for the logistic regression with elastic net regularisation. Note that
clinical variables that can be recorded multiple times during a patient’s ED visit were aggregated to retain only
the minimum, maximum, mean and last observation value during the ED stay. Only patient age reached high
importance and significance over cross-validation folds for the logistic regression. The random forest (Fig. 3B)
and XGBoost (Fig. 3C) models assign high importance to patient age, with respiratory rate following thereafter.
Intriguingly, ALE analyses reveal that lower patient age increases the likelihood of AICU admission in all three
models (Fig. 3D–F). This agrees well with a bias towards younger patients when comparing AICU-admitted
patients with control patients (Supplementary Fig. S5A). However, clinical indicators of disease severity, such
as C-reactive protein and ferritin levels, show no clear trend across age groups (Supplementary Fig. S6). We also
find that the anion gap (Fig. 3D) and respiratory rate (Fig. 3E,F) exhibit a positive effect on AICU admission
probability.
In summary, machine learning algorithms can predict those COVID-19 patients most likely to require AICU
admission from EHR data available during the initial ED stay with high precision. Patient age and measures of
oxygenation status are strong indicators of patient outcome, with advanced age decreasing the probability of
AICU admission.
Mechanical ventilation. For mechanical ventilation prediction, we categorised patients into those that
needed a ventilator (e.g., patients receiving SIMV, BIPAP or APRV ventilation) and control patients that either
were able to breathe normally or required minimal assistance (e.g., those patients receiving oxygen via nasal can-
nulae or face masks). Prediction performance on this endpoint is comparable to prediction of AICU admission
(Fig. 4). Specifically, random forest and XGBoost perform best, reaching AUCs of 0.87, while logistic regression
reaches 0.74 (Table 4). This result is expected since most patients receive mechanical ventilation in AICU, mean-
ing the ventilation cohort is a subset of the critical care cohort (55 of 62 target patients in Cohort B are target
patients in Cohort A). Notably, all models show a decrease in F1 scores and stability when predicting this clinical
endpoint (Table 4 and Fig. 4). This is most likely due to a higher class-imbalance and lower number of patients
receiving ventilation. However, both the random forest and XGBoost models maintain good calibration of pre-
dicted risk against true outcomes with Brier scores of 0.06 (Supplementary Fig. S3B).
Feature importance analysis for the logistic regression shows a large effect of patient age and deoxyhaemo-
globin levels (Fig. 5A). This mirrors the results for AICU admission. Both tree-based methods rank patient
age as well as the fraction of inspired oxygen (FiO2) and blood lactate levels highly (Fig. 5B,C), although few
contributions are significant. In general, all models rely on a broader set of features for the ventilation endpoint.
ALE analysis shows younger patients had an increased probability of receiving ventilation (Fig. 5D–F), which
agrees with an inherent bias towards younger age when comparing ventilated with non-ventilated patients (Sup-
plementary Fig. S5B). In addition, a low deoxyhaemoglobin level and a high fraction of inspired oxygen were
associated with a poor prognosis.
Taken together, models show good performance when predicting ventilation, albeit with a decreased model
stability (higher standard deviation) and F1 scores. Patient age and oxygenation status are most predictive of poor
outcome, with additional contributions from blood test values, such as lactate and deoxyhaemoglobin levels.
Mortality. The performance of all three models shows a marked decrease in AUC-ROC when predicting
mortality (Fig. 6). The logistic regression reaches an AUC of 0.70, whereas random forest and XGBoost reach
0.77 and 0.76, respectively. However, all models show improved precision with F1 scores of 0.56–0.61, reaching
their highest values among all clinical endpoints (Table 4).
Scientific Reports | (2021) 11:4200 | https://doi.org/10.1038/s41598-021-83784-y 6
Vol:.(1234567890)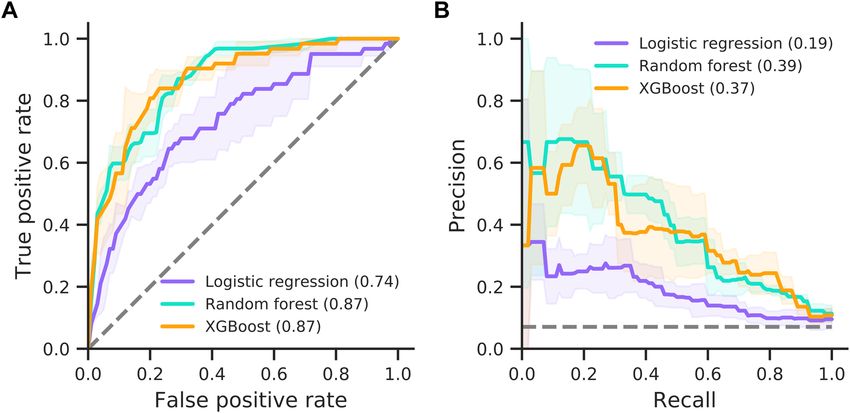
www.nature.com/scientificreports/

                                  Figure 3.  Feature importance for AICU admission. (A–C) Permutation feature importance for the logistic
                                  regression (A), random forest (B) and XGBoost (C) models. Only the top 15 features are shown. Asterisks mark
                                  features with importance scores significantly different from zero across three cross-validation folds with t-test
                                  p value thresholds of 5% ( *) and 1% (* *). (D–F) Accumulated local effects plots for the logistic regression (D),
                                  random forest (E) and XGBoost models (F). The top two features according to permutation feature importance
                                  are shown for each model. Vertical bars at the bottom indicate feature values observed in the data set.

Scientific Reports |   (2021) 11:4200 |                https://doi.org/10.1038/s41598-021-83784-y                                                  7

                                                                                                                                              Vol.:(0123456789)
www.nature.com/scientificreports/
Figure 4. Prediction performance for mechanical ventilation. Model performances for the logistic regression,
random forest and XGBoost models are shown as ROC (A) and precision-recall curves (B). AUC is provided
in brackets. Solid lines and shaded areas indicate the mean and standard deviation across three cross-validation
folds, respectively. Dashed lines indicate random classifiers.
Predictions from the logistic regression model are dominated by patient age, with patient sex adding a small
but significant contribution (Fig. 7A). Similarly, tree-based methods rely heavily on age for their predictions, with
smaller contributions of respiratory rate, Troponin T and creatinine levels (Fig. 7B,C). More generally, prediction
of mortality shows several blood tests that are not strictly related to oxygenation status among the important
features. ALE analysis shows that advanced age is predictive of higher mortality (Fig. 7D–F). This agrees with a
bias towards older age in patients that die in hospital (Supplementary Fig. S5C). Moreover, low eosinophil counts
and high respiratory rates increase the risk of mortality in our models (Fig. 7D–F).
In summary, our models show an increased F1 score but lower AUC-ROC performance when predicting
mortality. Feature importance scores reveal a high and significant contribution of patient age with advanced age
contributing to poor patient outcomes.
Discussion
Disease severity can vary dramatically between COVID-19 patients, ranging from asymptomatic infection to
severe respiratory distress and failure. To evaluate the potential of an early stratification of hospitalised patients
into risk groups, we built machine learning models from EHR care data of confirmed COVID-19 positive
patients, aimed at predicting one of three clinical endpoints: admission to AICU, the need for mechanical ven-
tilation and mortality. On all three cohorts, our models reach good performance with the best model showing
AUC-ROC between 0.76 and 0.87. Overall, machine learning methods can thus reliably predict poor outcomes
for COVID-19 patients from early clinical data, available during the ED stay of patients.
The most predictive feature for all three endpoints was patient age, followed by indicators of patients’ oxy-
genation status, including fraction of inspired oxygen and respiratory rate. Given that SARS-CoV-2 causes an
infection of the respiratory tract, which can lead to severe respiratory distress, these results were to be expected.
Our findings are supported by similar works, in which age is consistently found to be the most important
feature14–16. However, we note that other potential indicators for severe viral infection, like increased temperature
and markers of immune system activation, e.g. C-reactive protein, are less prominent in our feature importance
scores. Overall, prediction of mortality relies more strongly on blood tests as opposed to indicators of oxygen
supply observed in other endpoints. The reason for this observation and its clinical significance merits further
investigation. Our ALE analysis reveals that lower patient age contributes to an increased probability of receiv-
ing mechanical ventilation and critical care in AICU, while coinciding with lower mortality. We also note that
Docherty et al. find that 17% of COVID-19 patients require admission to a High Dependency or Intensive Care
Unit29, which is similar to 15% of patients in our data. Conversely, our findings regarding the importance of
features relating to patients’ oxygenation status are not corroborated by other works. Specifically, other studies
find that one important predictor of patient outcome is the level of lactate d ehydrogenase15,16, which, although
present in our data set, does not significantly contribute to predictions.
Scientific Reports | (2021) 11:4200 | https://doi.org/10.1038/s41598-021-83784-y 8
Vol:.(1234567890)www.nature.com/scientificreports/
Figure 5. Feature importance for mechanical ventilation. Permutation feature importance for the random
forest (A), logistic regression (B) and XGBoost (C) models. Only the top 15 features are shown. Asterisks mark
features with importance scores significantly different from zero across three cross-validation folds with t-test
p value thresholds of 5% ( *) and 1% (* *). (D–F) Accumulated local effects plots for the logistic regression (D),
random forest (E) and XGBoost models (F). The top two features according to permutation feature importance
are shown for each model. Vertical bars at the bottom indicate feature values observed in the data set.
Scientific Reports | (2021) 11:4200 | https://doi.org/10.1038/s41598-021-83784-y 9
Vol.:(0123456789)www.nature.com/scientificreports/
Figure 6. Prediction performance for mortality. Model performances for the logistic regression, random forest
and XGBoost models are shown as ROC (A) and precision-recall curves (B). AUC is provided in brackets. Solid
lines and shaded areas indicate the mean and standard deviation across three cross-validation folds, respectively.
Dashed lines indicate random classifiers.
A novel aspect of the present analysis is the use of data limited to a patient’s first few hours in ED. While
this perhaps more accurately reflects the data available at the time of admission, it may well come at the cost of
missing important information, such as medical history or primary care data, for predicting patient outcome.
This may explain the comparative difficulty in predicting mortality, since a patient’s overall chance of surviving
infection may depend heavily on their medical history. Also note that, in our analysis, all patients were considered
together for mortality prediction and the cohort was not further split according to confounding factors such as
age or sex. In addition, mortality data for recent hospital admissions are by their nature censored, with clinical
endpoints for patients who remain in hospital not yet fully known.
While we base our study on a comparatively large data set from a two-site NHS hospital trust, longitudinal
information from additional treatment centres and geographic regions may improve a model’s ability to gener-
alise. We note that such data is currently unavailable for COVID-19. However, future studies may benefit from
a multicentre approach. As a result of limited data and the imbalanced cohorts, model stability remains a major
challenge. While we use minority class oversampling, inverse class weights and stratified threefold cross valida-
tion to mitigate this issue, large uncertainties in model results persist, and many predictions do not reach statis-
tical significance. Increased patient numbers, in particular among target patients, may lead to more conclusive
results. Once such data is available, more complex models, such as deep neural networks, may achieve higher
prediction performance. A key aspect which should be considered in such works is the prediction horizon, which
impacts on how useful a model could be.
In conclusion, our models represent a first step towards the prediction of COVID-19 patient pathways in
hospital at the point of admission in the emergency department. While they succeed in predicting patient out-
comes and reveal critical clinical variables that may influence patient trajectories, larger data sets and further
analyses are required to draw clinically relevant conclusions.
Scientific Reports | (2021) 11:4200 | https://doi.org/10.1038/s41598-021-83784-y 10
Vol:.(1234567890)www.nature.com/scientificreports/
Figure 7. Feature importance for mortality. (A–C) Permutation feature importance for the logistic regression
(A), random forest (B) and XGBoost (C) models. Only the top 15 features are shown. Asterisks mark features
with importance scores significantly different from zero across three cross-validation folds with t-test p value
thresholds of 5% ( *) and 1% (* *). (D–F) Accumulated local effects plots for the logistic regression (D), random
forest (E) and XGBoost models (F). The top two features according to permutation feature importance are
shown for each model. Vertical bars at the bottom indicate feature values observed in the data set.
Scientific Reports | (2021) 11:4200 | https://doi.org/10.1038/s41598-021-83784-y 11
Vol.:(0123456789)www.nature.com/scientificreports/
Received: 17 June 2020; Accepted: 29 January 2021
References
1. Wu, Z. & McGoogan, J. M. Characteristics of and important lessons from the Coronavirus Disease 2019 (COVID-19) outbreak in
China: summary of a report of 72 314 cases from the Chinese Center for Disease Control and Prevention. JAMA 323, 1239–1242
(2020).
2. Yang, X. et al. Clinical course and outcomes of critically ill patients with SARS-CoV-2 pneumonia in Wuhan, China: a single-
centered, retrospective, observational study. Lancet Respir. Med. 9, 475–481 (2020).
3. Klok, F. A. et al. Incidence of thrombotic complications in critically ill ICU patients with COVID-19. Thromb. Res. 191, 145–147
(2020).
4. Anderson, R. M., Heesterbeek, H., Klinkenberg, D. & Hollingsworth, T. D. How will country-based mitigation measures influence
the course of the COVID-19 epidemic?. Lancet 395, 931–934 (2020).
5. Vizcaychipi, M. P. et al. Early detection of severe COVID-19 disease patterns define near real-time personalised care, bioseverity
in males, and decelerating mortality rates. medRxiv 22, 2413 (2020).
6. Novel Coronavirus Pneumonia Emergency Response Epidemiology Team. The epidemiological characteristics of an outbreak of
2019 novel coronavirus diseases (COVID-19) in China. Chin. Cent. Dis. Control Prev. 41, 145–151 (2020).
7. Chen, T. et al. Clinical characteristics of 113 deceased patients with coronavirus disease 2019: retrospective study. BMJ 368, m1091
(2020).
8. Goldstein, B. A., Navar, A. M., Pencina, M. J. & Ioannidis, J. P. A. Opportunities and challenges in developing risk prediction
models with electronic health records data: a systematic review. J. Am. Med. Inform. Assoc. 24, 198–208 (2017).
9. Wynants, L. et al. Prediction models for diagnosis and prognosis of covid-19 infection: systematic review and critical appraisal.
BMJ 369, 1 (2020).
10. Wang, D. et al. Clinical characteristics of 138 hospitalized patients with 2019 novel coronavirus-infected pneumonia in Wuhan,
China. JAMA 323, 1061–1069 (2020).
11. Arentz, M. et al. Characteristics and outcomes of 21 critically ill patients with COVID-19 in Washington State. JAMA 323,
1612–1614 (2020).
12. Hu, L. et al. Risk factors associated with clinical outcomes in 323 COVID-19 patients in Wuhan, China. medRxiv
2020.03.25.20037721 (2020).
13. Jiang, X. et al. Towards an artificial intelligence framework for data-driven prediction of coronavirus clinical severity. CMC-Comput.
Mater. Contin. 63, 537–551 (2020).
14. Zhou, F. et al. Clinical course and risk factors for mortality of adult inpatients with COVID-19 in Wuhan, China: a retrospective
cohort study. Lancet 395, 1054–1062 (2020).
15. Gong, J. et al. A tool for early prediction of severe Coronavirus Disease 2019 (COVID-19): a multicenter study using the risk
Nomogram in Wuhan and Guangdong, China. Clin. Infect. Dis. 71, 833–840 (2020).
16. Xie, J. et al. Development and external validation of a prognostic multivariable model on admission for hospitalized patients with
COVID-19. medRxiv 2020.03.28.20045997 (2020).
17. Pourhomayoun, M. & Shakibi, M. Predicting mortality risk in patients with COVID-19 using artificial intelligence to help medical
decision-making. medRxiv 2020.03.30.20047308 (2020).
18. Yan, L. et al. Prediction of criticality in patients with severe Covid-19 infection using three clinical features: a machine learning-
based prognostic model with clinical data in Wuhan. medRxiv 2020.02.27.20028027 (2020).
19. Lemaître, G., Nogueira, F. & Aridas, C. K. Imbalanced-learn: a Python toolbox to tackle the curse of imbalanced datasets in machine
learning. J. Mach. Learn. Res. 18, 1–5 (2017).
20. Zou, H. & Hastie, T. Regularization and variable selection via the elastic net. J. R. Stat. Soc. Ser. B Stat. Methodol. 67, 301–320
(2005).
21. Breiman, L. Random forests. Mach. Learn. 45, 5–32 (2001).
22. Chen, T. & Guestrin, C. XGBoost: a scalable tree boosting system. in Proceedings of the 22nd ACM SIGKDD International Confer-
ence on Knowledge Discovery and Data Mining 785–794 (2016).
23. Fisher, A., Rudin, C. & Dominici, F. All models are wrong, but many are useful: learning a variable’s importance by studying an
entire class of prediction models simultaneously. J. Mach. Learn. Res. 20, 1–81 (2019).
24. Apley, D. W. & Zhu, J. Visualizing the effects of predictor variables in black box supervised learning models. ArXiv161208468 Stat
(2019).
25. Harris, C. R. et al. Array programming with NumPy. Nature 585, 357–362 (2020).
26. McKinney, W. Data structures for statistical computing in Python. in Proc. 9th Python Sci. Conf. 56–61 (2010).
27. Pedregosa, F. et al. Scikit-learn: machine learning in Python. J. Mach. Learn. Res. 12, 2825–2830 (2011).
28. Hunter, J. D. Matplotlib: a 2D graphics environment. Comput. Sci. Eng. 9, 90–95 (2007).
29. Docherty, A. B. et al. Features of 16,749 hospitalised UK patients with COVID-19 using the ISARIC WHO Clinical Characterisa-
tion Protocol. medRxiv 2020.04.23.20076042 (2020).
Acknowledgements
This work uses data provided by patients and collected by the NHS as part of their care and support. We believe
using patient data is vital to improve health and care for everyone and would, thus, like to thank all those
involved for their contribution. Special thanks are due to the Chelsea and Westminster (CW) COVID-19 AICU
Consortium, comprising all critical care personnel who were part of the delivery of care during the COVID-
19 pandemic as follows: CW Anaesthetics Consultants, Critical Care Consultants, Trainees & Fellows from
ICU, Anaesthesia, and seconded to ICU from other specialities, Surgeons, the supporting Respiratory and ED
Physicians, Operating Department Practitioners and CW Critical Care Nurses. This united approach to an
unprecedented clinical condition was critical not only to the management of the patients but also to our ability
to document and collate the key data in a timely manner to support this analysis. Also a special thank you to
Trystan Hawkin, Chris Chaney from CWplus, the Planned Care Clinical Division managers, porters, domestic
personnel and the CW local community who without hesitation have supported the National Healthcare System
throughout the COVID-19 pandemic.
Author contributions
F.S.H., M.P.V., F.A., R.D., N.L., A.M., A.H., L.M., L.T., and R.T.K. contributed to the design of the study. N.L.,
A.H., A.M., and R.T.K. were involved in data acquisition and take responsibility for the integrity and accuracy
Scientific Reports | (2021) 11:4200 | https://doi.org/10.1038/s41598-021-83784-y 12
Vol:.(1234567890)www.nature.com/scientificreports/
of the data. F.S.H., S.P., M.C., L.M.L. analysed the data and build the machine learning algorithms. F.S.H., F.A.,
S.J., R.D., N.L., A.H., and R.T.K. supervised and managed the project. F.S.H., S.P., M.C., L.M.L., and S.J. drafted
the manuscript and figures. All authors critically read and revised the content of the manuscript and gave final
approval for its publication.
Competing interests
FSH, MPV, SP, MC, LML, AM and RTK have a patent “Methods for predicting patient deterioration” based
on this work pending. FSH, SP, MC, LML, FA, SJ, RD, NL RAF, AH, RL, LM, LT and RTK are employees of
Sensyne Health plc (part-time in case of LM and LT). MPV, AM, RAP, AB and JE are employees of Chelsea and
Westminster Hospital NHS Foundation trust. LT reported receiving additional fees from the National Institute
for Health Research and the Stroke Association Grants (RP-PG-1214-20003; IS-BRC-1215-20008; RP-PG-0614-
20005; TSA BHF 2017/01), and LM further funded by The National Institute for Health Research Grant (IS-
BRC-1215-20008). LM and LT are further supported by the NIHR Oxford Biomedical Research Centre.
Additional information
Supplementary Information The online version contains supplementary material available at https://doi.
org/10.1038/s41598-021-83784-y.
Correspondence and requests for materials should be addressed to F.S.H.
Reprints and permissions information is available at www.nature.com/reprints.
Publisher’s note Springer Nature remains neutral with regard to jurisdictional claims in published maps and
institutional affiliations.
Open Access This article is licensed under a Creative Commons Attribution 4.0 International
License, which permits use, sharing, adaptation, distribution and reproduction in any medium or
format, as long as you give appropriate credit to the original author(s) and the source, provide a link to the
Creative Commons licence, and indicate if changes were made. The images or other third party material in this
article are included in the article’s Creative Commons licence, unless indicated otherwise in a credit line to the
material. If material is not included in the article’s Creative Commons licence and your intended use is not
permitted by statutory regulation or exceeds the permitted use, you will need to obtain permission directly from
the copyright holder. To view a copy of this licence, visit http://creativecommons.org/licenses/by/4.0/.
© The Author(s) 2021
Scientific Reports | (2021) 11:4200 | https://doi.org/10.1038/s41598-021-83784-y 13
Vol.:(0123456789)You can also read