Clinical presentations, diagnostics, treatments and treatment costs of children and adults with febrile illness in a tertiary referral hospital in ...
←
→
Page content transcription
If your browser does not render page correctly, please read the page content below
Clinical presentations, diagnostics, treatments and treatment costs of
children and adults with febrile illness in a tertiary referral hospital in
south-eastern Guinea: a retrospective longitudinal cohort study.
Manuel Raab ( manuel.j.raab@gmail.com )
Ludwig Maximilian University of Munich
Lisa M. Pfadenhauer
Ludwig Maximilian University of Munich
Dansira Doumbouya
Hôpital Régional de N’zérékoré
Guenter Froeschl
Ludwig Maximilian University of Munich
Research Article
Keywords: Febrile illness, Ebola, Viral haemorrhagic fevers, Malaria, Mortality, Guinea, West Africa
DOI: https://doi.org/10.21203/rs.3.rs-264789/v1
License: This work is licensed under a Creative Commons Attribution 4.0 International License. Read Full License
Page 1/24Abstract
Background
Febrile illness is frequent among patients in the tropics. It is caused by a wide variety of common diseases such as malaria or gastrointestinal
infections but also by less common but highly contagious pathogens with epidemic potential. This study describes the clinical features of adult
and paediatric patients with febrile illness in in the largest tertiary referral hospital in south-eastern Guinea, a region at high risk for viral
haemorrhagic fever outbreaks. The study further compares their diagnostic characteristics, treatments and outcomes with non-febrile patients
in order to contribute to the local epidemiology of febrile illness.
Methods
We used retrospective data collection to record demographic and clinical data of all incoming patients during a study period of three months.
For the follow-up study of inpatients, we retrospectively reviewed patient charts for diagnostic characteristics, diagnoses and outcomes.
Results
Of the 4317 patients admitted during the study period, 9.5% had a febrile illness. The majority of febrile adults (73.8%) and children (92.1%)
were hospitalized after admission. By far, the most used diagnostic measures to identify causative agents in febrile patients were point-of-care
tests. Treatments of febrile patients were mainly a combination of paracetamol and/or antibiotics. Most common discharge diagnoses for
febrile inpatients were malaria (9.6% adults, 56.7% children), salmonella gastroenteritis/typhoid (10.6% adults, 7.8% children) and respiratory
infection/pneumonia (5.3% adults, 18.7% children). Inpatient mortality for children was signi cantly higher in febrile than non-febrile children
(18.5% vs. 5.1%, p < 0.001) and considerably higher in febrile than non-febrile adults (29.8% vs. 25.0%, p = 0.404).
Conclusions
The wide use of rapid diagnostic tests to identify causes of febrile illness highlights the low reliance on basic serological and advanced
laboratory testing to research causative agents of febrile illness other than malaria or salmonella gastroenteritis/typhoid. This not only risks to
over- or under-diagnose certain infectious diseases but also leaves the possibility of highly infectious diseases in febrile patients unexplored.
Furthermore, healthcare facilities in south-eastern Guinea would bene t from antimicrobial stewardship due to their heavy reliance on
antibiotics for treating febrile patients.
Background
Fever is a common reason for patients to seek healthcare in the tropics [1–3]. It is usually associated with non-speci c gastrointestinal or
respiratory symptoms but may also present itself as an isolated symptom. Fever is often used synonymously with the term “febrile illness”,
which is de ned as an illness with an elevated body temperature of at least 37.5°C or higher [4]. Possible causes of febrile illness include a wide
spectrum of pathogens such as bacterial bloodstream infections (e.g. salmonella entertica subtypes), mycobacterial bloodstream infections
(e.g. mycobacterium tuberculosis), bacterial zoonosis (e.g. brucellosis), protozoal infections (e.g. African trypanosomiasis), fungal infections
(e.g. cryptococcus) and viral infections (e.g. rhinoviruses) [5]. In malaria endemic regions, malaria is often the default diagnosis for febrile
illness, partly because of its high prevalence and partly because of the predominance of malaria eradication programs in the past decade which
led to the over-diagnosing of malaria [6–8]. Especially in low-resource healthcare settings, identifying non-malarial febrile illness can be
challenging due to impaired diagnostic capacities and few point-of care tests for most microorganisms [9]. While adequate treatment of febrile
illness ideally depends on the identi cation of the causative agent, febrile illness in low-resource healthcare settings is usually treated with
calculated antimicrobial and/or antimalarial medications, increasing the risk of drug resistance [10].
Next to more common causes of febrile illness in the tropics, certain pathogens with epidemic potential have emerged as equally important
causes for febrile illness [11]. Notably, the 2014–2016 West African Ebola virus outbreak as well as the recent 2021 Ebola virus outbreak in
south-eastern Guinea highlighted the importance of pathogen-speci c screening and surveillance in West Africa for potentially infectious
patients presenting with fever – fever being one of the most common symptoms amongst patients infected with Ebola virus [12, 13]. Guinea –
one of the poorest African nations with a fragile healthcare system – was amongst the most affected countries by the Ebola virus epidemic
[14]. Particularly its south-eastern region is now considered at high risk for outbreaks of viral haemorrhagic fevers such as Ebola virus disease,
Marburg virus disease, Lassa fever and Crimean-Congo haemorrhagic fever [15–20]. All of these highly contagious diseases are known to
Page 2/24cause febrile illness in patients at an early stage of infection [21–24]. But also other potentially fatal infectious diseases causing febrile illness
such as meningitis, leptospirosis or dengue have been reported in the region [25–29].
In this study we describe epidemiological, clinical and diagnostic characteristics, current treatment strategies, and outcomes of adult and
paediatric patients with febrile illness treated at the largest referral hospital in south-eastern Guinea. We further compare these clinical features
of febrile patients with non-febrile patients. Our study provides a pro le of a typical Guinean provincial referral hospital by highlighting its
procedures and capacities in regard to diagnosing and treating febrile illness. Thereby, we hope to contribute to a better understanding of the
local epidemiology of febrile illness in a region at risk for infectious disease outbreaks. We point to further management needs in Guinean
healthcare structures regarding febrile illness amongst patients.
Methods
Study Setting
Our study was carried out at the Hôpital Régional de N’zérékoré (N’zérékoré Regional Hospital, HRNZ), a tertiary provincial referral hospital in
south-eastern Guinea.
N’zérékoré is Guinea’s second largest city with more than 300,000 inhabitants and is the capital of Guinea’s forested region, also known as
Guinée Forestière with a population of over two million [30]. Bordering Sierra Leone, Liberia and Ivory Coast, the region has a tropical climate
with a wet season lasting approximately from May until November and the dry season from December until April. Guinée Forestière is in south-
eastern Guinea and is known as the region where the 2014–2016 West African Ebola outbreak most likely started [31]. A new Ebola outbreak
close to N’zérékoré city was declared in early 2021 and several cases were hospitalized in the HRNZ prior to being laboratory con rmed [32].
With a capacity of approximately 175 beds and services in Internal Medicine, Surgery, Intensive Care, Gynaecology/Obstetrics, Ophthalmology
and Dental Care, the HRNZ is amongst the three largest hospitals in the country. It is the largest referral hospital in Guinée Forestière receiving
emergency patients as well as patients requiring specialized care from surrounding urban and rural areas. The hospital laboratory is equipped
for basic serological, haematological, bacteriological and clinical biochemistry testing. Furthermore, an additional laboratory for viral
haemorrhagic fevers was established in 2014. Supply shortages may, however, constrain laboratory diagnostic capacities. The only possibilities
for imaging purposes are one X-ray and one ultrasound machine.
Upon hospital-entry, triage staff records main symptoms and body temperatures of all non-emergency patients in order to orient patients to the
hospital’s different outpatient services. Severely ill patients are immediately directed to the emergency room. At the outpatient services,
physicians may decide that patients require inpatient care and will send them to the emergency room for further examinations and inpatient
admission. Patients requiring obstetric care or seeking access to the specialized HIV clinic located within the hospital compound may bypass
hospital triage. Thus, all inpatients except HIV clinic and obstetric patients are handled at the level of the emergency room.
The emergency room separates paediatric, adult medical and surgical patients. Paediatric surgical patients are treated in the adult surgical
ward. Physicians examine patients, administer malaria rapid antigen tests (mRDT) if necessary and initiate rst treatments. They further decide
whether patients require inpatient care or not.
Patient records are kept in various registers at hospital triage and the emergency room while patient charts are compiled only for inpatients at
the level of the emergency room.
Data Sources and Study-Design
Using a retrospective study design, we analysed data of all patients who were admitted to the HRNZ between December 2, 2018 and March 1,
2019 (dry season), except obstetric and HIV clinic patients. Details on study design and data sources are well-explained elsewhere [33]. Data
was extracted from hospital records and patient charts at three levels. First, triage data for all incoming patients comprised socio-demographic
characteristics, symptoms, measured body temperatures and referral service. Second, we recorded diagnostic results, treatments,
hospitalization status, suspected diagnoses (the most important three) and outcomes for all adult and paediatric emergency patients, except
surgical patients, deceased patients during emergency treatment and patients whose body temperatures had not been recorded; these patients
were excluded. Third, laboratory diagnostics, primary discharge diagnoses and outcomes of adult and paediatric medical inpatients were
extracted from patient charts. When these charts were incomplete or unclear, we consulted the responsible healthcare worker for missing
information.
For this study, we strati ed patient data of all incoming patients by measured axillary body temperatures (cut-off 38.0°C). In our data, medical
adult and paediatric emergency patients are subdivided into two groups (without fever: < 38.0°C and with fever: ≥ 38.0°C). They are described
and compared by the variables age, symptoms, suspected diagnosis, diagnostics, initial treatment and admission status. Febrile and non-febrile
patients requiring inpatient care are further compared to add more details regarding laboratory diagnostics, discharge diagnoses and outcomes.
Page 3/24Next to the above, we calculated an approximation for the average inpatient healthcare costs per adult and per paediatric inpatient based on
laboratory costs, costs for medications and hospitalization costs per patient. Laboratory costs were calculated based on hospital price lists and
all laboratory and imaging diagnostics performed on inpatients. Costs for medications were calculated based on the average amount of
medications prescribed per inpatient and the average price per medication as indicated by the hospital pharmacy. We excluded the ten most
expensive, yet rarely used medications from our approximation to reduce risk of skewed over-estimating inpatient medication costs.
Hospitalization costs were calculated based on price lists as provided by the hospital administration.
Data Analysis
Patient symptoms and diagnoses were coded according to the International Classi cation of Primary Care, 2nd edition (ICPC-2). All data was
recorded and coded with Microsoft Excel 16 and analysed using IBM SPSS 25. Descriptive statistics were generated and proportions were
compared using Pearson’s-Chi² Test and Exact Fisher Test. Statistical signi cance was determined at p ≤ 0.05. Because of extreme outliers in
age, we used non-parametric median and interquartile range (IQR) to describe the age of admitted patients.
Ethical Considerations
Ethical approval for this study was granted by the Guinean Ethics Committee for Research in Health (opinion number 103/CNERS/18) and the
Ethics Committee for Medical Research at the Ludwig-Maximilians-Universität (LMU), Munich, Germany (opinion number 18–834).
Before its implementation, the study was presented to the regional health authorities and the HRNZ directorate who both consented to its
implementation.
Since data was collected as part of routine clinical practice and for the purpose of this retrospective study extracted in an anonymized fashion,
and in the further analysis presented in an aggregate manner, no informed consent was asked from patients.
All methods were carried out in accordance with relevant guidelines and regulations.
Results
General patient characteristics upon hospital admission
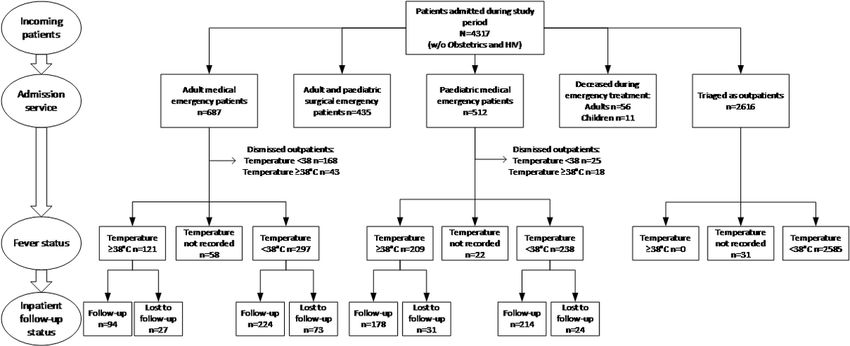
4317 patients were admitted during our study period. Of those patients, 2616 patients (60.6%) were handled by triage, 1178 patients (27.3%) by
the adult emergency room and 523 patients (12.1%) by the paediatric emergency room (Table 1). In total, 67 patients (1.6%) deceased in the
emergency room during treatment, of which 56 in the adult emergency room and 11 in the paediatric emergency room. Almost half of all the
patients were male (2121/4317; 49.1%), the other half female (2193/4317; 50.8%). The majority of admitted patients (3375/4317; 78.2%) came
from urban areas, the rest (795/4317; 18.4%) from rural areas. While patients reported fever as the most frequent primary reason for seeking
care at the hospital, none of the 2616 patients handled by triage had a measured axillary body temperature ≥ 38,0°C (febrile). However, with
regard to the emergency facilities, 15.4% (182/1178) of adult emergency patients and 43.8% (229/523) of paediatric emergency patients
resulted to be febrile, amounting to a total 9.5% (411/4317) of all patients being febrile upon hospital admission. For 274 patients (6.3%) no
body temperature was recorded. Of all admitted patient, most febrile patients were within the age group 0–4 years (4.3%; 174/4043; Fig. 1). The
three most frequent referral services were internal medicine (35.4%), paediatrics (20.2%) and surgery (14.5%). Deceased patients, surgical
patients and patients where body temperature was not recorded were excluded from the following analysis.
Table 1: Patient characteristics upon admission
Page 4/24Total Triage Adult emergency Paediatric emergency
room room
Total Number of Patients N 4317 2616 1178 523
General Characteristics
Median Age – years (IQR) 27 (11-45) 29 (16-45) 35 (23-55) 1 (1-4)
Male Sex – n/N (%) 2121/4317 (49.1) 1134/2616 691/1178 (58.7) 296/523 (56.6)
(43.3)
Female Sex – n/N (%) 2193/4317 (50.8) 1482/2616 484/1178 (41.1) 227/523 (43.4)
(56.7)
Sex not registered – n/N (%) 3/4317 (0.1) 0/2616 (0.0) 3/1178 (0.3) 0/523 (0.0)
Residence in urban area – n/N 3375/4317 (78.2) 2127/2616 863/1178 (73.3) 385/523 (73.6)
(%) (81.3)
Residence in rural area – n/N (%) 795/4317 (18.4) 487/2616 183/1178 (15.5) 125/523 (23.9)
(18.6)
Residence not registered – n/N 147/4317 (3.4) 2/2616 (0.1) 132/1178 (11.2) 13/523 (2.5)
(%)
Referred Service
Internal Medicine – n/N (%) 1527/4317 (35.4) 840/2616 687/1178 (58.3) 0/523 (0.0)
(32.1)
Paediatrics – n/N (%) 872/4317 (20.2) 360/2616 0/1178 (0.0) 512/523 (97.9)
(13.8)
Surgery – n/N (%) 625/4317 (14.5) 190/2616 (7.3) 435/1178 (36.9) 0/523 (0.0)
Ophthalmology – n/N (%) 446/4317 (10.3) 446/2616 0/1178 (0.0) 0/523 (0.0)
(17.0)
Gynaecology – n/N (%) 353/4317 (8.2) 353/2616 0/1178 (0.0) 0/523 (0.0)
(13.5)
Dental Clinic – n/N (%) 220/4317 (5.1) 220/2616 (8.4) 0/1178 (0.0) 0/523 (0.0)
Ear Nose Throat (ENT) Clinic– 182/4317 (4.2) 182/2616 (7.0) 0/1178 (0.0) 0/523 (0.0)
n/N (%)
Not recorded – n/N (%) 25/4317 (0.6) 25/2616 (1.0) 0/1178 (0.0) 0/523 (0.0)
Deceased during treatment – n/N 67/4317 (1.6) 0/2616 (0.0) 56/1178 (4.8) 11/523 (2.1)
(%)
Body Temperatureand non-febrile children: 50.0% of all children (47.1% febrile vs 52.5% non-febrile, p = 0.277) received a negative mRDT result and 49.8% (52.4%
febrile vs. 47.5% non-febrile, p = 0.319) a positive result.
Table 2: Clinical features of febrile vs. non-febrile medical adult and paediatric emergency patients
Page 6/24Total Adult medical patients Paediatric medical patients
Total Febrile Non- p-value Total Febrile Non- p-value
N=164 febrile N=227 febrile
N=465 N=263
Total Number of Patients 1119 629 164/629 465/629 490 227/490 263/490
N – n/N (%) (26.1) (73.9) (46.3) (53.7)
Most frequent symptoms
(besides fever)
General symptoms
Asthenia – n/N (%) 589/1119 250/629 82/164 168/465 0.002 339/490 163/227 176/263 0.281
(52.6) (39.7) (50.0) (36.1) (69.2) (71.8) (66.9)
Loss of appetite – n/N (%) 413/1119 158/629 50/164 108/465 0.075 255/490 123/227 132/263 0.415
(36.9) (25.1) (30.5) (23.2) (52.0) (54.2) (50.2)
Headache – n/N (%) 194/1119 171/629 46/164 125/465 0.761 23/490 12/227 11/263 1.000
(17.3) (27.2) (28.0) (26.9) (4.7) (5.3) (4.2)
Dizziness – n/N (%) 113/1119 112/629 33/164 79/465 0.406 1/490 0/227 1/263 1.000
(10.1) (17.8) (20.1) (17.0) (0.2) (0.0) (0.4)
Digestive symptoms
Vomiting – n/N (%) 345/1119 111/629 35/164 76/465 0.094 234/490 98/227 136/263 0.070
(30.8) (17.6) (21.3) (16.3) (47.8) (43.2) (62.0)
Diarrhoea – n/N (%) 224/1119 78/629 29/164 49/465 0.020 146/490 65/227 81/263 0.622
(20.0) (12.4) (17.7) (10.5) (29.8) (28.6) (30.8)
Abdominal pain – n/N (%) 221/1119 176/629 40/164 136/465 0.266 45/490 21/227 24/263 1.000
(19.7) (28.0) (24.4) (29.2) (9.2) (9.3) (9.1)
Respiratory symptoms
Cough – n/N (%) 339/1119 93/629 42/164 51/465(58.1) (50.2) (54.3) (48.8) (68.2) (65.6) (70.3)
Metronidazole – n/N (%) 189/1119 69/629 18/164 51/465 1.000 120/490 54/227 66/263 0.753
(16.9) (11.0) (11.0) (11.0) (24.5) (23.8) (25.1)
Gentamycin – n/N (%) 103/1119 1/629 1/164 0/465 1.000 102/490 46/227 56/263 0.824
(9.2) (0.2) (1.0) (0.0) (20.8) (20.3) (21.3)
Ceftriaxone – n/N (%) 97/1119 47/629 13/164 34/465 0.863 50/490 23/227 27/263 1.000
(8.7) (7.5) (6.7) (7.3) (10.2) (10.1) (10.3)
Amoxicillin – n/N (%) 22/1119 6/629 1/164 5/465 1.000 16/490 4/227 12/263 0.124
(2.0) (1.0) (1.0) (1.1) (3.3) (1.8) (4.6)
Ciprofloxacin – n/N (%) 8/1119 7/629 2/164 5/465 1.000 1/490 1/227 0/263 0.463
(0.7) (1.1) (1.2) (1.1) (0.2) (0.4) (0.0)
Antipyretic/Analgesic
Paracetamol – n/N (%) 514/1119 350/629 119/164 231/465adults (26.4% adults vs. 11.2% children). However, febrile children were signi cantly more likely to die during hospitalization than non-febrile
children (18.5% vs. 5.1%, p < 0.001), which only reached a level of a trend for adult inpatients (29.8% vs. 25.0%, p = 0.404).
The most frequent diagnostic tests performed amongst all inpatients were mRDT (78.6%; 558/710), thick blood smear (TBS, 38.3%; 272/710),
Widal TO/TH test (23.7%; 168/719) and HIV antibody screening test (8.7%; 62/710), which was mainly used in adult inpatients. Overall, there
were no signi cant differences in the proportion of positive malaria tests between febrile and non-febrile patients. MRDT were positive in 6.3%
(20/318) of all adult inpatients (6.6% febrile vs. 8% non-febrile, p = 1.000) and in 48% (188/392) of all paediatric inpatients (50.6% febrile vs.
45.8% non-febrile, p = 0.416). TBS showed presence of P. falciparum in 4.4% (14/318) of adult inpatients (4.3% febrile vs. 4.5% non-febrile, p =
1.000) and in 8.7% (34/392) of paediatric inpatients (9.6% febrile vs. 7.9% non-febrile, p = 0.594).
Table 3: Diagnostics, diagnoses and outcomes of febrile vs. non-febrile medical adult and paediatric inpatients
Page 9/24Total Adult medical inpatients Paediatric inpatients Comments
Total Febrile Non- p-value Total Febrile Non- p-value
N=94 febrile N=178 febrile
N=224 N=214
Total Number 710 318 94/318 224/318 392 178/392 214/392
of Patients N – (29.6) (70.4) (45.4) (54.6)
n/N (%)
Days 4.3 5.3 5.9 5.0 3.3 3.5 3.2
hospitalized – (3.0) (4.0) (4.1) (3.9) (2.0) (1.8) (2.1)
Mean in days
(SD)
Most frequently
performed
diagnostics
Malaria rapid Malaria in
diagnostic test Guinea is
(mRDT) assumed to be
caused by P.
falciparum
only.
Positive – n/N 208/710 20/318 6/94 14/224 1.000 188/392 90/178 98/214 0.416
(%) (29.3) (6.3) (6.4) (8.0) (48.0) (50.6) (45.8)
Negative – n/N 350/710 148/318 59/94 89/224infection) – n/N
(%)
Normal – n/N 3/710 0/318 0/94 0/224 3/392 1/178 2/214 1.000
(%) (0.4) (0.0) (0.0) (0.0) (0.8) (0.6) (0.9)
Stool There are no
microscopy other
parasites diagnostic tests
available for
recognizing
common
parasitic
infection .
Positive – n/N 3/710 2/318 1/94 1/224 0.504 1/392 0/178 1/214 1.000
(%) (0.4) (0.6) (1.1) (0.4) (0.3) (0.0) (0.5)
Negative – n/N 18/710 10/318 2/94 8/224 0.729 8/392 4/178 4/214 1.000
(%) (2.5) (3.1) (2.1) (3.6) (2.0) (2.2) (1.9)
HIV antibody HIV Antigen
test tests are used
to diagnose
HIV. If positive,
patients are
referred to the
HIV clinic for
further PCR
testing.
Positive – n/N 20/710 20/318 11/94 9/224 0.020 0/392 0/178 0/214
(%) (2.8) (6.3) (11.7) (4.0) (0.0) (0.0) (0.0)
Negative – n/N 42/710 41/318 16/94 25/224 0.198 1/392 1/178 0/214 0.455
(%) (5.9) (12.9) (17.0) (11.2) (0.3) (0.6) (0.0)
Syphilis TPHA Only TPHA
screening test is
used,
confirmation
test was
unavailable
during time of
study.
Positive – n/N 8/710 8/318 2/94 6/224 1.000 0/392 0/178 0/214
(%) (1.1) (2.5) (2.1) (2.7) (0.0) (0.0) (0.0)
Negative – n/N 26/710 25/318 9/94 16/224 0.496 1/392 1/178 0/214 0.455
(%) (4.1) (7.9) (9.6) (7.1) (0.3) (0.6) (0.0)
Toxoplasmosis
IgG/IgM
Positive – n/N 5/710 5/318 2/94 3/224 0.634 0/392 0/178 0/214
(%) (0.7) (1.6) (2.1) (1.3) (0.0) (0.0) (0.0)
Negative – n/N 4/710 4/318 0/94 4/224 0.323 0/392 0/178 0/214
(%) (0.6) (1.3) (0.0) (1.8) (0.0) (0.0) (0.0)
Sputum Pulmonary
Tuberculosis tuberculosis is
usually
diagnosed and
treated by the
external
tuberculosis
Page 11/24clinic. Suspect
cases are
referred.
Positive – n/N 1/710 1/318 0/94 1/224 1.000 0/392 0/178 0/214
(%) (0.1) (0.3) (0.0) (0.4) (0.0) (0.0) (0.0)
Negative – n/N 3/710 3/318 1/94 2/224 1.000 0/392 0/178 0/214
(%) (0.4) (0.9) (1.1) (0.9) (0.0) (0.0) (0.0)
Anti-
streptolysin O
Positive – n/N 17/710 12/318 4/94 8/224 0.754 5/392 3/178 2/214 0.663
(%) (2.4) (3.8) (4.3) (3.6) (1.3) (1.7) (0.1)
Negative – n/N 10/710 9/318 3/94 6/224 0.727 1/392 1/178 0/214 0.455
(%) (1.4) 2.8) (3.2) (2.7) (0.3) (0.6) (0.0)
Hbs Antigen Hepatitis B
surface antigen
is used to
diagnose active
Hepatitis B.
Other
diagnostic tests
are not
available.
Positive – n/N 7/710 7/318 1/94 6/224 0.678 0/392 0/178 0/214
(%) (1.0) (2.2) (1.1) (2.7) (0.0) (0.0) (0.0)
Negative – n/N 19/710 19/318 6/94 13/224 0.801 0/392 0/178 0/214
(%) (2.7) (6.0) (6.4) (5.8) (0.0) (0.0) (0.0)
Most frequent
discharge
diagnoses
Malaria – n/N 222/710 24/318 9/94 15/224 0.362 198/392 101/178 97/214 0.025 Diagnosis
(%) (31.3) (7.5) (9.6) (6.7) (50.5) (56.7) (45.3) based on
positive rapid
test result
and/or positive
thick blood
smear, or
clinical
presentation
only.
Respiratory 83/710 10/318 5/94 5/224 0.168 73/392 33/178 40/214 1.000 Diagnosis
infection – n/N (11.7) (3.1) (5.3) (2.2) (18.6) (18.5) (18.7) based on
(%) clinical
presentation
and
occasionally on
radiological
results; includes
all respiratory
infections other
than
tuberculosis.
Gastroenteritis 69/710 40/318 10/94 30/224 0.581 29/392 14/178 15/214 0.847 Diagnosis
– n/N (%) (9.7) (12.6) (10.6) (13.4) (7.4) (7.8) (7.0) based on
clinical
Page 12/24presentation
and/or on
Widal test
results.
Liver Disease 21/710 19/318 6/94 13/224 0.801 2/392 2/178 0/214 0.207 Diagnosis
(e.g. Hepatitis (3.0) 6.0) (6.4) (5.8) (0.5) (1.1) (0.0) based on
B) – n/N (%) clinical
presentation
and/or positive
Anti Hbs
results.
Meningitis – 4/710 2/318 2/94 0/224 0.087 2/392 2/178 0/214 0.207 Diagnosis
n/N (%) (0.6) (0.6) (2.1) (0.0) (0.5) (1.1) (0.0) based on
clinical
presentation
and/or
cerebrospinal
fluid results.
HIV – n/N (%) 21/710 21/318 10/94 11/224 0.081 0/392 0/178 0/214 Diagnosis
(3.0) (6.6) (10.6) (4.9) (0.0) (0.0) (0.0) based on
positive HIV
Antigen test
result, later
confirmed
through PCR at
external HIV
clinic.
Pulmonary 9/710 9/318 2/94 7/224 1.000 0/392 0/178 0/214 Diagnosis
Tuberculosis – (1.7) (2.8) (2.1) (3.1) (0.0) (0.0) (0.0) based on
n/N (%) clinical
presentation
and/or
radiological
findings and/or
sputum
analysis.
Gastroduodenal 14/710 14/318 1/94 13/224 0.073 0/392 0/178 0/214 Diagnosis
Ulcer – n/N (%) (2.0) (4.4) (1.2) (5.8) (0.0) (0.0) (0.0) based on
clinical
presentation
only.
Anaemia not 22/710 21/318 2/94 19/224 0.046 1/392 0/178 1/214 1.000 Diagnosis
specified – n/N (3.1) (6.6) (2.1) (8.5) (0.3) (0.0) (0.5) based on
(%) Haemoglobin
level without
evidence of
known cause.
Stroke – n/N 43/710 43/318 14/94 29/224 0.720 0/392 0/178 0/214 Diagnosis
(%) (6.1) (13.5) (14.9) (12.9) (0.0) (0.0) (0.0) based on
clinical
presentation
only.
Hypertension 10/710 10/318 0/94 10/224 0.037 0/392 0/178 0/214 Diagnosis
not specified (1.4) (3.1) (0.0) (4.5) (0.0) (0.0) (0.0) based on
Page 13/24clinical
presentation
only.
Diabetes – n/N 16/710 16/318 4/94 12/224 0.786 0/392 0/178 0/214 Diagnosis
(%) (2.3) (5.0) (4.3) (5.4) (0.0) (0.0) (0.0) based on
fasting blood
sugar level.
Outcomes
Improvement of 403/710 140/318 43/94 97/224 0.712 263/392 115/178 148/214 0.207
health – n/N (56.8) (44.0) (45.7) (43.3) (67.1) (64.6) (69.2)
(%)
Transferred – 7/710 6/318 1/94 5/224 0.674 1/392 0/178 1/214 1.000
n/N (%) (1.0) (1.9) (1.1) (2.2) (0.3) (0.0) (0.5)
Deceased – n/N 128/710 84/318 28/94 56/224 0.404 44/392 33/178 11/214indicated infection with P. falciparum. Similarly, 91 of 710 patients (12.8%) received malaria as discharge diagnosis even though mRDT or TBS
did not indicate infection with P. falciparum.
Table 5: Malaria as nal diagnosis vs. malaria diagnostic test results
Total Adult medical inpatients Paediatric medical inpatients
Total Diagnosis Other p-value Total Diagnosis Other p-value
malaria diagnosis malaria diagnosis
N=24 N=294 N=198 N=194
Total Number of 710 318 24/318 294/318 392 198/392 194/392
Patients – n/N (%) (7.5) (92.5) (50.5) (45.5)
Patients with 208/710 20/318 7/24 13/294Discussion
With this study we hope to provide more insight into the local epidemiology of febrile illness in south-eastern Guinea, a region at high risk for
outbreaks of diseases with epidemic potential such as Ebola virus disease. We described the clinical and diagnostic characteristics, treatments
and outcomes of patients with febrile illness and compared them to non-febrile patients. Based on our ndings, we can point to some
management needs regarding diagnostic practices and treatments of febrile illness, side-lined by an estimation of the economic burden for
patients seeking healthcare.
Febrile illness is a frequent reason for patients seeking healthcare in south-eastern Guinea. During our study period, 9.5% of all patients had a
measured axillary body temperature ≥ 38°C upon hospital admission. During our study period, the typical febrile patient was admitted through
the emergency room, mostly the medical service. His/her most common reported accompanying symptoms were asthenia, loss of appetite,
headache, cough and abdominal pain. Together with fever, these symptoms guided clinicians towards suspecting the most common diseases
in the region: malaria, diarrheal diseases/gastroenteritis and respiratory infection [34].
Malaria
Since malaria (P. falciparum) is endemic in south-eastern Guinea, it is evidently assumed to be the most common cause for febrile illness [35].
Ruling out malaria in febrile patients is a primary task for emergency medicine in the region [6, 10]. While mRDT are commonly used for this
task, our study shows that mRDT test results do not necessarily correspond to malaria as suspected or discharge diagnoses. Furthermore, a
large proportion of mRDT test results do not correspond to TBS results. In our study, 12.8% of all patients received malaria as discharge
diagnosis despite negative diagnostic test results. Thus, point-of-care and laboratory diagnostic procedures seem to be only partly relevant
when diagnosing malaria in south-eastern Guinea. Studies have indicated that mRDT and TBS in eld settings miss roughly between 10–20%
of malaria infections [36, 37]. This means that clinical experience is, at times, an important factor when diagnosing malaria. However, it has
been pointed out that the practice of misdiagnosing malaria – due to malaria being the most ready-at-hand diagnosis for febrile illness – plays
an equally important role in low-resource African healthcare settings and leads to an over-consumption of resources as well as more
antimalarial drug resistance development [38, 39]. Since our study is only descriptive in regard to local diagnostic practices of febrile illness, we
cannot ascertain true or false positive malaria cases. We can only emphasize that in malaria endemic regions at high risk for outbreaks of less
common but highly infectious diseases with epidemic potential, investigation into the causes for febrile illness should at times go beyond the
most probable entity, here malaria. This is in agreement with the Guinean national guidelines regarding malaria: when mRDT or TBS rule out
malaria as the cause for febrile illness, other causes should be considered and investigated [40]. Furthermore, the assumed index case of the
2021 Ebola outbreak in south-eastern Guinea went unrecognized and was reportedly only treated against malaria by a number of different
clinics as mRDT indicated infection with P. falciparum. Already the 2014–2016 West African Ebola virus epidemic has produced studies
highlighting the relevance of malaria-sensitive screening tools for non-malarial illness such as Ebola virus disease and cases with coinfection
[41, 42].
Salmonella gastroenteritis
Besides malaria, salmonella gastroenteritis/typhoid as diarrheal disease is another common diagnosis in south-eastern Guinea in patients with
febrile illness, especially in adults. Widal TO/TH agglutination test is widely used and plays a major role in ascertaining this diagnosis. While
this low-cost point-of-care test may be indicative of enteric fever in certain clinical situations and may be used according to Guinean national
guidelines, its use is often discouraged due to its low speci city [43, 44]. In our study, 18.2% of all inpatients had a positive Widal TO/TH test
result and a considerable proportion of patients was treated with antimicrobial drugs commonly used for gastroenteritis, namely ampicillin,
metronidazole and ceftriaxone. A false diagnosis of enteric fever through Widal TO/TH agglutination test may result in the unnecessary use of
antimicrobial drugs and provoke the development of drug-resistant bacteria [45, 46]. Moreover, it may lead to the non-consideration of diseases
with epidemic potential as the cause for febrile illness [47]. Further strengthening of diagnostic capacities, particularly the possibility to perform
blood cultures and antibiograms would undoubtedly improve identi cation and treatment of febrile illnesses caused by common
gastrointestinal and systemic diseases.
Respiratory infection/pneumonia
The third most important infectious disease entity frequently assumed in febrile patients is respiratory infection/pneumonia, especially in
children. Due to the high fees and therefore low use of radiological imaging (x-ray), calculated antimicrobial treatment is the default option for
suspected respiratory infection/pneumonia. Other diagnostic tests for respiratory infections such as sputum cultures are only used sporadically.
Our study shows that a large majority of patients (58.1%) is treated with ampicillin and only rarely with amoxicillin. National guidelines
recommend the use of amoxicillin for the treatment of respiratory infections. One reason for the observed preference of ampicillin over
amoxicillin might be the fact that it can be administered intravenously, which is the case for its use at the HRNZ, as it is the case for the use of
paracetamol at the HRNZ as well. Social scienti c research on vaccination in Guinea has shown that Guineans favour intravenous application
of therapeutic agents because local understandings of medical therapies attribute a higher power and e cacy to injections over orally
Page 16/24administered medications [48]. However, excessive use of these antimicrobial agents against respiratory infections may lead to drug resistance
[49, 50]. In addition, unnecessary parenteral application of antibiotics and other medications bears higher risks of complications such as
venous catheter infections. We believe that Guinean healthcare structures could highly bene t from antimicrobial stewardship programs
speci cally designed for low-resource settings [51].
Inpatient mortality and healthcare expenses
During our study period, overall mortality of adult and paediatric medical inpatients was fairly high (18.0%) and even higher for febrile patients
in comparison to non-febrile patients. Inpatient mortality in West African hospitals are roughly between 5–25% even though comparison of
mortality rates is di cult due do different reporting practices and varying mortality rates in different services [52–55]. Nevertheless, our reported
inpatient mortality rate is considerable and speaks to a wide array of interconnected issues such as patient morbidity, underlying factors
regarding health-seeking behaviour and the quality of healthcare in some West African countries [56]. One particular reason for the delayed
treatment of patients – a factor causing increased mortality for certain diseases – is economic constraint coupled with high out-of-pocket user
fees in proportion to income [57–59]. We calculated that an adult inpatient spends roughly around 6.5% (in children 4.4%) of the per capita
gross national income in Guinea as in 2018 [60]. This measures up to an enormous economic burden on inpatients and their families. Structural
improvements in healthcare such as enhanced diagnostic capacities and advances in treatments for certain diseases as currently envisaged in
post-Ebola Guinea must go hand in hand with propositions for better access [61].
Limitations of the study
The rst limitation of our study is the fact that we only collected patient data at one particular hospital. This reduces generalizability of our
ndings. However, the epidemiology, the socio-economic conditions and healthcare provision in the little-accessible border region of south-
eastern Guinea, Sierra Leone and Liberia are fairly similar and we thus believe that our ndings are very important for this high-risk zone for
outbreaks of diseases with epidemic potential [62].
Second, a study period of three months is relatively short. Our data does not capture seasonal disease patterns potentially causing a changing
epidemiology of febrile illness. Data was collected during the dry season where transmission of malaria is usually lower than in the wet season,
meaning that the average annual proportion of diagnosed malaria and positive malaria tests may actually be higher than reported in our study
[63].
Third, our study was not designed to verify the aetiology of febrile illness in patients. Its aim was simply to describe the local epidemiology of
febrile illness as it is produced in a low-resource setting.
Despite its disadvantages, we believe that the advantage of this approach is that it increases understanding of local clinical practices and
highlights potential sites for improvement.
Fourth, our calculation regarding average inpatient expenses rely on a rough estimation on fees for medicines. We were only able to review the
amount of medications each inpatient used but not the speci c medications themselves. We adjusted average prices for medicines by
eliminating the ten most expansive medications from our calculations to reduce skewing and hence risk of over-reporting medication fees.
Nevertheless, our calculations remain rough estimates and should only be understood as a means to underscore the high economic burden of
inpatient care.
Conclusions
Our study highlights the importance of malaria, salmonella gastroenteritis/typhoid and respiratory infection in patients with febrile illness in
south-eastern Guinea. These diseases are mainly diagnosed on clinical grounds and rapid point-of-care diagnostic tests. Common serological
and other diagnostic measures to ascertain aetiology of febrile illness are rarely used or only partially regarded. This practice risks to miss
signal cases of highly infectious diseases such as Ebola virus disease. Diagnostic capacities in regions at risk for diseases with epidemic
potential, such as south-eastern Guinea, should thus be enhanced. Furthermore, antimicrobial medications play a major role in treating febrile
illness, increasing the possibility for drug resistance. Guinean hospitals would bene t from antimicrobial stewardship. Patients with febrile
illness have a high inpatient mortality rate and the economic burden of inpatient care on patients and families is considerable. This underscores
the importance of linking structural improvements in healthcare provision to increased access to healthcare.
Abbreviations
GNF: Guinean francs
HIV: Human immunode ciency virus
Page 17/24HRNZ: Hôpital Régional de N’zérékoré
mRDT: Malaria rapid diagnostic test
PPP: Purchasing power parity
TBS: Thick blood smear
USD: United States Dollar
Declarations
Ethics approval and consent to participate
Ethical approval for this study was granted by the Guinean Ethics Committee for Research in Health (opinion number 103/CNERS/18) and the
Ethics Committee for Medical Research at the Ludwig-Maximilians-Universität (LMU), Munich (opinion number 18-834). Before its
implementation, the study was presented to the regional health authorities and the HRN’Z directorate who both consented to its implementation.
As part of the hospital’s routine aggregate data collection, no informed consent was asked from patients upon admission for the cross-sectional
and retrospective data collection.
Consent for publication
Not applicable
Availability of data and material
Due to Guinean national regulations, patient-based datasets cannot be made freely accessible. Dataset can be provided, however, upon well-
reasoned request and upon clearance by the involved Guinean authorities. Requests should be addressed to the corresponding author.
Competing interests
The authors declare to have no competing interests.
Funding
MR was supported nancially through MeCuM International Scholarship by the Medical Department of the Ludwig-Maximilians-Universität
(LMU), Munich. The scholarship covered travel and living expenses during the research period. The funding body played no role in study design,
data collection, analysis, interpretation of ndings or writing.
Authors' contributions
MR, LP, DD and GF were responsible for conceiving the study. MR and DD executed the data collection. MR and GF analysed the data. MR wrote
the article. All authors read and reviewed the nal submitted version of this manuscript.
Acknowledgements
The authors would like to thank the regional health authorities of N’Zérékoré and the HRNZ for their collaboration. We further wish to
acknowledge all patients whose data was used for this study.
References
1. Prasad N, Murdoch DR, Reyburn H, Crump JA. Etiology of Severe Febrile Illness in Low- and Middle-Income Countries: A Systematic Review.
PLOS ONE. 2015;10:e0127962.
2. Prasad N, Sharples KJ, Murdoch DR, Crump JA. Community prevalence of fever and relationship with malaria among infants and children
in low-resource areas. Am J Trop Med Hyg. 2015;93:178–80.
Page 18/243. Crump JA, Newton PN, Baird SJ, Lubell Y. Febrile Illness in Adolescents and Adults. In: Holmes KK, Bertozzi S, Bloom BR, Jha P, editors.
Major Infectious Diseases. 3rd edition. Washington (DC): The International Bank for Reconstruction and Development / The World Bank;
2017. http://www.ncbi.nlm.nih.gov/books/NBK525177/. Accessed 21 Nov 2020.
4. Crump JA, Gove S, Parry CM. Management of adolescents and adults with febrile illness in resource limited areas. BMJ. 2011;343.
doi:10.1136/bmj.d4847.
5. Maze MJ, Bassat Q, Feasey NA, Mandomando I, Musicha P, Crump JA. The epidemiology of febrile illness in sub-Saharan Africa:
implications for diagnosis and management. Clin Microbiol Infect. 2018;24:808–14.
6. Guidelines for the treatment of malaria - Third edition. https://www.who.int/publications-detail-redirect/9789241549127. Accessed 31 Dec
2020.
7. Stoler J, Awandare GA. Febrile illness diagnostics and the malaria-industrial complex: a socio-environmental perspective. BMC Infec Dis.
2016;16:683.
8. Crump JA, Morrissey AB, Nicholson WL, Massung RF, Stoddard RA, Galloway RL, et al. Etiology of Severe Non-malaria Febrile Illness in
Northern Tanzania: A Prospective Cohort Study. PLOS Negl Trop Dis. 2013;7:e2324.
9. Petti CA, Polage CR, Quinn TC, Ronald AR, Sande MA. Laboratory medicine in Africa: a barrier to effective health care. Clin Infect Dis.
2006;42:377–82.
10. WHO | IMAI district clinician manual: Hospital care for adolescents and adults. WHO. https://www.who.int/hiv/pub/imai/imai2011/en/.
Accessed 31 Dec 2020.
11. Endy TP. Viral Febrile Illnesses and Emerging Pathogens. Hunter’s Tropical Medicine and Emerging Infectious Diseases. 2020:325–50.
12. Team WER. After Ebola in West Africa — Unpredictable Risks, Preventable Epidemics. N Engl J Med. 2016;375:587–96.
13. Rojek A, Horby P, Dunning J. Insights from clinical research completed during the west Africa Ebola virus disease epidemic. Lancet Infect
Dis. 2017;17:e280–92.
14. WHO Ebola Response Team. Ebola Virus Disease in West Africa — The First 9 Months of the Epidemic and Forward Projections. N Engl J
Med. 2014; 371:1481–1495
15. Pigott DM, Deshpande A, Letourneau I, Morozoff C, Reiner RC, Kraemer MUG, et al. Local, national, and regional viral haemorrhagic fever
pandemic potential in Africa: a multistage analysis. Lancet. 2017;390:2662–72.
16. Bausch DG, Schwarz L. Outbreak of Ebola Virus Disease in Guinea: Where Ecology Meets Economy. PLoS Negl Trop Dis. 2014;8.
doi:10.1371/journal.pntd.0003056.
17. Bausch DG, Demby AH, Coulibaly M, Kanu J, Goba A, Bah A, et al. Lassa Fever in Guinea: I. Epidemiology of Human Disease and Clinical
Observations. Vector-Borne Zoonot Dis. 2001;1:269–81.
18. Magassouba N, Koivogui E, Conde S, Kone M, Koropogui M, Soropogui B, et al. A Sporadic and Lethal Lassa Fever Case in Forest Guinea,
2019. Viruses. 2020;12:1062.
19. Kernéis S, Koivogui L, Magassouba N, Koulemou K, Lewis R, Aplogan A, et al. Prevalence and Risk Factors of Lassa Seropositivity in
Inhabitants of the Forest Region of Guinea: A Cross-Sectional Study. PLOS Negl Trop Dis. 2009;3:e548.
20. Fichet-Calvet E, Rogers DJ. Risk Maps of Lassa Fever in West Africa. PLOS Negl Trop Dis. 2009;3:e388.
21. World Health Organization. Clinical management of patients with viral haemorrhagic fever: a pocket guide for front-line health workers:
interim emergency guidance for country adaption. Geneva, Switzerland: World Health Organization; 2016.
22. Racsa LD, Kraft CS, Olinger GG, Hensley LE. Viral Hemorrhagic Fever Diagnostics. Clin Infect Dis. 2016;62:214–9.
23. Kortepeter MG, Bausch DG, Bray M. Basic Clinical and Laboratory Features of Filoviral Hemorrhagic Fever. J Infect Dis. 2011;204
suppl_3:S810–6.
24. Bah EI, Lamah M-C, Fletcher T, Jacob ST, Brett-Major DM, Sall AA, et al. Clinical Presentation of Patients with Ebola Virus Disease in
Conakry, Guinea. N Engl J Med. 2015;372:40–7.
25. Zunt JR, Kassebaum NJ, Blake N, Glennie L, Wright C, Nichols E, et al. Global, regional, and national burden of meningitis, 1990–2016: a
systematic analysis for the Global Burden of Disease Study 2016. Lancet Neurol. 2018;17:1061–82.
26. de Vries SG, Visser BJ, Nagel IM, Goris MGA, Hartskeerl RA, Grobusch MP. Leptospirosis in Sub-Saharan Africa: a systematic review. Int J
Infect Dis. 2014;28:47–64.
27. Zimmermann S, ter Meulen A, Calvet E, Koivogui L, Sylla O, Goris M, et al. Seroprevalence and reservoirs of leptospirosis in Conakry
(Guinea). Int J Antimicrob Agents. 2007;29:S49.
28. Jentes ES, Robinson J, Johnson BW, Conde I, Sakouvougui Y, Iverson J, et al. Acute Arboviral Infections in Guinea, West Africa, 2006. The
Am J Trop Med Hyg. 2010;83:388–94.
29. Butenko AM. Arbovirus circulation in the Republic of Guinea. Med Parazitol (Mosk). 1996;:40–5.
Page 19/2430. N Zerekore - Guinea - Area Database - Global Data Lab. https://globaldatalab.org/pro les/region/GINr108/. Accessed 22 Nov 2020.
31. Baize S, Pannetier D, Oestereich L, Rieger T, Koivogui L, Magassouba N, et al. Emergence of Zaire Ebola Virus Disease in Guinea. N Engl J
Med. 2014;371:1418–25.
32. Guinea: Information bulletin: Ebola Virus Disease Outbreak - Guinea. ReliefWeb. https://reliefweb.int/report/guinea/guinea-information-
bulletin-ebola-virus-disease-outbreak. Accessed 21 Feb 2021.
33. Raab M, Pfadenhauer LM, Nguyen V-K, Doumbouya D, Hoelscher M, Froeschl G. Period prevalence and identi cation challenges of viral
haemorrhagic fever suspect cases in a tertiary referral hospital in Guinea: a cross-sectional, retrospective study of triage and emergency
room patient pro les. BMC Infect Dis. 2020;20:838.
34. Mamady K, Hu G. A step forward for understanding the morbidity burden in Guinea: a national descriptive study. BMC Public Health.
2011;11:436.
35. World malaria report 2019. https://www.who.int/publications-detail-redirect/9789241565721. Accessed 23 Nov 2020.
36. Berzosa P, de Lucio A, Romay-Barja M, Herrador Z, González V, García L, et al. Comparison of three diagnostic methods (microscopy, RDT,
and PCR) for the detection of malaria parasites in representative samples from Equatorial Guinea. Malar J. 2018;17. doi:10.1186/s12936-
018-2481-4.
37. Mfuh KO, Achonduh-Atijegbe OA, Bekindaka ON, Esemu LF, Mbakop CD, Gandhi K, et al. A comparison of thick- lm microscopy, rapid
diagnostic test, and polymerase chain reaction for accurate diagnosis of Plasmodium falciparum malaria. Malar J. 2019;18:73.
38. Biso Z, Buonfrate D. When fever is not malaria. Lancet Glob Health. 2013;1:e11–2.
39. Chandler CI, Jones C, Boniface G, Juma K, Reyburn H, Whitty CJ. Guidelines and mindlines: why do clinical staff over-diagnose malaria in
Tanzania? A qualitative study. Malar J. 2008;7:53.
40. Ministry of Health, Guinea. Guide thérapeutique national. World Health Organization; 2013.
https://www.who.int/selection_medicines/country_lists/GuineeConakry_STG_2013.pdf. Accessed 30 Jan 2021.
41. de Wit E, Falzarano D, Onyango C, Rosenke K, Marzi A, Ochieng M, et al. The Merits of Malaria Diagnostics during an Ebola Virus Disease
Outbreak. Emerg Infect Dis. 2016;22:323–6.
42. Hartley M-A, Young A, Tran A-M, Okoni-Williams HH, Suma M, Mancuso B, et al. Predicting Ebola infection: A malaria-sensitive triage score
for Ebola virus disease. PLoS Negl Trop Dis. 2017;11. doi:10.1371/journal.pntd.0005356.
43. Mawazo A, Bwire GM, Matee MIN. Performance of Widal test and stool culture in the diagnosis of typhoid fever among suspected patients
in Dar es Salaam, Tanzania. BMC Res Notes. 2019;12:316.
44. WHO | Sensitivity and speci city of typhoid fever rapid antibody tests for laboratory diagnosis at two sub-Saharan African sites. WHO.
https://www.who.int/bulletin/volumes/89/9/11-087627/en/. Accessed 1 Jan 2021.
45. Ohanu ME, Iroezindu MO, Maduakor U, Onodugo OD, Gugnani HC. Typhoid fever among febrile Nigerian patients: Prevalence, diagnostic
performance of the Widal test and antibiotic multi-drug resistance. Malawi Med J. 2019;31:184–92.
46. Wasihun AG, Wlekidan LN, Gebremariam SA, Welderufael AL, Muthupandian S, Haile TD, et al. Diagnosis and Treatment of Typhoid Fever
and Associated Prevailing Drug Resistance in Northern Ethiopia. Int J Infect Dis. 2015;35:96–102.
47. Raab M, Pfadenhauer LM, Millimouno TJ, Hoelscher M, Froeschl G. Knowledge, attitudes and practices towards viral haemorrhagic fevers
amongst healthcare workers in urban and rural public healthcare facilities in the N’zérékoré prefecture, Guinea: a cross-sectional study.
BMC Public Health. 2020;20:296.
48. Leach MA, Fairhead JR, Millimouno D, Diallo AA. New therapeutic landscapes in Africa: Parental categories and practices in seeking infant
health in the Republic of Guinea. Soc Sci Med. 2008;66:2157–67.
49. Bernabé KJ, Langendorf C, Ford N, Ronat J-B, Murphy RA. Antimicrobial resistance in West Africa: a systematic review and meta-analysis.
Int J Antimicrob Agents. 2017.
50. Tadesse BT, Ashley EA, Ongarello S, Havumaki J, Wijegoonewardena M, González IJ, et al. Antimicrobial resistance in Africa: a systematic
review. BMC Infect Dis. 2017;17:616.
51. Pierce J, Apisarnthanarak A, Schellack N, Cornistein W, Maani AA, Adnan S, et al. Global Antimicrobial Stewardship with a Focus on Low-
and Middle-Income Countries: A position statement for the international society for infectious diseases. Int J Infect Dis. 2020;96:621–9.
52. Abhulimhen-Iyoha BI, Okolo AA. Morbidity and mortality of childhood illnesses at the emergency paediatric unit of the University of Benin
Teaching Hospital, Benin City. Niger J Paediatr. 2012;39:71-74-74.
53. Keita M, Koulibaly M, Soumah MM, Diané B, Tounkara TM, Camara AD, et al. Morbidité et mortalité hospitalières dans le service de
dermatologie-MST du CHU de Conakry(Guinée). Ann Dermatol Vénér. 2014;141:S356–7.
54. Okoroiwu HU, Uchendu KI, Essien RA. Causes of morbidity and mortality among patients admitted in a tertiary hospital in southern Nigeria:
A 6 year evaluation. PLOS ONE. 2020;15:e0237313.
Page 20/2455. Mortality Pattern at the Adult Medical Wards of a Teaching Hospital in Sub-Saharan Africa. https://medwelljournals.com/abstract/?
doi=ijtmed.2009.27.31. Accessed 1 Jan 2021.
56. Sardan J-PO de. Une médecine inhospitalière: Les Di ciles Relations entre soignants et soignés dans cinq capitales d’Afrique de l’Ouest.
Paris: Karthala; 2003.
57. Mhalu G, Weiss MG, Hella J, Mhimbira F, Mahongo E, Schindler C, et al. Explaining patient delay in healthcare seeking and loss to
diagnostic follow-up among patients with presumptive tuberculosis in Tanzania: a mixed-methods study. BMC Health Serv Res.
2019;19:217.
58. Kansiime C, Kiwuwa SM, Levi M, Asiimwe BB, Katamba A. Health service delay among pulmonary tuberculosis patients presenting to a
National Referral Hospital, Kampala, Uganda: a cross sectional study. Pan Afr Med J. 2013;15:84.
59. Gilson L, McIntyre D. Removing user fees for primary care in Africa: the need for careful action. BMJ. 2005;331:762–5.
60. GNI per capita, Atlas method (current US$) - Guinea | Data. https://data.worldbank.org/indicator/NY.GNP.PCAP.CD?locations=GN .
Accessed 1 Jan 2021.
61. Kim JY, Farmer P, Porter ME. Rede ning global health-care delivery. Lancet. 2013;382:1060–9.
62. Boozary AS, Farmer PE, Jha AK. The Ebola Outbreak, Fragile Health Systems, and Quality as a Cure. JAMA. 2014;312:1859–60.
63. Magombedze G, Ferguson NM, Ghani AC. A trade-off between dry season survival longevity and wet season high net reproduction can
explain the persistence of Anopheles mosquitoes. Parasites Vectors. 2018;11:576.
Figures
Figure 1
Proportions of non-febrile and febrile patients by age group
Page 21/24Figure 2
Suspected diagnosis group in medical adult emergency patients
Page 22/24Figure 3
Suspected diagnosis group in medical paediatric emergency patients
Figure 4
Study ow chart
Figure 5
Proportions of diagnosed infectious diseases in medical adult patients]
Page 23/24Figure 6
Proportions of diagnosed infectious diseases in medical paediatric patients
Page 24/24You can also read