Employment Guaranteed? Social Protection during a Pandemic - IZA DP No. 14099 FEBRUARY 2021 - Institute of Labor Economics
←
→
Page content transcription
If your browser does not render page correctly, please read the page content below
DISCUSSION PAPER SERIES

IZA DP No. 14099

Employment Guaranteed?
Social Protection during a Pandemic

Farzana Afridi
Kanika Mahajan
Nikita Sangwan

FEBRUARY 2021
DISCUSSION PAPER SERIES

IZA DP No. 14099

Employment Guaranteed?
Social Protection during a Pandemic

Farzana Afridi                                                 Nikita Sangwan
Indian Statistical Institute and IZA                           Indian Statistical Institute
Kanika Mahajan
Ashoka University

FEBRUARY 2021

Any opinions expressed in this paper are those of the author(s) and not those of IZA. Research published in this series may
include views on policy, but IZA takes no institutional policy positions. The IZA research network is committed to the IZA
Guiding Principles of Research Integrity.
The IZA Institute of Labor Economics is an independent economic research institute that conducts research in labor economics
and offers evidence-based policy advice on labor market issues. Supported by the Deutsche Post Foundation, IZA runs the
world’s largest network of economists, whose research aims to provide answers to the global labor market challenges of our
time. Our key objective is to build bridges between academic research, policymakers and society.
IZA Discussion Papers often represent preliminary work and are circulated to encourage discussion. Citation of such a paper
should account for its provisional character. A revised version may be available directly from the author.

                                                     ISSN: 2365-9793

                                           IZA – Institute of Labor Economics
Schaumburg-Lippe-Straße 5–9                      Phone: +49-228-3894-0
53113 Bonn, Germany                             Email: publications@iza.org                                    www.iza.org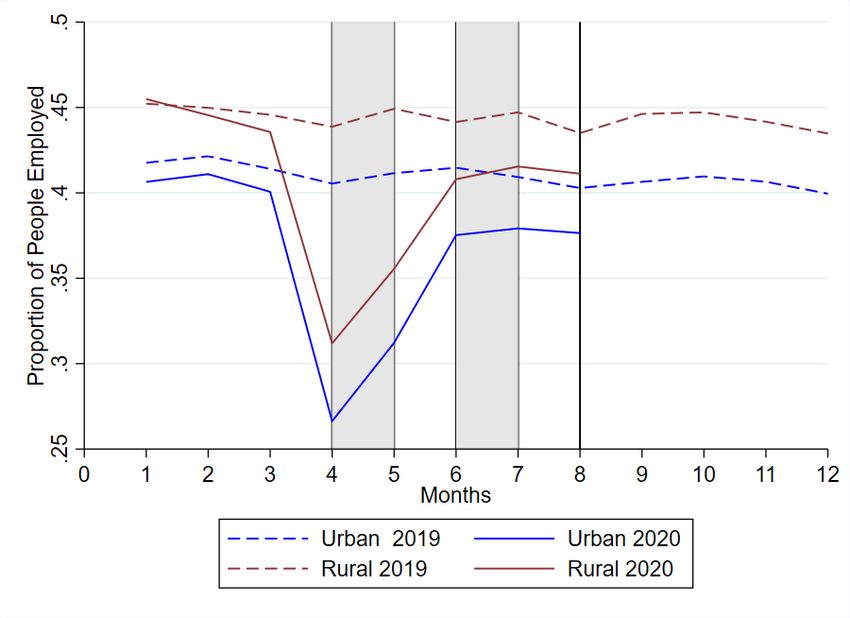
IZA DP No. 14099                                                                                                            FEBRUARY 2021

            ABSTRACT
            Employment Guaranteed?
            Social Protection during a Pandemic*
            The Covid-19 pandemic has highlighted the potential of social protection programs
            in mitigating labor market shocks. We examine the role of one of the world’s largest
            employment guarantee schemes, India’s MG-NREGA, in cushioning job losses in one of the
            worst affected economies due to the pandemic. Our findings indicate that regions with
            greater historical state capacity to provide public workdays under the scheme generated
            relatively higher employment during the pandemic. Consequently, an increase in state
            capacity by one MG-NREGA workday per rural inhabitant in a district reduced job losses in
            rural areas in April-August 2020 by 7% overall and by 74% for rural women, over baseline
            employment rate. These cushioning effects strengthened as the mobility restrictions eased
            and were larger for women who were less mobile and less skilled. Our results suggest that
            employment guarantee programs can protect livelihoods, but for certain demographic
            groups relatively more than others depending on the nature and skill level of work offered.

            JEL Classification:               J68, H31
            Keywords:                         employment, COVID-19, public employment guarantee,
                                              MG-NREGA, women

            Corresponding author:
            Farzana Afridi
            Indian Statistical Institute
            Economics and Planning Unit
            7, S.J.S. Sansanwal Marg
            New Delhi 110016
            India
            E-mail: fafridi@isid.ac.in

            * The authors thank Swati Dhingra and participants at CMIE seminar for insightful feedback. Bishakha Barman
            provided excellent research assistance. Financial support for this project was provided by a sub-award to the ISI by
            IWWAGE-IFMR, a Bill and Melinda Gates Foundation initiative. Usual disclaimers apply.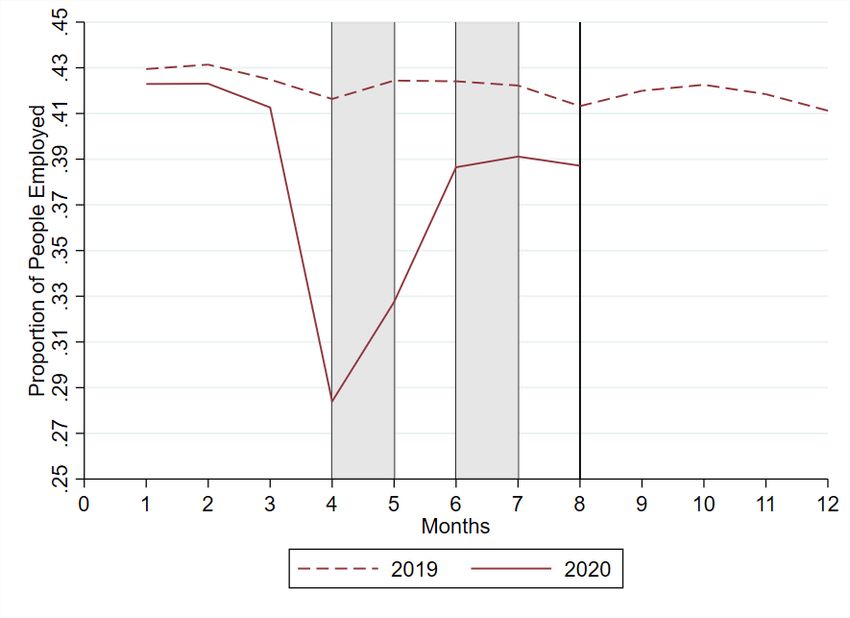
1.     Introduction

The Covid-19 pandemic is an unprecedented health and economic shock to the world economy.

Most major economies are in recession and unemployment has peaked, demanding a response from

policy makers that ensures sustainable economic recovery. Social safety nets - a somewhat neglected

policy tool - such as employment guarantees, unemployment insurance, Universal Basic Income

(UBI) - are once again being debated.1 Furthermore, ongoing research on the pandemic suggests

that economic impacts differ across demographic groups, but there is limited evidence on both the

role played by social safety nets on stemming labor market disruptions as well as their impacts

across population groups, which may well vary depending on the design of programs. For instance,

unlike a UBI that would not distinguish between working and dependent populations, employment

guarantees provide support during labor market shocks to the workforce, potentially impacting

productivity and bolstering demand by enhancing incomes (Devereux, 2002).2 In addition, the

benefits of employment guarantee schemes may differ by worker characteristics, depending on the

nature of work offered and skills required.

     We measure the impact of the pandemic induced shutdown in one of the worst affected economies

due to the crisis - India. We first assess the dynamic effects on individuals’ employment status during

the period April-August 2020 - Phase 1 of stringent mobility restrictions (April-May), with gradual

easing in Phase 2 (June-July) and full relaxation in Phase 3 (August). We then examine the role

of the nation-wide Mahatma Gandhi National Rural Employment Guarantee Act (MG-NREGA),

the world’s largest employment guarantee program initiated in 2006 and bolstered following the

pandemic, in cushioning job losses overall and as the stringency of the restrictions eased during

April-August 2020. To address the endogeneity of workdays generated under the program during

the pandemic, we use historical data on employment generation under MG-NREGA in a district

over five years, from 2014-18, to measure the capacity of the state to provide social protection

during this crisis.

     Using nation-wide, individual level panel data with over a million observations and employing

    1
      An ILO report discusses the various schemes implemented in the Asia-Pacific region during this pandemic.
Rees-Jones et al. (2020) review various social safety nets in Europe and the United States.
    2
      Pissarides (1992) shows that a short negative employment shock can lengthen unemployment duration leading
to potential loss of skills and further ”thinning” of the labor market as human capital of the labor force erodes. Hence
there can be long-term implications of even short episodes of economic downturn.

                                                           2
an approach akin to a difference-in-differences (DID) estimation strategy that compares changes in
employment status pre (2019) and post (2020) pandemic, during January-March (control months)
and April-August (treated months), we find that individual level employment fell precipitously
during the lockdown phase of April-May 2020 relative to January-March 2020, compared to the
change over the same period in 2019. Employment showed a V-shaped recovery post the lockdown
(April-May) with easing of mobility restrictions (June-July) but tapered off and continued to remain
below the pre-pandemic level as the economy reopened (August).
The DID estimates indicate that historical program capacity stemmed employment loss in rural
areas and women therein, during this period. We find that an increase in state capacity to provide
MG-NREGA by one day per rural inhabitant (approximately moving a district from 50th to 95th
percentile of the MG-NREGA historical state capacity distribution) in a month reduced job losses
in rural areas during April-August by 3.1 percentage points (pp) overall or 7% over the baseline
employment rate. Rural women’s employment increased relatively, by 8.6 pp or 74%, suggesting
that not only were employment losses for women stemmed, women who were previously not in the
labor force may have entered the labor market during the crisis in high state capacity districts. On
the other hand, the effect on rural men’s employment while positive, was small and insignificant.
Overall, high historical state capacity to provide MG-NREGA cushioned job losses more in rural
areas in Phase 3 (August 2020) - by 4.8 pp or by 10.8%, and 13.1 pp or almost 100% for rural
women. These findings are robust to individual level heterogeneity, district and occupation specific
trends.
To the best of our knowledge, this is the first paper to evaluate the effectiveness of a pre-existing
public employment guarantee on nation-wide employment during the Covid-19 pandemic.3 Our
findings are validated by smaller, bespoke studies conducted during the pandemic. Using survey
data from urban India Dhingra & Machin (2020) find that workers with a job guarantee before
the crisis were 5 pp more likely to remain employed. A choice experiment with the same sample
suggests low-wage workers were willing to work at 25% lower wage if their job can be guaranteed
while women were significantly more likely to prefer a guaranteed job than men. While previous
3
Studies suggest buffering (but perhaps small) effects of unemployment insurance during Covid-19 crisis on
employment and income in the context of the U.S. (Altonji et al. (2020), East & Simon (2020), Moffitt & Ziliak
(2020), Farrell et al. (2020)) but assessment of labor market impacts of social safety nets are largely absent for
developing countries.
3research has highlighted the role of MG-NREGA on women’s workforce participation due to its
mandated reservation of jobs for women, equal pay and access to work close to home (Afridi et al.,
2016), our results are also consistent with the role of women’s jobs as insurance (Sabarwal et al.,
2011) and the counter cyclicality of women’s labor force participation in developing countries (e.g.
during the debt crises in Latin America in the 1990s (Skoufias & Parker, 2006)). Indeed, we find
that MG-NREGA disproportionately benefited married women, women belonging to households
with young children and less educated women during the crisis - markers of lower mobility and
skills - and irrespective of their pre-crisis employment status.
Our findings have important policy implications. First, we show that employment guarantees
can play a role in shielding job losses and aiding recovery from a negative economic shock. Sec-
ond, the results highlight the relevance of the design of the employment guarantees in contributing
towards their effectiveness. While rural areas and women - the less skilled and less mobile - bene-
fited disproportionately from the low-wage, unskilled employment under MG-NREGA, such social
protection eluded urban areas. Thus, the nature of work and required skills can determine relative
benefits by demographic groups. Finally, our research contributes to the emerging literature on the
relevance of state capacity in the development process (Muralidharan et al., 2016) by indicating
that state capacity to utilise public funds might be a critical determinant of governments’ ability
to respond quickly to economic crises.
The remainder of the paper is organised as follows. Section 2 discusses the time of the crisis in
India and the job guarantee program. We provide details of the data in Section 3. The methodology
and results are in Section 4 and Section 5, respectively. Section 6 concludes.
2. Background
2.1. Timeline
The Indian government ordered a stringent national shutdown to deal with the COVID-19 pan-
demic, on 24 March 2020 until April 14, which was later extended to May 30 (Phase 1). In fact,
India imposed one of the strictest lockdowns, restricting all economic activity except those deemed
essential (Balajee et al., 2020), with just 500 reported and confirmed COVID cases at the time of
the lockdown announcement. Phased reopening was initiated from June 8. This was followed by
4gradual easing of restrictions on mobility in June and further easing in night curfew and domestic
air travel from July (Phase 2). From August 1, Phase 3 of ‘unlockdown’ with removal of night
curfew saw further relaxations of restrictions on economic activity and mobility.4
As a consequence of the shutdown, the impact on economic activity across the country was
catastrophic and the country entered a recession. India’s GDP contracted by 23.9% during April-
June and 7.5% in the second quarter (July-September) of the 2020-21 fiscal year as opposed to
4.2% growth in the GDP in 2019-20.5
2.2. MG-NREGA
The Mahatma Gandhi National Rural Employment Guarantee Act (MG-NREGA) mandates pro-
vision of 100 days of manual work on publicly funded projects (e.g. rural infrastructure such as
irrigation canals and roads) to rural households in India. The Act envisions a rights based ap-
proach - rural adults can demand work at a mandated minimum wage. The program was initially
implemented in the country’s poorest 200 districts in February 2006, with 130 additional districts
added in the next stage (2007) and national coverage thereafter (2008). In 2018, the Act provided
employment to almost 76 million individuals at an annual expenditure of more than Rs. 60,000
crores (or USD 9 billion), making it one of the most ambitious employment generation programs
in the world. The Act also mandates reservation of 1/3rd of jobs in each MG-NREGA project for
women.
Post the national shutdown on March 24, 2020, the provision of employment under the program
also came to a halt. On April 15, 2020, however, the Government of India ordered activities related
to the MG-NREGA to resume. It also increased allocation to the program’s budget by Rs 40,000
crore. Consequently the program generated 2.02 billion person days of work until September 2020,
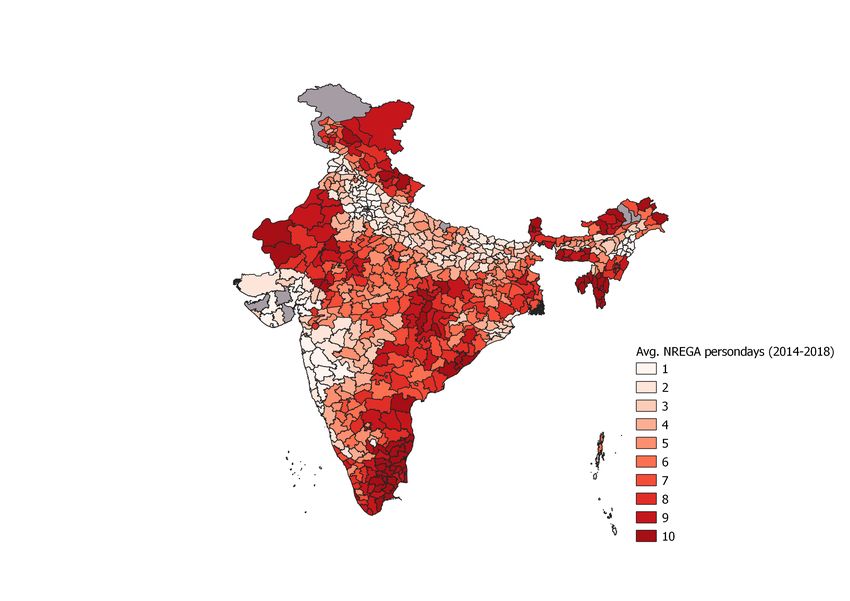
compared with 1.88 billion for the entire fiscal year of 2019-20. Figure 1a shows the district level
monthly average person days of work (from the MG-NREGA Public Data portal) per rural inhab-
itant (from Census 2011) generated under the scheme in 2020 and 2019.6 The gender allocation of
4
See: The Indian Express.
5
See: The Indian Express.
6
https://nregarep2.nic.in/netnrega/dynamic2/DynamicReport_new4.aspx. Figure 1a shows that the average
work days generated were similar in 2019 and 2020 for January-March but there was a sudden plunge in April 2020
(due to the shutdown) relative to 2019 level. Thereafter, the average work days generated in May-June 2020 saw a
sharp spike, which again fell in July-August 2020, the peak agriculture season, but remained slightly higher in 2020
than in 2019 even during August.
5work days under MG-NREGA, however, did not change from the pre-crisis period.7
Research indicates that MG-NREGA implementation has been uneven across districts of India
(Shah & Mohanty, 2010; Dreze & Oldiges, 2009), and program fund utilization is typically better
in states with higher capacity but lower need. We check whether past capacity to generate work
under MG-NREGA affected the supply of work days under MG-NREGA during the shutdown and
when the restrictions eased. We plot the average number of work days generated in 2020 across
districts which have historically (2014-18) generated above median MG-NREGA work days per
rural inhabitant and those that have generated below-median work days under the program in
Figure 1b.8 The plot shows that districts with historically higher state capacity to generate work
days under MG-NREGA not only generated more work days in 2020 but also witnessed a sharper
absolute rise (from 0.53 to 1.12 work days per rural inhabitant) in work days generation between
March to June 2020 compared to historically low performing districts (from 0.09 to 0.31 work days
per rural inhabitant).9 These findings are also in line with Narayanan et al. (2020) who show that
the increased work generation post lockdown was largely correlated with past work day generation
in a district.
3. Data
We use the Consumer Pyramids Household Survey (CPHS) data from the Centre for Monitoring
Indian Economy (CMIE) - a nation-wide, household level panel data where each household is
interviewed once every quarter in a year. The CPHS captures employment details and other socio-
demographics of individual respondents in the household.10 The sample of households surveyed
on average in each of the three quarters of 2019 was 139,220 which fell due to attrition in 2020.
Our analysis is, therefore, restricted to a balanced panel of 335,038 individuals residing in 113,812
7
We divide the cumulative work days generated by gender (unfortunately, this information is not available at
monthly frequency, unlike the total work days generated) by the number of months for which we have data to arrive at
the average monthly workdays by gender. Between April-December 2020 (post shutdown), the proportion of monthly
workdays received by women was 48.45%, whereas during April 2019 to March 2020 (pre-pandemic) it was 48.75%.
8
We exclude 2019 from the calculation of historical MG-NREGA intensity.
9
Figure A.1 in the Appendix shows the historical work days generated per rural inhabitant by district. As
expected, the states of Rajasthan, Andhra Pradesh (including the regions of present day Telangana) generated more
workdays historically and have been recognized as the best performing states since the inception of the program
(Sukhtankar, 2016; Imbert & Papp, 2015).
10
Other modules of the CPHS capture household incomes, assets and monthly expenditure. See Data Appendix
for details.
6households, who were surveyed in both 2019 and 2020. Later we check the robustness of our results
to household attrition.
Our main outcome of interest is the employment status of an individual. We use employment
data for the working age population, i.e. individuals aged 15-59 (measured in the quarter Dec
2019-Mar 2020, preceding the shutdown). Table 1, Panel A, includes the employment statistics for
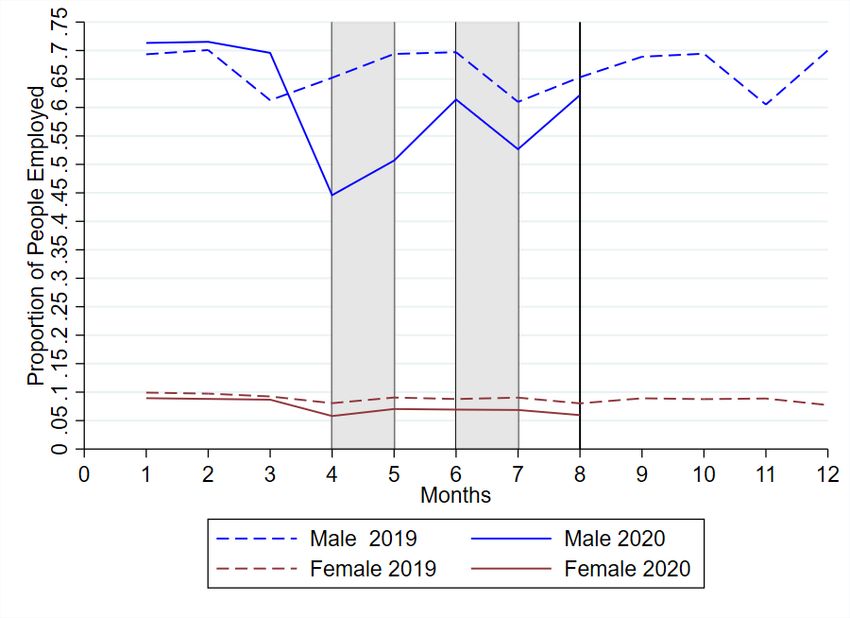
the sample in our analyses.11 Employment rates are higher, on average, in rural areas than urban
areas and among men than women. There was a distinct fall in proportion employed during April
2020, immediately after the lockdown which largely recovered by July 2020 but remained below
the levels in the corresponding months of 2019 (Figure A.2 in the Appendix).12
4. Estimation Strategy
Using CPHS data for Jan-Aug 2019 and Jan-Aug 2020, we first examine the overall change in
employment due to the crisis:
yicdmt = α0 + α1 ((Apr − Aug)m × P ostt ) + Di + P ostt + Mm + Ddt + icdmt (1)
where yicdmt is a dummy that takes value one if individual i in occupation c in district d in month
m in year t was employed and zero otherwise. (Apr − Aug)m is an indicator variable that takes
a value one for the months of April-August and zero otherwise. P ostt is an indicator variables
that takes a value of one for the year 2020 and zero otherwise. The above specification is akin to
a difference-in-differences strategy where the coefficient (α1 ) gives the effect on employment post
the shutdown on March 24, 2020.13 We also account for individual level heterogeneity (Di ), year
fixed effects (P ostt ), seasonality through month fixed effects (Mm ) and district specific year fixed
effects (Ddt ) to allay any concern that the results are driven by district specific trends. We examine
the overall employment impacts and the dynamic impacts (to estimate recovery) by sub-periods as
11
Individuals’ demographic characteristics including location (rural/urban) are measured at the time of the first
survey (pre-pandemic). In our analyses, we include data for individuals surveyed both in 2019 and 2020.
12
Panel A of Appendix Table A.1 shows the employment statistics overall and by region and gender, type of
employment (Panel B), and unemployment (voluntary vs involuntary in Panel B) during the pre-lockdown period of
Jan-Mar 2020 (period used as baseline in our analyses).
13
To elaborate, α1 is the difference between the first difference (i.e. change in employment between Apr-Aug 2020
and Jan-Mar 2020) and the second difference (i.e. change in employment between Apr-May 2019 - Jan-Mar 2019).
7the stringency of the movement restrictions eased: Apr-May (stringent lockdown), June-July (some
easing of restrictions) and Aug (further easing). Standard errors are clustered at the district-month-
year level.
Next, we examine the effect of MG-NREGA on employment. To address the concern that
contemporaneous workdays generated under MG-NREGA in 2020 are endogenous to the crisis, we
exploit the earlier finding that the increase in provision of work days under the MG-NREGA during
May-August 2020 was higher in districts which on an average in the past have shown greater state
capacity in providing employment under the scheme (Figure 1b).14 Thus, we estimate the impact of
historical state capacity to provide MG-NREGA work on employment post the shutdown in India
using the below specification:
yicdmt = β0 + β1 ((Apr − Aug)m × P ostt × N REGAdm )+
δ1 ((Apr − Aug)m × N REGAdm ) + δ2 ((Apr − Aug)m × P ostt )+
δ3 (N REGAdm × P ostt ) + Di + P ostt + Mm + Ddt + Dcmt + icdmt (2)
where N REGAdm is the number of days in district d in month m generated under MG-NREGA
during years 2014-2018, divided by the rural population (as per Census 2011) in the district. The
above specification is again akin to a difference-in-differences strategy, with heterogeneous impacts
across districts due to differences in historical state capacity to generate MG-NREGA workdays.15
The coefficient β1 gives the effect of an increase in past capacity to generate employment under
MG-NREGA by one day per rural inhabitant, on employment, post the shutdown. Thus, a positive
value of β1 would indicate that districts with higher prior state capacity to generate employment
under MG-NREGA suffered smaller employment losses post the shutdown.
The advantage of this specification is that it allows us to control for seasonal changes in employ-
ment, an important consideration in rural areas dependent on agriculture. Additionally, we control
for occupation specific time fixed effects (Dcmt ), which address the concern that districts with
14
The correlation between MG-NREGA workdays days in 2020 and historical MG-NREGA is high (0.68) suggesting
that historical generation of work days under MG-NREGA is likely to reflect the administrative capacity to respond
to a labor market crisis.
15
To elaborate, β1 is the difference between the first difference (i.e. change in employment between Apr-Aug
2020 and Jan-Mar 2020 as historical state capacity increases by one person day per rural inhabitant) and the second
difference (i.e. change in employment between Apr-Aug 2019 - Jan-Mar 2019 as historical state capacity increases by
one person day per rural inhabitant).
8higher historical MG-NREGA work days are characterised by different occupational/employment
structure and hence suffered differential job losses relative to other districts.16
We estimate the above specification - overall and by region, i.e. rural and urban areas separately
as the scheme is applicable only in the rural areas and consequently is expected to have a larger
impact there. We further examine the heterogeneity in the effect of MG-NREGA by gender, given
the program’s mandate for reserving 1/3rd of jobs for women and existing evidence which suggests
that women prefer job guarantees more than men.
5. Results
5.1. Employment trends
We find that overall employment was 5 pp or 12% (p < 0.01) lower in Apr-Aug 2020 than in the
pre-lockdown months of Jan-Mar 2020, relative to the same difference in 2019 (Panel (a) of Figure
A.3 in Appendix plots the coefficient α1 in Equation 1, for the sample of all individuals aged 15-
59).17 Panel (a) of Figure 2 shows that employment was hit the hardest, by almost 10.9 pp or
26% (p < 0.01), during the months of Apr-May 2020. It was lower by 2.1 pp (p < 0.01) during
June-July 2020, and by Aug 2020 it was almost back to its pre-lockdown levels.18
We show the heterogeneity in the employment effects by region and gender in Panel (b) and
(c) of Figure 2, respectively. Sub-figures 2b(i) and 2c(i) plot the group wise effects on employment
by region and gender, respectively. Sub-figures 2b(ii) and 2c(ii) plot the difference in these effects
across the two groups within region and gender, respectively (difference in coefficients α1 across
the two demographic groups). We find that the fall in employment was similar in both rural and
urban regions during Apr-Aug 2020, from the baseline months of Jan-Mar 2020, relative to 2019
and across all three phases.
There was a fall in the probability of employment for both men and women during Apr-Aug
16
We include 15 occupational categories for the employed or those looking for work, viz. Industrial Workers, Wage
Laborer, Self-employed, Farmer, Home-based worker, and two categories for those not employed and not looking for
work: Home Maker and Others (Retired/Students).
17
Our estimate lines up with others’. See https://unemploymentinindia.cmie.com/kommon/bin/sr.php?kall=
wtabnav&tab=4080&nvdt=20200526081826533&nvpc=091000000000&nvtype=COMMENTS
18
We also examine the effect on employment by type of work in Appendix Table A.2. We find that during Apr-Aug
2020, the proportion of casual workers fell by 3.27 pp (22%), followed by salaried (by 1.05 pp or 15%) and lastly the
self-employed (by 0.51 pp or 3%).
9relative to their pre-lockdown levels (Panel (c) of Figure A.3 in Appendix), after accounting for
changes during 2019 over the same time period, but it was more pronounced for men (8.6 pp or 12%
(p < 0.01)) than women (0.7 pp or 8% (p < 0.01)). This holds in all the three phases (Panel (c) of
Figure 2). However, the magnitude of the gender difference falls with the easing of restrictions as
male employment recovers.19
5.2. Overall effect of MG-NREGA
The first row of Table 2 reports the estimates of the effect of historical MG-NREGA state capacity
during the entire period Apr-Aug (β1 in Equation 2). The subsequent rows report the coefficients
for the most stringent lockdown period of Apr-May (Row 2), and the gradual easing in June-July
(Row 3) and Aug (Row 4), respectively. Columns (1) and (2) show the effects for the rural areas
while (3) and (4) show these for the urban areas. We find that an additional historical person day
under MG-NREGA per rural inhabitant increased the probability of employment relative to the
pre-lockdown months by 3.1 pp (or 7%) in Apr-Aug in the rural areas, relative to 2019. Given that
the overall loss in rural employment post the shutdown was 5 pp (Table A.2, Panel B, Column (1)),
these estimates suggest that employment losses in areas with higher MG-NREGA state capacity
were substantially lower. The results in column (2) show that there was a positive but insignificant
effect of past state capacity to generate MG-NREGA during the most stringent shutdown period of
Apr-May (2.9 pp). But with the gradual easing of restrictions, an increase in historical workdays
under MG-NREGA by one day per rural person in a district increased the probability of employment
in rural areas significantly by 3 and 4.8 pp during June-July and Aug 2020, respectively, from Jan-
Mar 2020 and relative to 2019. Since on average districts at the 50th and 95th percentile generated
0.16 and 1.26 person days of MG-NREGA work per month per rural inhabitant during 2014-18,
respectively, the marginal effects indicate cushioning of employment loss when a district shifts from
mid to upper end of historical MG-NREGA state capacity distribution.
We conclude, therefore, that although the impact of state capacity to generate MG-NREGA
works was muted during the shutdown, it played a significant role in cushioning job losses in rural
areas thereafter. The smaller effect of MG-NREGA state capacity during Apr-May 2020 could
19
Note, however, that if we restrict the sample to only those individuals who were employed before the lockdown,
the fall in employment is proportionally larger for women than men - in line with Deshpande (2020).
10be a result of a fall in actual MG-NREGA workdays generated during late Mar-Apr (strictest
shutdown period) in districts that were historically generating greater employment under MG-
NREGA (Figure 1a). The increase in actual workdays generation was mostly during June-July
while in August the increase was around 20% from the baseline.
A caveat to the above findings is that our measure of historical MG-NREGA workdays genera-
tion capacity per rural inhabitant (as per Census 2011) in a district does not take into account the
changes in population levels across rural-urban areas following the shutdown due to the massive
exodus of workers from urban areas towards their rural homes during Apr-July 2020, and who
began returning to the cities in Aug 2020.20 Although reliable data on migrant workers’ move-
ments during this period is absent, it is instructive to discuss how our estimates may be affected
by these movements. If the pre-pandemic out-migration rates across both high and low historical
state capacity regions were similar, then the swelling of population is likely to be similar across
all areas, and hence is subsumed in the fixed effects. However, if out-migration rates were higher
(lower) in districts with historically high MG-NREGA state capacity, then our estimates are likely
to be lower (upper) bounds of the true impact during April-July because the rural population would
have increased relatively more (less) in these districts undermining any increase in the availability
of MG-NREGA jobs. Using migration data from National Sample Survey (2007), we find that the
correlation between pre-crisis district level out-migration rates and historical MG-NREGA annual
state capacity is 0.18. The correlation is low, but given the direction, suggests that a larger number
of migrants moved back to regions with higher historical MG-NREGA state capacity. Hence, these
estimates are a likely lower bound on the true effects of prior state capacity on employment during
April-July and an upper bound for August when rural migrants began to return to the cities.21
Hence, the dynamic impact of MG-NREGA may not be entirely attributable to the ability of the
state to respond to the crisis but may also reflect the relative movement of population during this
period. Nevertheless, the overall impact for Apr-Aug 2020 balances out the two opposing directions
of any systematic bias.
20
Several newspaper reports documented the movement of workers from urban to rural India during Apr-May
2020. See: Scroll, The Economic Times.
21
The reverse movement of workers from rural to urban areas from Aug 2020 is well documented: See Business
Today.
115.2.1. Effect of MG-NREGA by gender
We restrict our attention to rural India here, since a positive effect of historical capacity to generate
work under MG-NREGA is observed above on rural employment only. Columns (5) and (6) of
Table 2 report the effects on rural women while columns (7) and (8) report the effects on rural
men. The overall estimates for Apr-Aug show that the marginal effect of an increase in average
historical workdays under MG-NREGA by one day per rural inhabitant increased the probability
of employment for women by 8.6 pp (or by 74% over baseline employment rate).
The overall fall in women’s employment in rural areas was 1 pp (Table A.2, Panel D, Column
(1)), hence these effects suggest that women who were previously not employed may have entered
the work force in historically high MG-NREGA state capacity areas. While these results are
in line with existing literature on counter cyclicality of women’s labor force participation, they
also highlight the fact that availability of suitable employment opportunities can play a role in
effectuating it. Examining the effects by sub-periods, Column (6) of Table 2 shows that MG-
NREGA had a significantly positive effect on women’s employment in all the three phases, which
strengthened over time (over 7.6 pp in Apr-July and 13.1 pp in Aug). On the other hand, the effect
on rural men remains insignificant in all the three phases (Columns (7)-(8)).22
The above results indicate that the effect of historical state capacity in generating women’s
employment increased as the lockdown restrictions eased. In addition to the lower generation
of MG-NREGA works during Apr-May, this could also be due to women benefiting from lower
demand for work as predominantly male migrants moved back to their urban workplace in August.
We provide evidence for the latter channel and other possible mechanisms in the next section.
5.2.2. Why did women benefit more?
Reservation for women in MG-NREGA jobs and possibly higher allocation of MG-NREGA work
days to women during the crisis are not sufficient to explain our results (women workers made up
for approx. 48.5% of work days, before and after the pandemic, see Sub-section 2.2.2). Existing
22
We also examine the effect of NREGA on the intensive margin of employment i.e., on the number of hours
worked in a day. However, since data on hours worked is available only from September 2019 we are unable to
correct for seasonality in employment using a DID approach. Instead, utilizing data for Jan 2020 - Aug 2020 and
computing the single difference or change in average hours of work post the lockdown for rural women as the historical
MG-NREGA generation capacity increased by one person per rural inhabitant, we again find a significantly positive
effect of MG-NREGA on rural women and an insignificant effect on rural men (Table A.3 in Appendix).
12literature indicates that women prefer jobs near home due to mobility restrictions, safety concerns
and the need to balance care work with market work (Fletcher et al., 2019) as well as a guaranteed
job (Dhingra & Machin, 2020). Since MG-NREGA guarantees work within the village precincts it
meets many, if not all, of the preferred job characteristics of women.23
In order to assess how these supply side factors may have influenced the impact of the program,
we examine the heterogeneous effects of historical MG-NREGA state capacity by marital status
(likely indicator of limited mobility), whether individuals’ household has primary school going
children (indicator of limited mobility and need to balance care work with market work), lower
education and poverty (may have greater preference for guaranteed jobs). Thus in Table 3 we
analyse the impact of MG-NREGA on employment of rural women by the following individual
characteristics: (1) Ever married (dummy variable that takes a value one for women who were
ever married, else zero), (2) Education (dummy variable that takes value one for women with
education below primary level, else zero) and (3) Employment (dummy equals one for women who
were employed in the preceding quarter before the lockdown, else zero) to check whether women
already in the labor force or new entrants to the labor market took up MG-NREGA work during
the pandemic; household characteristics: (4) Y oung children (dummy variable that equals one for
households with a child up to 12 years of age, else zero) and (5) P oor (takes value one for households
in the bottom two deciles of a constructed assets index, else zero); and lastly, we examine whether
the cushioning of women’s employment varied by the proportion of migrant population of a district,
i.e. (6) Low migrant - dummy equals one for individuals residing in rural districts without seasonal
out-migrant workers, and zero if the district has a positive number of rural out-migrants in the
year 2007, the latest year for which such information is available.24
The first row of Table 3 reports the heterogeneous effects of MG-NREGA by these characteristics
on rural women’s employment. The second row reports the impact for the base category (Z = 0).
The row ‘Estimate (Z = 1)’ in the bottom panel reports the sum of the first two rows in the table
i.e., the impact for the main category (Z = 1). We find that rural women in all these categories
(Z = 0 as well as Z = 1) gained employment in areas with historically high MG-NREGA state
23
Since we account for both time invariant and time varying district level heterogeneity in the labor market in
our analysis, any difference in employment opportunities (by gender) between high and low capacity districts cannot
explain our results.
24
For details on construction of the asset index and calculation of number of seasonal migrant workers in a district,
refer to Appendix B.
13capacity but there were significant differences across these categories by marital status, education,
children and poverty levels. Column (1) shows that ever married women’s employment increased by
4.5 pp (33%) more than women who were never married and employment of women with primary
school going children increased by 3.9 pp more (33%) than those in households with no child in
that age group (Column (4)). These results support the hypothesis that limited mobility and the
need to balance child care duties could have led to women accessing a public guarantee program
like MG-NREGA more than men.
Similarly, results in Row (1) of Columns (2) and (5) in Table 3 indicate that employment of
women who were less educated or in households classified as poor increased relatively more due to
MG-NREGA by 4.7 pp and 4.9 pp, respectively. However, we do not find any significant difference in
employment increase due to MG-NREGA state capacity by previous employment status of women
(Column (3), Table 3), suggesting that employment of women who were previously employed as
well as those who were not increased post shutdown in regions with historically high MG-NREGA
state capacity. We also find that rural women in districts having low migrant worker population
witnessed a larger increase in employment during Apr-Aug due to MG-NREGA state capacity by
11.8 pp (Column (6)). As discussed earlier, this finding can be attributed to lower demand for
limited MG-NREGA jobs in low migrant areas, as primarily male migrant workers returned to
rural regions post the shutdown.25
On the other hand, while employment of less educated men and those in poorer households
was cushioned more due to MG-NREGA (Appendix Table A.4, Columns (2) and (5)), there were
no differential employment effects along the dimensions of marriage or children in the household
for rural men (Columns (1), (3) and (4)). Although employment of rural men residing in districts
with low migrant worker population was also cushioned more due to MG-NREGA state capacity
(Column (6)), the magnitude of impact was smaller for men (8 pp for men vs 11.8 pp for women).
These results suggest that mobility and child care concerns were additional factors due to which
women may have benefited more from MG-NREGA during the crisis.
25
We obtain similar results when we analyse contemporaneous work provided under MG-NREGA on changes in
employment status of rural women post lockdown and the heterogeneity in these effects. We also examined these
heterogeneous impacts on the intensive margin of employment i.e., on the number of hours worked in a day. We
continue to find a differentially higher significant effect of MG-NREGA on ever married, less educated women and in
districts with low migrant workers. The coefficient on children and poor remains positive but is imprecise (Columns
(4)-(9), Table A.3 in Appendix).
145.3. Robustness Checks
Attrition: We carry out inverse-probability weighted estimation to check the robustness of our
results to attrition (see Appendix B for methodology), reported in Table A.5 in Appendix, Columns
(1)-(3). The previous conclusions continue to hold - there is a decline in employment post the
national lockdown by 5 pp (Column (1)) and historical capacity to generate MG-NREGA works
cushions losses for rural women (Column (2)) but not for rural men (Column (3)).
Placebo: We undertake a falsification exercise using data from Jan-Aug 2018 and Jan-Aug 2019
and defining P ostt as the year 2019 in Table A.5 in Appendix. Since there was no pandemic induced
shutdown during 2019, we should not see any systematic employment trends for this period. As
expected, we find no significant difference between the probability of employment in Apr-Aug 2019,
in comparison to Jan-Mar 2019 (Column (4)), relative to that of 2018. The effect of historical state
capacity to generate MG-NREGA workdays on rural employment is also not significant in Columns
(5) and (6) for either rural women or men.
District Seasonality: Our results are also robust to controlling for district-month fixed effects
to account for seasonality in employment at a geographically disaggregated level. These are omitted
for brevity.
6. Conclusion
In this paper we analyse the extent to which an employment guarantee program was able to
stem employment loss in India during the Covid-19 crisis. Using individual level panel data and
accounting for seasonal trends in employment, individual and regional heterogeneity, our findings
suggest that districts with higher pre-pandemic capacity to generate public works employment
under MG-NREGA were able to cushion job losses significantly in rural areas and more so for rural
women. We find no spillover effects on urban employment, highlighting the need for complementary
policies in urban areas.26 Furthermore, rural women who were less likely to be mobile and/or had
child care responsibilities gained more from the program, suggesting that the nature of guaranteed
26
See recent debate on providing an urban MG-NREGA: https://www.ideasforindia.in/topics/
poverty-inequality/duet-a-proposal-for-an-urban-work-programme.html.
15jobs can be a critical determinant of which demographic groups benefit from such social protection.
References
Afridi, Farzana, Mukhopadhyay, Abhiroop, & Sahoo, Soham. 2016. Female labor force participation
and child education in India: evidence from the National Rural Employment Guarantee Scheme.
IZA Journal of Labor & Development, 5(1), 1–27.
Altonji, Joseph, Contractor, Zara, Finamor, Lucas, Haygood, Ryan, Lindenlaub, Ilse, Meghir,
Costas, O’Dea, Cormac, Scott, Dana, Wang, Liana, & Washington, Ebonya. 2020. Employment
effects of unemployment insurance generosity during the pandemic. Yale University Manuscript.
Balajee, Anuragh, Tomar, Shekhar, & Udupa, Gautham. 2020. Fiscal Situation of India in the
Time of COVID-19. Available at SSRN 3571103.
Deshpande, Ashwini. 2020. The Covid-19 Pandemic and Lockdown: First Effects on Gender Gaps
in Employment and Domestic Work in India. Ashoka Economics Working Paper No 30.
Devereux, Stephen. 2002. Can social safety nets reduce chronic poverty? Development Policy
Review, 20(5), 657–675.
Dhingra, Swati, & Machin, Stephen J. 2020. The Crisis and Job Guarantees in Urban India. IZA
Discussion Paper No. 13760.
Dreze, Jean, & Oldiges, Christian. 2009. Work in progress. Frontline, Vol 26, Issue 4, Feburary
14-27.
East, Chloe N, & Simon, David. 2020. How Well Insured are Job Losers? Efficacy of the Public
Safety Net. NBER Working Paper No. 28218.
Farrell, Diana, Ganong, Peter, Greig, Fiona, Liebeskind, Max, Noel, Pascal, & Vavra, Joseph.
2020. Consumption effects of unemployment insurance during the covid-19 pandemic. Available
at SSRN 3654274.
Fletcher, Erin K, Pande, Rohini, & Moore, Charity Troyer. 2019. Women and Work in India:
Descriptive Evidence and a Review of Potential Policies. Pages 149–216 of: India Policy Forum,
vol. 15. National Council of Applied Economic Research.
Imbert, Clement, & Papp, John. 2015. Labor market effects of social programs: Evidence from
india’s employment guarantee. American Economic Journal: Applied Economics, 7(2), 233–63.
Moffitt, Robert A, & Ziliak, James P. 2020. COVID-19 and the US Safety Net. Fiscal Studies,
41(3), 515–548.
Muralidharan, Karthik, Niehaus, Paul, & Sukhtankar, Sandip. 2016. Building state capacity:
Evidence from biometric smartcards in India. American Economic Review, 106(10), 2895–2929.
16Narayanan, Sudha, Oldiges, Christian, & Saha, Shree. 2020. Employment Guarantee during Times
of COVID-19: Pro-poor and Pro-return-migrant? IGIDR Working Paper No. 2020-034.
Pissarides, Christopher A. 1992. Loss of skill during unemployment and the persistence of employ-
ment shocks. The Quarterly Journal of Economics, 107(4), 1371–1391.
Rees-Jones, Alex, D’Attoma, John, Piolatto, Amedeo, & Salvadori, Luca. 2020. Covid-19 changed
tastes for safety-net programs. NBER Working Paper No. 27865.
Sabarwal, Shwetlena, Sinha, Nistha, & Buvinic, Mayra. 2011. How Do Women Weather Economic
Shocks? What We Know. World Bank-Economic Premise 46, 1–6.
Shah, Deepak, & Mohanty, Sovna. 2010. Implementation of NREGA During Eleventh Plan in
Maharashtra: Experiences, Challenges and Ways Forward. Indian Journal of Agricultural Eco-
nomics, 65(3), 1–12.
Skoufias, Emmanuel, & Parker, Susan W. 2006. Job loss and family adjustments in work and
schooling during the Mexican peso crisis. Journal of Population Economics, 19(1), 163–181.
Sukhtankar, Sandip. 2016. India’s National Rural Employment Guarantee Scheme: What Do We
Really Know about the World’s Largest Workfare Program? Pages 231–285 of: India Policy
Forum, vol. 13.
17Figure 1: MG-NREGA person days per rural inhabitant
a: Current
b: Historical (2014-18)
Source: NREGA Public Data Portal (2014-2020).
Note: The persondays generated were divided by the rural population of the district (Census 2011). The median in
panel (b) is defined using the average historical MG-NREGA persondays generated in a district between 2014-18.
18Figure 2: Impact of Shutdown on Employment
a: Overall
b(i): Region b(ii): Difference (Region)
c(i): Gender c(ii): Difference (Gender)
Source: Consumer Pyramids Household Survey Data (2019-2020).
Note: The classification of region and gender is as per the quarter preceding the pandemic i.e. Dec, 2019-Mar,
2020. Standard errors clustered at district-month-year level. 90% confidence bands are plotted around the regression
coefficients.
19Table 1: Summary Statistics
Panel A: Employment (Individual-Month-Year level)
Variable Number of units Obs Mean S.D. Definition
Overall 335,038 1,040,918 0.41 0.49 Proportion employed
Region
Rural 114,509 350,907 0.43 0.49 Proportion employed in rural areas
Urban 220,529 690,011 0.40 0.49 Proportion employed in urban areas
Gender
Men 179,167 557,788 0.65 0.48 Proportion of men employed
Women 155,871 483,130 0.08 0.28 Proportion of women employed
Panel B: MG-NREGA (District-Month level)
NREGA 2020 580 4,630 0.49 0.75 Persondays per rural person in 2020
NREGA 2019 580 4,630 0.37 0.62 Persondays per rural person in 2019
Historical NREGA 580 4,630 0.41 0.99 Persondays per rural person in 2014-18
Source: The data for employment is from the Consumer Pyramids Household Survey for the relevant period
in the sample (Jan-Aug 2019 and for Jan-Aug 2020). The data for work days (Jan-Aug) generated under
MG-NREGA (2014-2020) are taken from NREGA Public Data Portal and normalized by district rural population
(Census 2011).
20Table 2: Impact of MG-NREGA on Employment
Rural Urban Rural Female Rural Male
(1) (2) (3) (4) (5) (6) (7) (8)
Apr-Aug×NREGA 0.031** -0.013 0.086*** 0.010
(0.012) (0.013) (0.020) (0.015)
Apr-May×NREGA 0.029 -0.012 0.076*** 0.011
(0.021) (0.018) (0.029) (0.025)
June-July×NREGA 0.030** 0.002 0.076*** 0.013
(0.013) (0.013) (0.021) (0.015)
Aug×NREGA 0.048** 0.015 0.131*** 0.031
(0.024) (0.027) (0.040) (0.031)
Observations 346,836 346,836 683,210 683,210 159,842 159,839 186,993 186,993
R-squared 0.891 0.893 0.892 0.895 0.799 0.802 0.850 0.853
Mean Y 0.446 0.407 0.116 0.73
Fixed Effects
Individual X X X X X X X X
Month X X X X X X X X
Year X X X X X X X X
Dist × Year X X X X X X X X
Occ × Month-Year X X X X X X X X
Source: Consumer Pyramids Household Survey (2019-2020), NREGA Public Data Portal (2014-18) and Census
(2011).
Note: The classification of region and gender is as of quarter preceding the pandemic i.e. Dec, 2019-Mar, 2020.
The average monthly persondays generated under MG-NREGA in the last five years (i.e. between 2014-18) per
rural inhabitant (Census, 2011) is the measure of historical MG-NREGA. Estimates conditional on differential trends
across occupation, with individuals’ occupation measured in the quarter preceding the pandemic. Mean (Y) refers to
the mean of the dependent variable in the months before the national lockdown i.e., Jan-Mar 2020. Standard errors
clustered at district-month-year level reported in parantheses (*** pTable 3: Heterogenous Impact of MG-NREGA on Employment of Rural Women
Individual Household District
Characteristic (Z) Ever Less Previously Young Poor Low
Married Educated Employed Children Migrant
(1) (2) (3) (4) (5) (6)
Apr-Aug × NREGA × Z 0.045** 0.047* 0.086 0.039** 0.049* 0.118***
(0.022) (0.026) (0.068) (0.016) (0.029) (0.048)
Apr-Aug × NREGA 0.049** 0.073*** 0.071*** 0.073*** 0.071*** 0.049**
(0.019) (0.018) (0.019) (0.021) (0.021) (0.018)
Apr-Aug × Z 0.019* 0.015* -0.964*** -0.025*** 0.009 -0.029
(0.011) (0.008) (0.142) (0.005) (0.009) (0.014)
NREGA × Z -0.042*** -0.041** -0.168*** -0.015 -0.017 -0.156***
(0.016) (0.016) (0.040) (0.010) (0.019) (0.051)
Observations 159,842 159,842 159,842 159,842 159,842 154,269
R-squared 0.799 0.799 0.801 0.799 0.799 0.800
Estimate (Z=1) 0.094*** 0.12*** 0.157*** 0.111*** 0.121*** 0.166***
Mean Y (Z=1) 0.138 0.165 1 0.122 0.155 0.095
Mean Y (Z=0) 0.038 0.101 0 0.112 0.105 0.142
Fixed Effects
Individual X X X X X X
Month X X X X X X
Year X X X X X X
District × Year X X X X X X
Occ × Month-Year X X X X X X
Source: Consumer Pyramids Household Survey (2019-2020), NREGA Public Data Portal (2014-18), Census (2011)
and Employment and Unemployment Survey, NSS (2007).
Note: The classification of all characteristics is per the quarter preceding the pandemic i.e. Dec, 2019-Mar, 2020.
Ever married indicates individuals who were ever married. Less Educated is indicator for below primary education.
Previously Employed is indicator for those employed. Young Children indicates households with children aged upto 12
years of age and Poor indicates households falling in the bottom two deciles of the distribution of PCA of assets owned
by a household. Low migrant is indicator for districts that have no out-migrants (NSS, 2007). The average monthly
persondays generated under MG-NREGA in the last five years (i.e. between 2014-18) per rural inhabitant (Census
2011) is the measure of historical MG-NREGA. Mean (Y) refers to the mean of the dependent variable in the months
before the national lockdown i.e., Jan-Mar 2020. Estimates conditional on differential trends across occupation, with
individuals’ occupation measured in the quarter preceding the pandemic. There are fewer observations in Column (6)
because migration data for some districts are missing in NSS 2007. Standard errors clustered at district-month-year
level reported in parantheses (*** pAPPENDIX - FOR ONLINE PUBLICATION
A. Additional Tables and Figures
Table A.1: Summary Statistics (before national shutdown)
Variable Obs Mean S.D. Definition
Panel A: Employment
Overall 269850 0.42 0.49 Proportion employed
Region
Rural 92834 0.45 0.50 Proportion employed in rural areas
Urban 177016 0.41 0.49 Proportion employed in urban areas
Gender
Men 144227 0.71 0.45 Proportion of men employed
Women 125623 0.09 0.28 Proportion of women employed
Gender (Rural)
Men 49951 0.73 0.44 Proportion of men employed
Women 42883 0.12 0.32 Proportion of women employed
Gender (Urban)
Men 94276 0.70 0.46 Proportion of men employed
Women 82740 0.07 0.26 Proportion of women employed
Panel B: Employment type
Casual 269850 0.15 0.36 Daily/monthly wage labour
Salaried 269850 0.07 0.25 Permanent salaried work
Selfemp 269850 0.20 0.40 Self-employed
Unemp (Involuntary) 269850 0.06 0.23 Willing to work but not finding work
Unemp (Voluntary) 269850 0.52 0.50 Not willing to work
Source: Consumer Pyramids Household Survey (2019-2020).
Note: In both the panels, we use the pre-pandemic months of 2020 i.e. January-March. The sample includes all
individuals aged 15-59.
23Table A.2: Impact of Lockdown by Type of Employment
Employed Casual Salaried Selfemp Unemp Not in LF
(1) (2) (3) (4) (5) (6)
Panel A: Overall
Apr-Aug×Post -0.050*** -0.033*** -0.010*** -0.005** 0.034*** 0.016***
(0.003) (0.003) (0.002) (0.002) (0.003) (0.003)
Observations 1,030,046 1,030,046 1,030,046 1,030,046 1,030,046 1,030,046
R-squared 0.884 0.715 0.771 0.767 0.590 0.877
Mean (Y) 0.42 0.15 0.068 0.195 0.057 0.523
Panel B: Rural
Apr-Aug×Post -0.049*** -0.038*** -0.011*** 0.004 0.032*** 0.017***
(0.004) (0.004) (0.002) (0.004) (0.004) (0.004)
Observations 346,836 346,836 346,836 346,836 346,836 346,836
R-squared 0.884 0.725 0.761 0.797 0.590 0.881
Mean (Y) 0.446 0.166 0.033 0.236 0.049 0.505
Panel C: Urban
Apr-Aug×Post -0.049*** -0.029*** -0.010*** -0.009*** 0.033*** 0.015***
(0.004) (0.004) (0.002) (0.003) (0.004) (0.004)
Observations 683,210 683,210 683,210 683,210 683,210 683,210
R-squared 0.885 0.710 0.771 0.747 0.591 0.875
Mean (Y) 0.407 0.141 0.087 0.173 0.061 0.533
Panel D: Rural Female
Apr-Aug×Post -0.010* -0.008** -0.003*** 0.001 0.013*** -0.003
(0.005) (0.004) (0.001) (0.003) (0.004) (0.006)
Observations 159,843 159,843 159,843 159,843 159,843 159,843
R-squared 0.769 0.710 0.775 0.724 0.634 0.752
Mean (Y) 0.116 0.057 0.009 0.05 0.033 0.851
Panel E: Rural Male
Apr-Aug×Post -0.083*** -0.064*** -0.018*** 0.006 0.049*** 0.034***
(0.006) (0.007) (0.003) (0.006) (0.006) (0.004)
Observations 186,993 186,993 186,993 186,993 186,993 186,993
R-squared 0.841 0.708 0.756 0.762 0.576 0.832
Mean (Y) 0.73 0.26 0.054 0.396 0.062 0.208
Fixed Effets
Individual X X X X X X
Month X X X X X X
Year X X X X X X
District × Year X X X X X X
Source: Consumer Pyramids Household Survey (2019-2020).
Note: In all panels, the sample includes individuals aged 15-59 who are classified into one of the employment
categories as per their employment status in the pre-pandemic quarter i.e. Dec, 2019-Mar, 2020. The panel
B and C have the rural and urban samples, respectively. Panel D and E have the female and male sample
from rural regions, respectively. The Mean (Y) are calculated from the pre-pandemic months of 2020 i.e. Jan-
Mar. Standard errors clustered at district-month-year level reported in parantheses (*** pTable A.3: Impact of MG-NREGA on Hours Worked
Rural Rural Women Hetero (Z)
Individual Household District
Overall Female Male Ever Less Previously Young Poor Low
Married Educated Employed Children Migrant
(1) (2) (3) (4) (5) (6) (7) (8) (9)
Apr-Aug × NREGA 0.158 0.441*** 0.028
(0.143) (0.131) (0.246)
Apr-Aug × NREGA × Z 0.272* 0.427** 0.584 0.251 0.340 0.563***
(0.156) (0.217) (0.467) (0.173) (0.234) (0.294)
Observations 90,672 41,558 49,114 41,558 41,558 41,558 41,558 41,558 39,896
R-squared 0.856 0.820 0.792 0.820 0.820 0.823 0.820 0.820 0.818
Mean Y 3.443 0.798 5.714
Mean Y (Z=1) 1.045 1.137 6.888 0.853 1.083 0.657
Mean Y (Z=0) 0.292 0.696 0 0.776 0.721 0.976
Fixed Effects
Individual X X X X X X X X X
Occ × Month-Year X X X X X X X X X
Source: Consumer Pyramids Household Survey (2020), NREGA Public Data Portal (2014-18), Census (2011) and
Employment and Unemployment Survey, NSS (2007).
Note: The classification of all characteristics is per the quarter preceding the pandemic i.e. Dec, 2019-Mar, 2020.
Ever married indicates individuals who were ever married. Less Educated is indicator for below primary education.
Previously Employed is indicator for those employed. Young Children indicates households with children aged
upto 12 years of age and Poor indicates households falling in the bottom two deciles of the distribution of PCA of
assets owned by a household. Low migrant is indicator for districts that have no out-migrants (NSS, 2007). The
average monthly persondays generated under MG-NREGA in the last five years (i.e. between 2014-18) per rural
inhabitant (Census 2011) is the measure of historical MG-NREGA. Mean (Y) refers to the mean of the dependent
variable in the months before the national lockdown i.e. Jan-Mar 2020. Estimates conditional on differential trends
across occupation, with individuals’ occupation measured in the quarter preceding the pandemic. There are fewer
observations in Column (9) because migration data for some districts were missing. Standard errors clustered at
district-month-year level reported in parantheses (*** pTable A.4: Heterogenous Impact of MG-NREGA on Employment of Rural Men
Individual Household District
Characteristic (Z) Ever Less Previously Young Poor Low
Married Educated Employed Children Migrant
(1) (2) (3) (4) (5) (6)
Apr-Aug × NREGA × Z -0.018 0.053*** 0.003 0.016 0.075*** 0.080***
(0.025) (0.020) (0.026) (0.017) (0.024) (0.031)
Apr-Aug × NREGA 0.026 0.001 0.006 0.009 -0.007 -0.018
(0.021) (0.015) (0.021) (0.016) (0.017) (0.020)
Apr-Aug × Z 0.318*** 0.030*** -1.105*** 0.068*** 0.009 -0.021
(0.016) (0.011) (0.051) (0.007) (0.011) (0.014)
NREGA × Z 0.002 -0.005 -0.065*** -0.006 -0.002 -0.128***
(0.014) (0.011) (0.016) (0.009) (0.014) (0.035)
Observations 186,993 186,993 186,993 186,993 186,993 180,375
R-squared 0.855 0.850 0.852 0.850 0.850 0.849
Estimate (Z=1) 0.008 0.054*** 0.009 0.025 0.068*** 0.062***
Mean Y (Z=1) 0.964 0.909 1 0.88 0.755 0.728
Mean Y (Z=0) 0.381 0.709 0 0.666 0.724 0.732
Fixed Effects
Individual X X X X X X
Month X X X X X X
Year X X X X X X
District × Year X X X X X X
Occ × Month-Year X X X X X X
Source: Consumer Pyramids Household Survey (2019-2020), NREGA Public Data Portal (2014-18), Census (2011)
and Employment and Unemployment Survey, NSS (2007).
Note: The classification of all characteristics is per the quarter preceding the pandemic i.e. Dec, 2019-Mar, 2020.
Ever married indicates individuals who were ever married. Less Educated is indicator for below primary education.
Previously Employed is indicator for those employed. Young Children indicates households with children aged
upto 12 years of age and Poor indicates households falling in the bottom two deciles of the distribution of PCA of
assets owned by a household. Low migrant is indicator for districts that have no out-migrants (NSS, 2007). The
average monthly persondays generated under MG-NREGA in the last five years (i.e. between 2014-18) per rural
inhabitant (Census 2011) is the measure of historical MG-NREGA. Mean (Y) refers to the mean of the dependent
variable in the months before the national lockdown i.e. Jan-Mar 2020. Estimates conditional on differential trends
across occupation, with individuals’ occupation measured in the quarter preceding the pandemic. There are fewer
observations in Column (6) because migration data for some districts were missing. Standard errors clustered at
district-month-year level reported in parantheses (*** pYou can also read