Comparing the COVID 19 pandemic in space and over time in Europe, using numbers of deaths, crude rates and adjusted mortality trend ratios - Nature
←
→
Page content transcription
If your browser does not render page correctly, please read the page content below
www.nature.com/scientificreports
OPEN Comparing the COVID‑19 pandemic
in space and over time in Europe,
using numbers of deaths, crude
rates and adjusted mortality trend
ratios
Valentina Gallo1,2,3*, Paolo Chiodini4, Dario Bruzzese5, Elias Kondilis6, Dan Howdon7,
Jochen Mierau8 & Raj Bhopal9
Comparison of COVID-19 trends in space and over time is essential to monitor the pandemic and to
indirectly evaluate non-pharmacological policies aimed at reducing the burden of disease. Given the
specific age- and sex- distribution of COVID-19 mortality, the underlying sex- and age-distribution
of populations need to be accounted for. The aim of this paper is to present a method for monitoring
trends of COVID-19 using adjusted mortality trend ratios (AMTRs). Age- and sex-mortality distribution
of a reference European population (N = 14,086) was used to calculate age- and sex-specific mortality
rates. These were applied to each country to calculate the expected deaths. Adjusted Mortality Trend
Ratios (AMTRs) with 95% confidence intervals (C.I.) were calculated for selected European countries
on a daily basis from 17th March 2020 to 29th April 2021 by dividing observed cumulative mortality,
by expected mortality, times the crude mortality of the reference population. These estimated the
sex- and age-adjusted mortality for COVID-19 per million population in each country. United Kingdom
experienced the highest number of COVID-19 related death in Europe. Crude mortality rates were
highest Hungary, Czech Republic, and Luxembourg. Accounting for the age-and sex-distribution
of the underlying populations with AMTRs for each European country, four different patterns were
identified: countries which experienced a two-wave pandemic, countries with almost undetectable
first wave, but with either a fast or a slow increase of mortality during the second wave; countries
with consistently low rates throughout the period. AMTRs were highest in Eastern European
countries (Hungary, Czech Republic, Slovakia, and Poland). Our methods allow a fair comparison of
mortality in space and over time. These might be of use to indirectly estimating the efficacy of non-
pharmacological health policies. The authors urge the World Health Organisation, given the absence
of age and sex-specific mortality data for direct standardisation, to adopt this method to estimate the
comparative mortality from COVID-19 pandemic worldwide.
In December 2019, a cluster of pneumonia cases in Wuhan City (China) was identified as having been caused by
the SARS-CoV-2 virus, leading to the disease now termed COVID-19. The subsequent global transmission led
to the outbreak being classified as a pandemic by the World Health Organisation (WHO) on 11th March 2 0201.
Some of the clinical characteristics of COVID-19 infection (long incubation period, heterogeneity of symptoms,
transmission by asymptomatic carriers)1–5 have contributed to make the estimates of its distribution at popula-
tion level at the beginning of the pandemic somewhat challenging. Nonetheless, monitoring the pandemic at
the national level and comparing data at the international level is of paramount importance. Comprehensive
surveillance data, and transparency in the communication with the population are necessary prerequisite for
1
University of Groningen, Campus Fryslân, Wirdumerdijk 34, 8911 CE Leeuwarden, The Netherlands. 2Queen
Mary University of London, London, UK. 3London School of Hygiene and Tropical Medicine, London, UK. 4Medical
Statistics Unit, University of Campania “L. Vanvitelli”, Naples, Italy. 5Medical Statistics, University of Naples
“Federico II”, Naples, Italy. 6Aristoteles University, Thessaloniki, Greece. 7University of Leeds, Leeds, UK. 8Aletta
Jacobs School of Public Health, University of Groningen, Groningen, The Netherlands. 9Usher Institute, University
of Edinburgh, Edinburgh, Scotland, UK. *email: v.gallo@rug.nl
Scientific Reports | (2021) 11:16443 | https://doi.org/10.1038/s41598-021-95658-4 1
Vol.:(0123456789)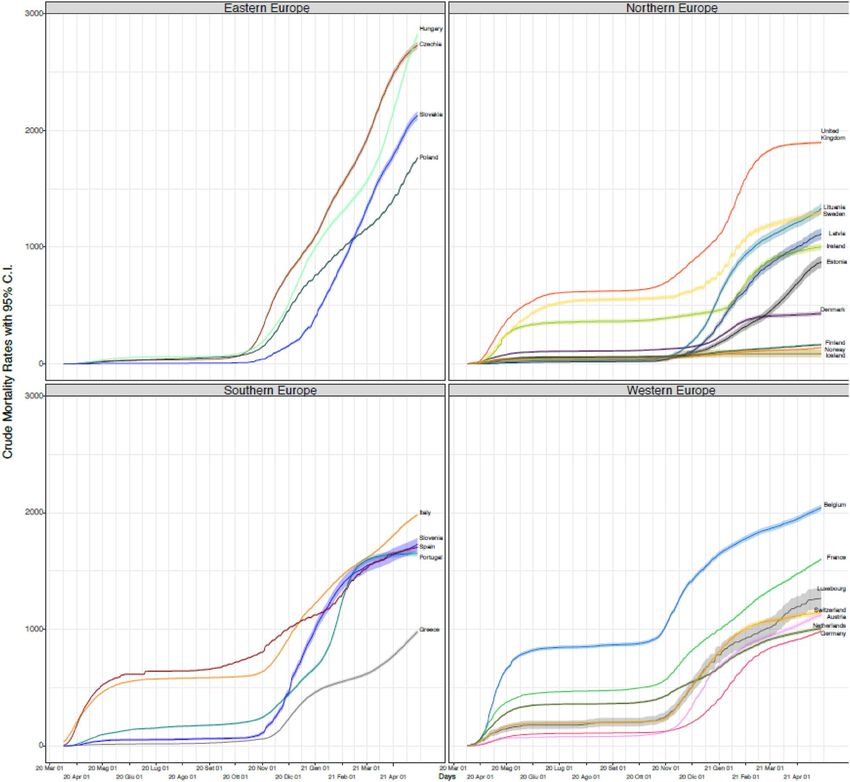
www.nature.com/scientificreports/
controlling the pandemic in a timely and focused manner and for adjusting healthcare services in a constantly
changing environment of dynamic healthcare n eeds6–8. The COVID-19 pandemic has already revealed the struc-
tural weaknesses of public health surveillance systems in both high and low-income countries and the difficulty
in producing complete and comparable data within and among c ountries9–11. It is therefore essential, when
comparing data from different countries, to use only appropriate metrics that rely on complete data collected in a
similar way, assuring comparability12. Testing is not widely available in every country, including many European
countries during the first months of the pandemic; moreover, testing policies differ by country. In countries where
testing is less readily available, it is likely that this would lead to undercounts of infected people, especially of
those showing fewer symptoms. This has the potential to introduce selection bias, underestimating incidence
and inflating case fatality ratios. Mortality, conversely, suffers from less variability given that it is independent
from testing policy, and that it should be recorded fairly consistently across countries given the uniqueness of the
clinical picture of the people severely affected by COVID-19. This includes a progressive respiratory insufficiency
leading to an interstitial pneumonia with rrespiratory deterioration concomitant with extension of ground-
glass lung opacities on chest CT scans, lymphocytopenia, and high prothrombin time and D-dimer levels13.
At individual level, mortality has been shown to be associated with age, sex, ethnicity, socio-economic status,
level of deprivation, and outdoor environment, in the United States14–16; and with a number of co-morbidities,
including hypertension, diabetes mellitus, congestive heart failure, dementia, chronic pulmonary disease, liver
disease, renal disease, and cancer17,18.
For international comparisons aimed at monitoring changes in trends over time and in space, adjusting
for all risk factors associated to mortality might be very demanding. However, given the particular age- and
sex- distribution of morbidity and mortality from COVID-194,19, the underlying sex- and age-distribution of
a population is of particular importance in determining the number of expected cases. Not adjusting for age
undermines meaningful comparison especially when comparing lower- with higher-income countries. During
the first months of the pandemic, due to its sudden onset and speed of spread, it has been difficult to compare
data coming from different countries partly because basic epidemiological principles (e.g. adjustment for age
and sex) have not been applied consistently, with the main emphasis given to the number of cases per population
unit12,20. Only recently, this matter has gained some more attention21.
Standardised Mortality Trend Ratios (SMTRs) were used to describe the COVID-19 related mortality trends
over time across Italian regions by some of us22. The aim of this paper is to expand on that approach and to
present a method for monitoring trends of COVID-19 mortality adjusted for the demographic composition of
the underlying population, based on the concept of indirect standardisation23. The method is illustrated by an
application to data coming from European countries.
Methods
Definition used. The definition of a “case” affects the metrics used to monitor trends of COVID-19. Cases
can be defined as anyone who has been infected by SARS-CoV-2—“confirmed case”24,25; or anyone who is symp-
tomatic. In the first case, a form of biological test would be needed to detect the infected but asymptomatic
cases24,25. The choice of the definition of case is likely to make a large difference in any metric used. The initial
estimates that up to 90% of infected people were asymptomatic have been recently revised and estimated to be
between 17 and 20%26. Nonetheless, it still represents a considerable proportion of people going potentially
completely undetected by the health system, in absence of active surveillance. In many contexts, detecting all
those infected is complicated given that the availability of serological tests with good sensitivity and specific-
ity for wide-scale use is not uniformly d istributed27,28. Ascertaining COVID-19 mortality is also no entirely
problem-free; the distinction between mortality with the infection (COVID-19 positive deaths, regardless of the
immediate cause of death) and mortality from the infection (deaths occurring in those for whom the immediate
or underlying cause of death can be reasonably ascribed to COVID-19) has not always been applied in a clear-cut
way. However, this has improved since the World Health Organisation (WHO) published guidance for the use of
deaths from COVID-19 for surveillance purposes (“(…) death resulting from a clinically compatible illness, in
a probable or confirmed COVID-19 case, unless there is a clear alternative cause of death that cannot be related
to COVID-19 disease (e.g. trauma)”29.
Sample, data collection and research setting. This paper uses data readily available online, from dif-
ferent sources, downloaded and collated in an Excel spreadsheet for analysis. Daily total number of deaths from
COVID-19 from selected European countries (Austria, Belgium, Czech Republic, Denmark, Estonia, Finland,
France, Germany, Greece, Hungary, Iceland, Ireland, Italy, Latvia, Lithuania, Luxembourg, the Netherlands,
Norway, Poland, Portugal, Slovakia, Slovenia, Spain, Switzerland, and United Kingdom) from 17/03/2020 to
29/04/2021 were extracted from the European Centre for Disease Prevention and Control (ECDC) w ebsite30,
these were summed up to display cumulative number of deaths per day per country. Age-and sex- distribution
of death from COVID-19 reported from subset of these countries was collected from varied national-based
sources30–33. The demographic composition of the underlying population in 2019 of the selected countries was
extracted from the Organisation for the Economic co-operation and Development (OECD)34. Crude mortality
rate per 1,000,000 was calculated daily in each country by dividing the number of cumulative deaths by the total
country population in 2019.
Methods and data analysis procedure. A reference population and a reference period of time was con-
veniently defined as the population of the European countries for which the age- and sex-distribution of deaths
from COVID-19 was available, before the end of March 2020. A total of 14,086 COVID-19 deaths divided
into age and sex categories occurred during the reference period (649 from the United Kingdom -UK- up to
Scientific Reports | (2021) 11:16443 | https://doi.org/10.1038/s41598-021-95658-4 2
Vol:.(1234567890)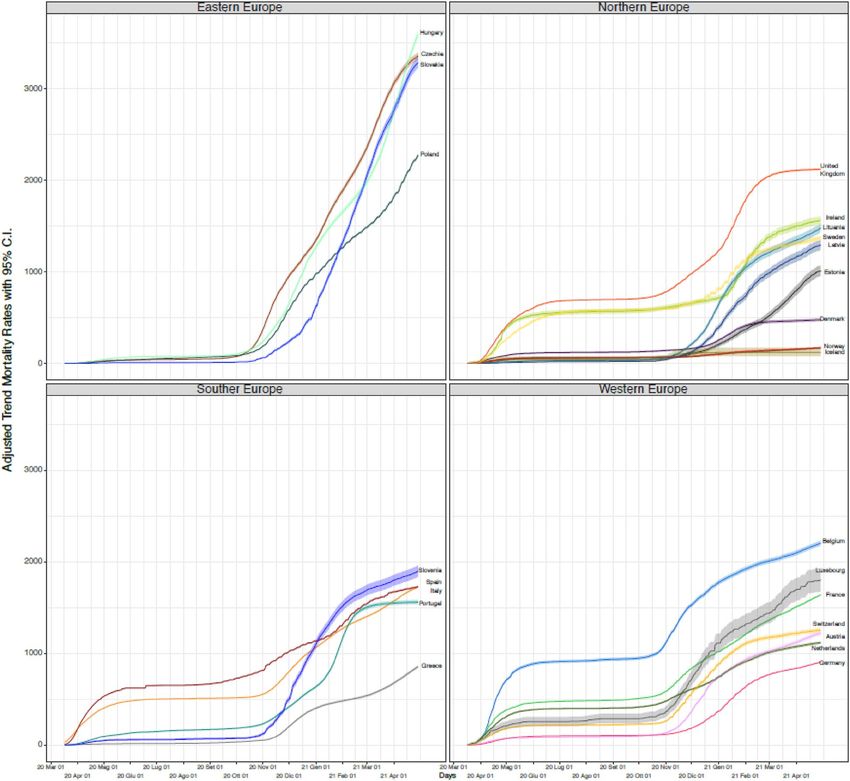
www.nature.com/scientificreports/
27/03/202031, 4993 from Italy released on 23/03/202032, 821 from B elgium30, 3459 from F rance33, 581 from
ermany30, 187 from Portugal30, and 3396 from Spain30, all up to 31/03/2020) and composed the reference
G
population. These were collated in one composed age- and sex-specific set of COVID-19 related deaths and used
to calculate age- and sex-specific mortality rates per 1,000,000 population by dividing for each category the total
number of COVID-19 related deaths by the source populations (UK, Italy, Belgium, France, Germany, Portugal,
and Spain) of the same age- and sex- specific category. These overall age- and sex-specific mortality rates were
applied to the age- and sex- specific distribution of the population of each of the included European countries
in order to estimate the number of expected cases in each country, which can be interpreted as the number of
COVID-19 deaths that each country would have had if they experienced the rates of the reference population
on 31/03/202023.
For each day, the number of cumulative observed deaths in each country was divided by the number of
expected deaths by end of the reference period, and multiplied by 100 to calculate the Standardised Mortality
Trend Ratio (SMTR) in the i-th day, with the following formula, as done p reviously22:
(Cumulative observed deaths)i
SMTRi = ∗ 100
Expected deaths by the end of reference period
95% confidence intervals of SMTR were calculated assuming a Poisson distribution. Subsequently, each SMTR
was multiplied by the crude death rate calculated in the reference period (total number of COVID-19 deaths
in the reference period divided by the total reference population) multiplied by 10,000 in order to obtain the
Adjusted Mortality Trend Ratio (AMTR) per million inhabitants in the i-th day, applying the following formula,
reviously23:
as described p
AMTRi = SMTRi × CMRreference sample ∗ 10, 000
The AMTR can be interpreted as the age- and sex-adjusted number of deaths per million inhabitants due to
COVID-19 if the population had experienced the same mortality rate as the reference population in the refer-
ence period (January–March 2020).
Results and discussion
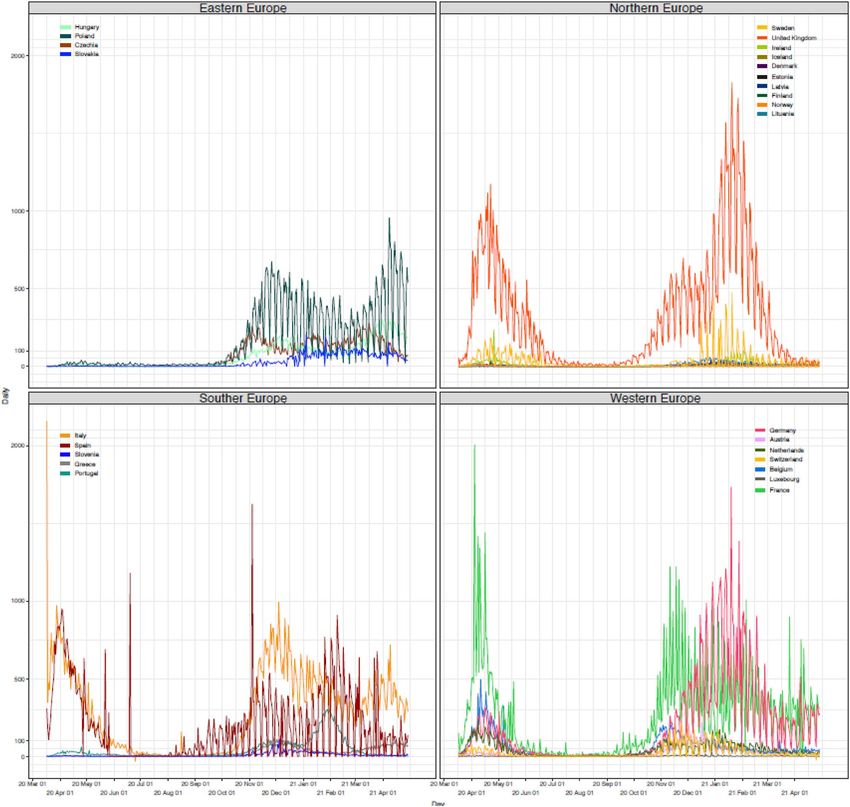
Cumulative mortality. Daily mortality varied by country and over time, with France reporting the overall
highest daily mortality on 04/04/2020, with 2004 deaths from COVID-19 in one day. Daily number of deaths
are plotted against time in Fig. 1 by European macro-region, Eastern, Norther, Southern, and Western countries.
Daily cumulative numbers of deaths were calculated in all European countries which were then ranked (Table 1).
Overall, a two-wave pattern is immediately evident for most of the early affected countries (UK, Italy, France,
Spain, Portugal, Ireland, Luxembourg, Switzerland, Belgium, Sweden, and the Netherlands) with steep increase
in mortality starting March/April 2020, a levelling off by the summer, and a new increase by October/November
2020. Hungary, Germany, Poland, Czech Republic, Slovakia, Greece, Lithuania, Latvia, Estonia, Denmark, and
Austria, on the other hand, witnessed an increase with varying steepness during the second wave, despite having
had very low mortality beforehand. Italy was the first country registering more than 20,000 deaths on 14/04/2020,
and totalled the second highest death tool of 120,053 deaths about a year later by the end of the observation
period (29/04/2021). A similar pattern was observed in France and Spain, with only about a week’s delay, which
however levelled off reaching a total of 104,302 and 79,684 deaths by 29/04/2021, respectively. In Spain the
increase mortality during the second wave starting from November 2020 was less pronounced compared to Italy
and France. Conversely, in the UK, despite the 20,000 deaths threshold being reached about 10 days after Italy,
the death toll increase was steady exceeding other countries by 14/05/2020 and the steep increase in mortality
during the second wave was abruptly levelled off starting in February/March 2021 most probably as result of the
early implementation of the vaccination c ampaign35. Nonetheless, UK registered the highest toll in Europe with
128,136 deaths by the end of the observation period. Germany and Poland, despite having avoided high mortality
during the first waves, witnessed a steep increase of the number of daily deaths starting from November 2020
reaching a total of 82,206 and 66,977 deaths, respectively, by 29/04/2020.
Crude mortality rates. Crude mortality rates were plotted as shown in Fig. 2 maintaining the division by
macro-region for facilitating interpretation; the resulting ranking of countries by the end of the study period is
reported in Table 1. On 29/04/2021, in Europe, the total mortality rate from COVID-19 was 1558 per million
inhabitants; this was highest in Hungary (2801 per million inhabitants on the same date) and lowest in Iceland
(82 deaths per million inhabitants). Once accounting for the total country population, Hungary, Czech Repub-
lic, and to a lesser extent Slovakia, reached the highest crude mortality rates, cumulated only during the second
wave, starting around October 2010. Belgium experienced the worst crude mortality rate among the countries
going through two waves, followed by Italy, UK, and to a lesser extent France, Spain and Luxembourg. Poland,
Slovenia, and Portugal, and to a lesser extent Lithuania reached high crude mortality rates during the second
wave only, but kept those below 1800 deaths per million.
Adjusted mortality trend ratios (AMTRs). AMTRs of each country are plotted in Fig. 3, and countries
were ranked accordingly in Table 1. When accounting for the underlying age and sex structure of each country,
the picture of COVID-19-related mortality distribution in Europe changed further, and four different patterns
could be identified: countries which experienced a two-wave pandemic, countries which did not experience
the first wave, but saw either a fast or slow increase in mortality during the second wave; and countries which
Scientific Reports | (2021) 11:16443 | https://doi.org/10.1038/s41598-021-95658-4 3
Vol.:(0123456789)www.nature.com/scientificreports/
Figure 1. Daily mortality from COVID-19 reported in selected European counties from 17/03/2020 to
29/04/2021.
maintained low mortality rates throughout the pandemic. These will be analysed and discussed in details in the
following sections.
Countries experiencing two‑wave pandemic. Eleven European countries experienced a clear-cut two-
wave pattern, albeit with some differences in intensity: Belgium, UK, Luxembourg, Spain, Italy, France, Sweden,
Portugal, Ireland, Switzerland and the Netherlands. Among these, Belgium remained the single country experi-
encing the highest adjusted mortality rate (AMTR on 29/04/2021: 2204/million), followed by the United King-
dom with a AMTR of 2119/million on the same date. Interestingly, AMTRs in UK have flattened considerably
starting from March 2021, probably as result of the early implementation of the vaccination campaign36. Once
accounting for the age- and sex-distribution of their underlying ageing populations, France, Italy and Spain
were comparatively less impacted compared to UK and Belgium, in particular during the second wave, reaching
similar AMTRs (1640; 1726; and 1727/million, respectively).
Notably, Luxembourg and Ireland, which had relatively low CMRs, ranked higher, with AMTRs higher than
1500/million (1802 and 1562/million, respectively) due to the young age distribution of their underlying popu-
lations. Sweden witnessed a steep increase in mortality during the first wave, comparable to the increase in the
UK, probably as result of not implementing and social distancing m easures37. In this category, the Netherlands
Scientific Reports | (2021) 11:16443 | https://doi.org/10.1038/s41598-021-95658-4 4
Vol:.(1234567890)www.nature.com/scientificreports/
Absolute number of deaths from Crude mortality rate from COVID-19
COVID-19 on 29/04/2021 on 29/04/2021 AMTRs from COVID-19 on 29/04/2021
1st United Kingdom Hungary Hungary
2nd Italy Czech Czech
3rd France Luxembourg Slovakia
4th Germany Slovakia Poland
5th Spain Belgium Belgium
6th Poland Italy United Kingdom
7th Czech United Kingdom Slovenia
8th Hungary Poland Luxembourg
9th Belgium Slovenia Spain
10th Netherlands Spain Italy
11th Portugal Portugal France
12th Sweden France Ireland
13th Slovakia Lithuania Portugal
14th Greece Sweden Lithuania
15th Austria Switzerland Sweden
16th Switzerland Austria Latvia
17th Ireland Latvia Switzerland
18th Lithuania Ireland Austria
19th Slovenia Netherlands Netherlands
20th Denmark Germany Estonia
21st Latvia Greece Germany
22nd Estonia Estonia Greece
23rd Finland Denmark Denmark
24th Luxembourg Finland Norway
25th Norway Norway Finland
26th Iceland Iceland Iceland
Table 1. Ranking of the included European countries for absolute number of death from COVID-19, crude
mortality rates, and Adjusted Mortality Trend Rations (AMTRs) on 20/06/2020.
succeeded best in keeping the second wave under control, despite e relatively high first wave. By the end of the
observation period their AMTRs was 1117.
All these countries belonging to the Western, Southern and Northern European groups played an important
role in international trade and were the ones with the highest COVID-19 importation risk during the early days
of the panemic due to their high travel flows directly from China38. Several factors might explain why these rela-
tively richer countries with mature healthcare systems were so heavily affected by the pandemic, in addition to
geography and positioning in the global economy39. Fiscal decentralisation and fragmented public health policy
responses between regions might also have contributed explaining low pandemic preparedness and performance
in countries like Belgium, Spain and Italy39,40. Early evidence from Italy, for example, showed how lack of efficient
data and information exchange between regional public health authorities undermined the country’s ability to
respond to the pandemic in a timely manner41. Privatisation and fragmentation of epidemiological surveillance
systems offers and additional explanation of the inability of this group of countries to effectively control the
pandemic39. Evidence suggested for example that the outsourcing of UK’s test and tracing system led to significant
data gaps and undermined local authorities ability to control the pandemic in an effective and focused manner42.
Countries with fast rising mortality during the second wave only. Hungary, Czech Republic, Slo-
vakia, and Poland, and to a lesser extent Slovenia, reported much higher age- and sex-adjusted mortality rates
than the other European countries, with the highest AMTRs, despite having experienced very low rates during
the first wave. Hungary remained the country experiencing the highest mortality, with AMTR of 3593/mil-
lion by 29/04/2021, with this steep mortality rise manifested only during the second wave. COVID-19-related
mortality in Slovakia was very similar to that experienced in the Czech Republic, once accounting for the age-
and sex-distribution of the underlying population. Both countries reached an ATMR of 3245 and 3357/million
respectively by the end of the observation period. In line with these countries, Poland and Slovenia, which suc-
ceeded in shielding the population from the first wave, experienced similar rapid increase of mortality during
the second wave, albeit less steep compared to Hungary, Czech Republic and Slovakia. AMTRs for Poland by the
end of the observation period was 2274/million, and for Slovenia 1897/million.
Although there is no single and uniform explanation for this group of countries, their early success in con-
taining the first wave of the COVID-19 pandemic is most probably related to the timely introduction of social
isolation measures and their relatively limited exposure to imported cases due to their peripheral role in global
economy and international trade39. It is also worth noticing that the Eastern European countries have weak
Scientific Reports | (2021) 11:16443 | https://doi.org/10.1038/s41598-021-95658-4 5
Vol.:(0123456789)www.nature.com/scientificreports/
Figure 2. Crude Mortality Rates (CMRs) from COVID-19 per 1,000,000 inhabitants in European countries
from 17/03/2020 to 29/04/2021.
public health and healthcare systems, as reflected to their significantly lower share of public revenues to total
health expenditure compared to EU a verage43, a fact that probably explains their poor performance during the
second wave of the pandemic when SARS-CoV2 had already significantly spread in the community. Authori-
tarian political leadership, and controversial-populistic policy responses combined with an ill resourced health
care system is the most probable explanation of Hungary’s low pandemic preparedness performance during the
second wave of the p andemic44.
Countries with slow rising mortality during the second wave only. Latvia, Lithuania, Austria,
Estonia, Germany, Denmark and Greece are countries which experienced a relatively low mortality during the
first wave (with AMTRs not exceeding 250/million), and a relatively slow increase in mortality during the sec-
ond wave.
This group of countries is quite heterogenous consisting of high-income central European countries, periph-
eral European economies (such as Greece) and Baltic countries. With the exception of Germany all of these
countries faced low COVID-19 importation risk38, which could explain their good performance during the
first wave of the pandemic. Regarding their pandemic preparedness and their performance during the second
pandemic wave, country-specific analysis would be needed in order to understand national trends and draw
country-specific conclusions. For example Greece, heavily affected by the 2008–18 recession and austerity was
ill prepared for a public health threat of such magnitude; the vulnerabilities of its public healthcare services and
surveillance system were fully revealed when cases and deaths steeply increased during the second and third
wave of the pandemic in the country despite an almost six months lasting second national l ockdown45.
Scientific Reports | (2021) 11:16443 | https://doi.org/10.1038/s41598-021-95658-4 6
Vol:.(1234567890)www.nature.com/scientificreports/
Figure 3. Adjusted Mortality Trend Rates (AMTRs) per 1,000,000 inhabitants due to mortality from COVID-
19 in European countries from 17/03/2020 to 29/04/2021.
Countries with consistently low‑COVID‑19‑related mortality. Finland, Iceland, and Norway are
the countries, among the included, which experienced a consistently low COVID-19 related mortality reaching
an a AMTR of 166, 119, and 174/million, respectively. In these Nordic countries high social cohesion, rela-
tively lower social inequalities, higher average public expenditure on health and social protection compared
to other European countries are the most probable explanations of their relatively better performance during
the COVID-19 p andemic43,46. Although Iceland, contrary to other islandic countries like New Zealand, kept its
borders open to tourism, it seems to have counterbalanced the risk of imported cases by extensive testing of its
population and double-testing of tourists during both waves of the pandmic47.
Overall strengths and limitations of this methodological approach. This paper provides a simple
method to compare COVID-19 mortality trends over time and across countries, accounting for the underlying
age structure of populations. By only using the total number of COVID-19 related deaths, routinely collected
in many countries, this method allows the calculation of AMTRs which are useful to comparatively monitor
pandemic trends, not only when comparing areas with profoundly different age structure, such as the global
North and the global South48, but even comparing different European countries. Most reports on COVID-19
epidemiological data to date have failed to take the underlying population structures into account. Some of the
previous attempts performed a standardisation on case fatality r ates49–51 therefore not overcoming the problems
of possible bias due to local policies, despite the standardisation. Only Heuveline and Tzen used an approach
comparable to the present one, through an indirect standardisation21; however they provided only a method for
Scientific Reports | (2021) 11:16443 | https://doi.org/10.1038/s41598-021-95658-4 7
Vol.:(0123456789)www.nature.com/scientificreports/
cross-sectional comparisons, and derived their sex- and age- specific ratios from the US population. This might
represent a problem as age- and sex- specific mortality might vary across countries, for example according to the
different prevalence of co-morbidities52 which increase the risk of mortality in COVID-19 positive i ndividuals53.
Conversely, using AMTRs, standardised against the age- and sex-distribution of mortality in a reference popula-
tion coming from the same countries under study, during a reference period, allowed a comparison of trends
both in space and over time uncovering features of the pandemic otherwise not easily detectable. In countries
where the social distancing measures have not been taken (i.e. Sweden) or have been substantially delayed (i.e.
Hungary) the curve of AMTRs shows a much steeper shape compared to other European countries which have
enforced stricter rules.
Deriving the age- and sex-specific rates from the sample population which is part of the population to which
data is standardised, guarantees consistency of the estimate allowing for differences in the distribution of under-
lying risk factors, and in the overall performance of the national health systems to be accounted for and not to
artificially bias the estimates, as can happen when rate are derived from external standard populations. Caution
needs to exerted in interpreting the AMTRs: given that COVID-19 crude fatality rate changes over t ime50,54,
AMTRs cannot be easily extrapolated to estimate infection prevalence over time.
The main potential limitations of this approach refers to the definition of mortality for COVID-19. Discrep-
ancies in defining deaths from COVID-19 at country/region level would affect the number of deaths reported
and therefore the estimated AMTRs. If all authorities would follow the strict guidance provided by the WHO29,
discrepancies will be minimised reinforcing the reliability of the present method. For example, some scientists
have shared concerns on how mortality from COVID-19 is being ascertained in Belgium where people dying in
care homes have been classified as dying from COVID-19 based on indirect evidence (the presence of infection in
the care home and the reporting of compatible symptoms)55. In addition, by calculating the cumulative mortality,
any error in death reporting would be carried on in the analysis. Moreover this method assumes that mortality
remains constant over time in the given populations. However, it is likely that the age-specific mortality rates
calculated during the first phases of the infection reflect an increased mortality of a more vulnerable population
exposed to comorbidities. Finally, it is important to bear in mind that mortality does not solely reflect the spread
of disease: mortality from COVID-19 is a function of disease incidence, severity, and quality of healthcare systems
to cope with infected and diseased people. Some have argued that patters of cohabitations, which are strongly
associated with the age structure of population in some cases, can influence discrepancies between infection and
mortality. A modelling study predicted in Italy a higher mortality with less infections compared to Mozambique
which would experience more infections but lower mortality, once adjusted for age56. If confirmed, this would
hamper even more the monitoring of infection through mortality.
Practical implications and future directions. Reliable comparisons of impact of COVID-19 at regional
or national level are essential for the monitoring of the spread of diseases in space and over time, and are instru-
mental for the retrospective analysis of different non-pharmacological policies currently enforced in many
affected countries57,58. Identifying four different patterns of COVID-19-related mortality distribution prompted
the analysis of similarities and differences in national policies which can contribute identifying the main drivers
of the pandemic mortality. In a context of rapid production of scientific evidence aimed at contributing to the
understanding and management of a pandemic of devastating proportion such as the COVID-19 one, the release
of solid, comparable data should be a high priority. The method proposed in this paper allows comparisons of
mortality in space and over time. By calculating age- and sex-distribution of mortality during a reference period
in wide populations (i.e. per continent), it would be possible to immediately and reliably compare the burden
of COVID-19 mortality across countries only plugging in the cumulative number of deaths (as reported by
Our World in Data, for e xample59). The authors urge the WHO to adopt this method to estimate the burden of
COVID-19 pandemic worldwide given the lack of international data by age and sex that can permit direct stand-
ardised rates. This would enrich the currently available data visualisation t ools30,59,60 with values better suited for
international comparison across demographically diverse regions of the world in order to indirectly evaluate the
effect of pharmacological and non-pharmacological interventions, and the environmental risk of e xposure61.
Notably, these comparison are now a days more and more important for both predicting the insurgence of new
variants via epidemiological surveillance, and the efficacy of the vaccine campaigns, at population level.
Data availability
All data used for this manuscript is publicly available on the referenced websites. Dr Gallo had full access to all
of the data in the study and takes responsibility for the integrity of the data and the accuracy of the data analysis.
She declares that this manuscript is honest, accurate, and transparent account of the study being reported; that
no important aspects of the study have been omitted. All co-authors had full access to the data, and can take
responsibility for the integrity of the data and the accuracy of the data analysis.
Received: 25 October 2020; Accepted: 23 July 2021
References
1. Steffens, I. A hundred days into the coronavirus disease (COVID-19) pandemic. Euro Surveill Bull. Eur. Sur Mal Transm. Eur.
Commun. Dis. Bull. https://doi.org/10.2807/1560-7917.ES.2020.25.14.2000550 (2020).
2. Li, Q. et al. Early transmission dynamics in Wuhan, China, of novel coronavirus-infected pneumonia. N. Engl. J. Med. https://doi.
org/10.1056/NEJMoa2001316 (2020).
3. Wang, W., Tang, J. & Wei, F. Updated understanding of the outbreak of 2019 novel coronavirus (2019-nCoV) in Wuhan, China. J.
Med. Virol. 92(4), 441–447 (2020).
Scientific Reports | (2021) 11:16443 | https://doi.org/10.1038/s41598-021-95658-4 8
Vol:.(1234567890)www.nature.com/scientificreports/
4. Rothan, H. A. & Byrareddy, S. N. The epidemiology and pathogenesis of coronavirus disease (COVID-19) outbreak. J. Autoimmun.
109, 1024 (2020).
5. Ren, L.-L. et al. Identification of a novel coronavirus causing severe pneumonia in human: A descriptive study. Chin Med J (Engl).
133(9), 1015–1024 (2020).
6. Chiolero, A. & Buckeridge, D. Glossary for public health surveillance in the age of data science. J. Epidemiol. Community Health
74(7), 612–616 (2020).
7. Tarantola, D. & Dasgupta, N. COVID-19 surveillance data: A primer for epidemiology and data science. Am. J. Public Health
111(4), 614–619 (2021).
8. Ibrahim, N. K. Epidemiologic surveillance for controlling Covid-19 pandemic: Types, challenges and implications. J. Infect. Public
Health 13(11), 1630–1638 (2020).
9. Schneider, E. C. Failing the test—The tragic data gap undermining the U.S. pandemic response. N. Engl. J. Med. 383(4), 299–302
(2020).
10. Kondilis, E., Papamichail, D., Gallo, V. & Benos, A. COVID-19 data gaps and lack of transparency undermine pandemic response.
J. Public Health Oxf. Engl. 43(2), e307–e308 (2021).
11. Wehbe, S. et al. COVID-19 in the Middle East and North Africa region: an urgent call for reliable, disaggregated and openly shared
data. BMJ Glob. Health. 6(2), e005175 (2021).
12. Pearce, N., Lawlor, D. A. & Brickley, E. B. Comparisons between countries are essential for the control of COVID-19. Int. J. Epi-
demiol. 49, 1059–1062 (2020).
13. Raghu, G. & Wilson, K. C. COVID-19 interstitial pneumonia: monitoring the clinical course in survivors. Lancet Respir. Med. 8,
839–842 (2020).
14. Tian, T. et al. Risk factors associated with mortality of COVID-19 in 3125 counties of the United States. Infect. Dis. Poverty 10(1),
3 (2021).
15. Do, D. P. & Frank, R. Unequal burdens: Assessing the determinants of elevated COVID-19 case and death rates in New York City’s
racial/ethnic minority neighbourhoods. J. Epidemiol. Community Health 75, 321–326 (2020).
16. Krieger, N., Waterman, P. D. & Chen, J. T. COVID-19 and overall mortality inequities in the surge in death rates by zip code
characteristics: Massachusetts, January 1 to May 19, 2020. Am. J. Public Health 110(12), 1850–1852 (2020).
17. Cho, S. I., Yoon, S. & Lee, H.-J. Impact of comorbidity burden on mortality in patients with COVID-19 using the Korean health
insurance database. Sci. Rep. 11(1), 6375 (2021).
18. Schwab, P. et al. Real-time prediction of COVID-19 related mortality using electronic health records. Nat. Commun. 12(1), 1058
(2021).
19. Verity, R. et al. Estimates of the severity of coronavirus disease 2019: A model-based analysis. Lancet Infect. Dis. 20, 669–677 (2020).
20. Bhopal, R. Covid-19 worldwide: we need precise data by age group and sex urgently. BMJ 369, m1366 (2020).
21. Heuveline, P. & Tzen, M. Beyond deaths per capita: Comparative CoViD-19 mortality indicators. medRxiv https://d oi.o
rg/1 0.1 101/
2020.04.29.20085506v9 (2020).
22. Gallo, V., Chiodini, P., Bruzzese, D. & Bhopal, R. Age-and sex-adjustment and the COVID-19 pandemic—Transformative example
from Italy. Int. J. Epidemiol. 49(5), 1730–1732 (2020).
23. Naing, N. N. Easy way to learn standardization: Direct and indirect methods. Malays. J. Med. Sci. MJMS 7(1), 10–15 (2000).
24. Technical guidance. https://www.who.int/emergencies/diseases/novel-coronavirus-2019/technical-guidance
25. Venter, M. & Richter, K. Towards effective diagnostic assays for COVID-19: A review. J. Clin. Pathol. 73(7), 370–377 (2020).
26. Pollock, A. M. & Lancaster, J. Asymptomatic transmission of covid-19. BMJ 371, 4851 (2020).
27. Kumleben, N. et al. Test, test, test for COVID-19 antibodies: The importance of sensitivity, specificity and predictive powers. Public
Health 11(185), 88–90 (2020).
28. Chowdhury, R. et al. Long-term strategies to control COVID-19 in low and middle-income countries: An options overview of
community-based, non-pharmacological interventions. Eur. J. Epidemiol. 35(8), 743–748 (2020).
29. WHO. International guidelines for certification and classification (coding) of COVID-19 as cause of death (2020).
30. COVID-19 situation update worldwide, as of 12 May 2020. Eur. Cent. Dis. Prev. Control. https://www.ecdc.europa.eu/en/geogr
aphical-distribution-2019-ncov-cases (2020).
31. Home - Office for National Statistics. https://www.ons.gov.uk/ (2020).
32. Epicentro. Epidemia COVID19 Aggiornamento nazionale 23marzo 2020—ore 16:00. Italian National Institute of Health. https://
www.epicentro.iss.it/coronavirus/bollettino/Bollettino-sorveglianza-integrata-COVID-19_23-marzo%202020.pdf (2020).
33. Demographics of COVID-19 Deaths - Data & metadata. https://dc-covid.site.ined.fr/en/data/ (2020).
34. Total population by sex and age. https://stats.oecd.org/Index.aspx?DataSetCode=RPOP# (2020).
35. Vaccinations in the UK | Coronavirus in the UK. https://coronavirus.data.gov.uk/details/vaccinations (2021).
36. Pritchard, E. et al. Impact of vaccination on new SARS-CoV-2 infections in the United Kingdom. Nat. Med. https://doi.org/10.
1038/s41591-021-01410-w (2021).
37. Born, B., Dietrich, A. M. & Müller, G. J. The lockdown effect: A counterfactual for Sweden. PLoS ONE 16(4), e0249732 (2021).
38. Pullano, G. et al. Novel coronavirus (2019-nCoV) early-stage importation risk to Europe, January 2020. Eurosurveillance 25(4),
2000057 (2020).
39. Baum, F. et al. Explaining covid-19 performance: What factors might predict national responses?. BMJ 372, n91 (2021).
40. Rocco, P., Rich, J. A. J., Klasa, K., Dubin, K. A. & Béland, D. Who counts where? COVID-19 surveillance in federal countries. J.
Health Polit. Policy Law 21, 9349114 (2021).
41. Carinci, F. Covid-19: preparedness, decentralisation, and the hunt for patient zero. BMJ 368, bmj.m799 (2020).
42. Roderick, P., Macfarlane, A. & Pollock, A. M. Getting back on track: control of covid-19 outbreaks in the community. BMJ 369,
m2484 (2020).
43. Health at a Glance: Europe 2020: State of Health in the EU Cycle. https://www.oecd-ilibrary.org/social-issues-migration-health/
health-at-a-glance-europe-2020_82129230-en;jsessionid=ZYCayDD1ubqWvmkOGQi_pwh5.ip-10-240-5-68 (2021).
44. Karáth, K. Covid-19: Hungary’s pandemic response may have been worse than the virus. BMJ 4(371), m4153 (2020).
45. Kondilis, E., Tarantilis, F., Seretis, S. & Benos, A. The COVID-19 epidemic in Greece: A critical assessment of the policy responses
for its management. in COVID-19 Pandemic Contemp Public Health Threats (TOPOS Publications, 2021).
46. Sharples, N., Curtis, M. & Bramall, M. The alternatives—approaches towards a life in full. Health Poverty in Action: Health for all
in a just world. https://www.healthpovertyaction.org/wp-content/uploads/2018/12/The-Alternatives-report-WEB.pdf
47. Scudellari, M. How Iceland hammered COVID with science. Nature 587, 536–539 (2020).
48. Noor, A. U., Maqbool, F., Bhatti, Z. A. & Khan, A. U. Epidemiology of CoViD-19 Pandemic: Recovery and mortality ratio around
the globe. Pak. J. Med. Sci. 36(COVID19-84), S79–S84 (2020).
49. Bignami S, Ghio D. A demographic adjustment to improve measurement of COVID-19 severity at the developing stage of the
pandemic. medRxiv 2020.03.23.20040998 (2020).
50. Dudel, C. et al. Monitoring trends and differences in COVID-19 case fatality rates using decomposition methods: Contributions
of age structure and age-specific fatality. medRxiv https://doi.org/10.1101/2020.03.31.20048397v4 (2020).
51. Sudharsanan, N., Didzun, O., Bärnighausen, T. & Geldsetzer, P. The contribution of the age distribution of cases to COVID-19
case fatality across countries: A 9-country demographic study. Ann. Intern. Med. 173, 714–720 (2020).
Scientific Reports | (2021) 11:16443 | https://doi.org/10.1038/s41598-021-95658-4 9
Vol.:(0123456789)www.nature.com/scientificreports/
52. Nepomuceno, M. R. et al. Besides population age structure, health and other demographic factors can contribute to understanding
the COVID-19 burden. Proc. Natl. Acad. Sci. USA 117(25), 13881–13883 (2020).
53. Parsay, S., Vosoughi, A., Khabbaz, A. & Sadigh-Eteghad, S. The incidence and mortality ratio of ischemic cerebrovascular accidents
in COVID-19 cases: A systematic review and meta-analysis. J. Stroke Cerebrovasc. Dis. 30(3), 1055 (2021).
54. Fan, G. et al. Decreased case fatality rate of COVID-19 in the second wave: A study in 53 countries or regions. Transbound Emerg.
Dis. 68, 213–215 (2020).
55. Lee, G. Why so many people are dying in Belgium. BBC News. https://www.bbc.com/news/world-europe-52491210 (2020).
56. Esteve, A., Permanyer, I., Boertien, D. & Vaupel, J. W. National age and coresidence patterns shape COVID-19 vulnerability. Proc.
Natl. Acad. Sci. USA 117(28), 16118–16120 (2020).
57. Hoxha, A. et al. Asymptomatic SARS-CoV-2 infection in Belgian long-term care facilities. Lancet Infect. Dis. 21, e67 (2020).
58. Pollán, M. et al. Prevalence of SARS-CoV-2 in Spain (ENE-COVID): A nationwide, population-based seroepidemiological study.
Lancet Lond. Engl. 396, 535–544 (2020).
59. Roser, M., Ritchie, H., Ortiz-Ospina, E. & Hasell, J. Coronavirus Pandemic (COVID-19). Our World Data. https://o urwor ldind
ata.
org/coronavirus (2020).
60. WHO Coronavirus (COVID-19) Dashboard. https://covid19.who.int (2021).
61. Coccia, M. An index to quantify environmental risk of exposure to future epidemics of the COVID-19 and similar viral agents:
Theory and practice. Environ Res. 191, 110155 (2020).
Acknowledgements
We are grateful to all the colleagues of the covid19researchers group, who daily share their thoughts, insights,
expertise and local wisdom with everyone in the group. We have shared the pre-print of this manuscript and
they have contributed to improve its discussion, highlighting strengths and weaknesses.
Author contributions
Study concept and design: V.G., R.B., P.C., D.B. Analysis and interpretation of data: VG., P.C., D.B. Drafting of
the manuscript: V.G. Data collection: V.G. Critical revision of the manuscript for important intellectual content:
R.B., J.M., E.K., D.H.
Competing interests
The authors declare no competing interests.
Additional information
Correspondence and requests for materials should be addressed to V.G.
Reprints and permissions information is available at www.nature.com/reprints.
Publisher’s note Springer Nature remains neutral with regard to jurisdictional claims in published maps and
institutional affiliations.
Open Access This article is licensed under a Creative Commons Attribution 4.0 International
License, which permits use, sharing, adaptation, distribution and reproduction in any medium or
format, as long as you give appropriate credit to the original author(s) and the source, provide a link to the
Creative Commons licence, and indicate if changes were made. The images or other third party material in this
article are included in the article’s Creative Commons licence, unless indicated otherwise in a credit line to the
material. If material is not included in the article’s Creative Commons licence and your intended use is not
permitted by statutory regulation or exceeds the permitted use, you will need to obtain permission directly from
the copyright holder. To view a copy of this licence, visit http://creativecommons.org/licenses/by/4.0/.
© The Author(s) 2021
Scientific Reports | (2021) 11:16443 | https://doi.org/10.1038/s41598-021-95658-4 10
Vol:.(1234567890)You can also read