COVID-19 in Latin America and the Caribbean - International ...
←
→
Page content transcription
If your browser does not render page correctly, please read the page content below
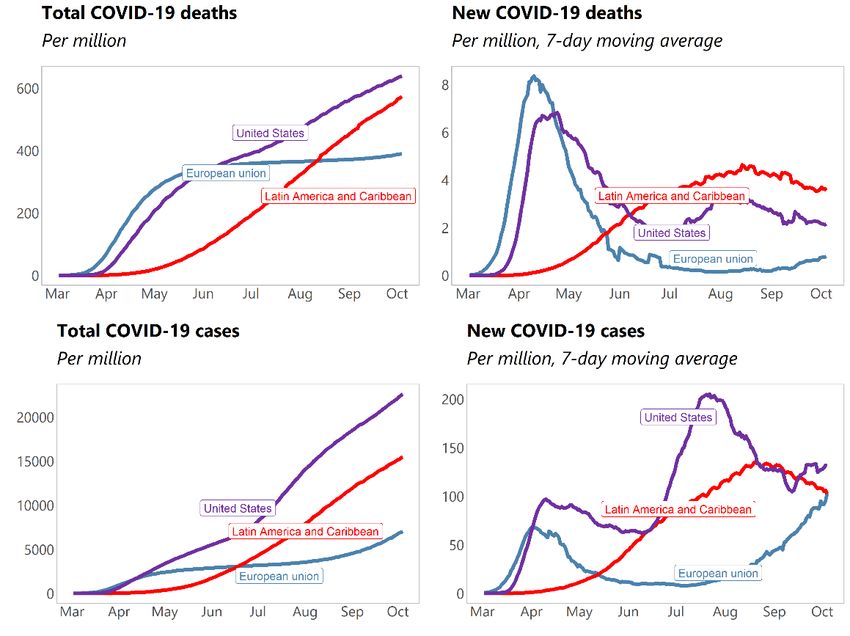
COVID-19 in Latin America and the Caribbean
 A High Toll on Lives and Livelihoods 1
Latin America and the Caribbean (LAC) has been hard hit by the COVID-19 crisis both in terms of lives and of
livelihoods. An early and prolonged lockdown in some countries helped prevent the rapid explosion of deaths that Western
Europe and the eastern US experienced. However, the lockdowns only slowed the epidemic but did not stop it, and over time
their effectiveness declined. Combined with initial vulnerabilities associated with high informality, low access to health
services, low government effectiveness, high poverty and densely populated urban areas, the outcome has been a high toll on
lives and livelihoods in many countries.

Introduction
The LAC region was hit later than some other hot spots by the COVID-19 pandemic but, after
struggling to contain it, has become among the hardest hit regions in the world in terms of
health outcomes. With only 8.2 percent of the world population (640 million people), the region had
36 percent of all deaths (369 thousand) by early October; and the economy suffered the largest recession
on record. The first case in Brazil was confirmed on February 25, and by late March the country had had
only 5 thousand cases. Nonetheless, since then the region saw a long and steady climb in cases and deaths
with peaks appear to have been reached only recently, in late August. The region currently has a higher
rate of new deaths per million people than the United States and the European Union (Figure 1 and
Annex 1). South America and Mexico have been hit harder than Central America and the Caribbean
(Figure 2). The Caribbean has been the region with the lowest death toll, and some islands have
completely eradicated the epidemic (although some that reopened to travel subsequently saw rebounds).
In terms of individual countries, the death toll per million has been highest in Peru, followed by Brazil,
Bolivia, Chile, Ecuador, and Mexico (Figure 3 and Annex Table 1.1). Official statistics are likely to
understate cases and deaths, as testing is low in many countries, and “excess deaths” in a number of
countries significantly exceed official COVID-19 deaths (Box 1).
The COVID-19 crisis has also had a significant economic impact in the LAC region. The LA5 countries
experienced larger quarterly GDP contractions than in any recession on record. LAC economic activity is
expected to contract by 8.1 percent in the current year, which will surpass both the global growth
contraction of 4.4 percent and that in emerging countries (of 3.3 percent).
Against this background, the chapter explores the COVID-19 pandemic with an eye on understanding
LAC’s simultaneously poor health and economic outcomes. In particular, we focus on the following
questions: First, how has the pandemic evolved in LAC, compared to other regions? Second, what
factors have contributed to the partial ineffectiveness of lockdowns in LAC? Third, what factors may
have explained the significant economic contractions observed in LAC during the first semester of 2020?
The rest of the chapter is organized as follows. In section 2 we discuss a taxonomy to classify the
different patterns of the pandemic observed in the world—which we identify as forest fires, slow burns,
and put-outs. We use that taxonomy to understand the factors that may explain the distinctive pandemic
pattern observed in LAC countries. Section 3 discusses the impact of the pandemic on the economy and
the relative contributions of lockdown and voluntary behavioral changes as well as the developments
since the reopenings started. Section 4 concludes.

_____________________________
1Thischapter was prepared by a WHD team headed by Bas Bakker and Carlos Goncalves, and including Pedro Rodriguez,
Mauricio Vargas, Dmitry Vasilyev, Carlo Pizzinelli, Vibha Nanda, and Alain Brousseau.

 International Monetary Fund | October 2020
REGIONAL ECONOMIC OUTLOOK: WESTERN HEMISPHERE

 Figure 1. COVID-19 Global Overview

 Sources: Johns Hopkins University; and IMF staff calculations.
 Note: Regional aggregates are weighted averages. Latest data are as of October 1, 2020.

 Figure 2. COVID-19 in Latin America and the Caribbean

 Total COVID-19 Deaths New COVID-19 Deaths
 (Per million people) (Per million people; 7-day moving average)
 700 6

 600 5
 500 South America + Mexico
 4
 South America + Mexico
 400
 3
 300
 CAPDR
 2
 200 CAPDR

 100 1
 Caribbean Caribbean

 0 0
 24-Jun

 15-Jul

 24-Jun
 26-Aug

 15-Jul

 26-Aug
 29-Jan

 29-Jan
 19-Feb

 19-Feb
 22-Apr

 22-Apr
 3-Jun

 3-Jun
 5-Aug

 5-Aug
 8-Jan

 8-Jan
 11-Mar

 13-May

 13-May
 1-Apr

 11-Mar

 1-Apr
 16-Sep

 16-Sep

 Sources: Johns Hopkins University; and IMF staff calculations.
 Note: Regional aggregates are weighted averages. Latest data are as of October 1, 2020.

2 International Monetary Fund | October 2020
COVID-19 IN LATIN AMERICA AND THE CARIBBEAN

 Figure 3. Cases and Deaths in Selected Countries
 (Per million)
 30,000 1,200
 Cases
 25,000 Death s (right scale) 1,000

 20,000 800

 15,000 600

 10,000 400

 5,000 200

 0 0

 ECU

 CAPDR

 ARG
 ESP

 COL
 PRY
 CARIB

 BRA

 PER
 URY

 RUS
 MEX

 BOL

 CHL
 ITA

 USA
 IND
 Sources: Johns Hopkins University; and IMF staff calculations.

Early and Stringent Lockdowns, but High Death Toll
Many countries in Latin America have had stringent and protracted lockdowns, which have been
associated with an initial sharp decline in mobility (Figures 4 and 5). They typically started around
the same time as the lockdowns in Europe but have been more stringent (according to the Oxford
stringency indicators) and longer-lived. At the peak, mobility in Peru was 80 percent below normal. 2
Other countries in the region also saw very large declines.
 Figure 4. Lockdowns in Latin America and Elsewhere Figure 5. The Decline in Mobility in Latin America and
 (Oxford Stringency Index, maximum = 100) Elsewhere
 (Percent)

 Source: Google COVID-19 hub. Source: Google COVID-19 hub.
 https://storage.googleapis.com/COVID-19-open-data/v2/main.csv Note: Mobility measures are based on aggregated, anonymized sets of data
 from mobile device users who have turned on the location history setting.
 Since the behavior regarding turning on location history may be different
 across countries, mobility measures may not be comparable.

The early and stringent lockdowns in Latin America were successful in preventing an explosion
of daily cases and deaths, which would have been disastrous for LAC given the weak capacity of the
health systems.
But they have been less successful in containing the total number of deaths. Peru has the highest
death toll per capita in the world, and Brazil, Mexico, and Chile have a death toll similar to Spain and the

_____________________________
2Mobility measures are based on aggregated, anonymized sets of data from mobile device users who have turned on the location
history setting. Since the behavior regarding turning on location history may be different across countries, mobility measures may
not be strictly comparable across countries.

 International Monetary Fund | October 2020 3
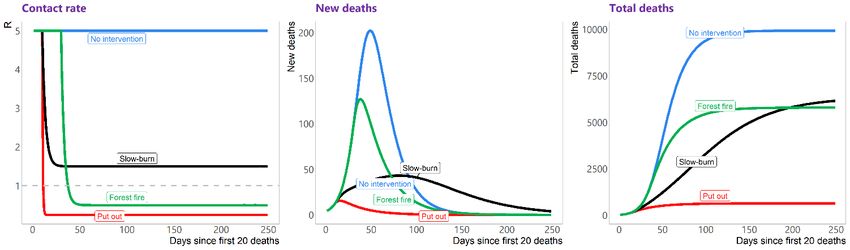
REGIONAL ECONOMIC OUTLOOK: WESTERN HEMISPHERE

US. The pattern of daily deaths was different from that observed in several western European countries.
France and Spain saw an explosion in daily deaths in March and April, followed by a rapid decline (a
“forest fire”). Latin America instead saw a “slow-burn.” In Brazil and Mexico, daily deaths increased
steadily between March and June, and then plateaued for several months (Figures 6 and 7).
What explains this difference? Why has much of Latin America seen a “slow-burn,” while Western
Europe saw a “forest-fire”? And why did some countries see a “put-out” (as occurred, for example, in
many Caribbean islands?).
 Figure 6. Daily COVID-19 Deaths: Brazil and Mexico Figure 7. Total COVID-19 Deaths: Brazil and Mexico
 Compared with France and Spain Compared with France and Spain
 (Per million, 7 day moving average) (Per million)

 Sources: Google COVID-19 hub; and IMF staff calculations. Sources: Google COVID-19 hub; and IMF staff calculations.

Europe Had Forest-Fires; Latin America Had Slow Burns—Why Has
Latin America Been Different?
The pattern of the COVID-19 pandemic in LAC appears to have been shaped by interaction of
government policies, individual actions, and structural factors. The effectiveness of the government
policies depends to a large degree on their interaction with individual actions—such as mobility
patterns—and with structural factors (such as working and living conditions, among others).
The timing and partial effectiveness of the lockdowns seems to be behind the slow burn pattern
We can illustrate the patterns and the dependence of the pandemic dynamic on the timing and
effectiveness of the lockdowns using an SEIR model (Figure 8.) In the absence of any action or
behavioral change, an explosion of deaths followed by rapid decline will ensue. An early reduction of the
contact rate below a threshold will eradicate the disease (“put-out”). 3 An early reduction of the contact
rate but to a level above a threshold results in a slow burn. Late intervention resembles a forest fire.
According to the SEIR model, the later the intervention occurs, the more severe the forest fire is, and the
higher the number of peak deaths. The evolution of new and total deaths looks remarkably similar to
those in Figures 6–7.

_____________________________
3The contact rate is one of the three components of the basic reproduction number (R0). The other two are the duration of
contagiousness after a person becomes infected, and the likelihood of infection per contact between a susceptible person and an
infectious person. The effective reproduction number R is similar to R0 but does not assume complete susceptibility of the
population and, therefore, can be estimated with populations having immune members. When R-effective is greater than one,
the epidemic is expanding while if it is lower than one the epidemic is dying out. See P.L. Delamater, E.J. Street, T.F. Leslie, Y.
Yang and K.H. Jacobsen, Complexity of the Basic Reproduction Number (R0), Emerging Infectious Diseases (2019), 25(1):1-4.

4 International Monetary Fund | October 2020
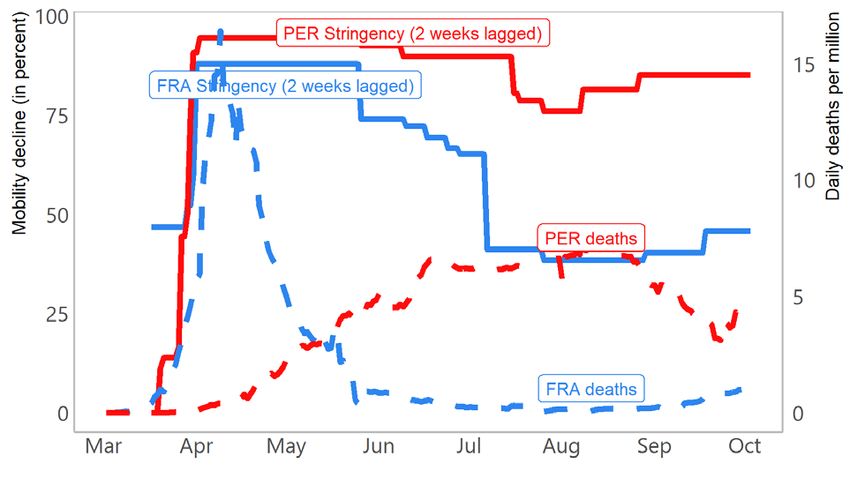
COVID-19 IN LATIN AMERICA AND THE CARIBBEAN

 Figure 8. Modeling Lockdown Types Using the SEIR Model

 Source: IMF staff calculations.

Early lockdowns helped prevent forest fires…
Latin America locked down early. In Peru, the daily number of deaths two weeks after the lockdown—a
proxy of the spread of the disease at the time of the lockdown—was still very low. 4 In a number of
European countries, by contrast, the daily death toll two weeks after the lockdown was much higher
(Figure 9). As a result, Latin America did not experience forest fires, which likely would had
overwhelmed a poorly prepared health system, leading to even higher death numbers.
… but did not stop the epidemic altogether
However, lockdowns in Latin America did not manage to bring the number of people infected by each
patient (the “R-effective “) to below 1. In Peru, for example, R-effective fell, but remained above 1
(Figure 10). But why did LAC’s lockdowns not manage to be fully effective? The key factors relate to the
behavioral and structural aspects that we explore below.
 Figure 9. Stringency and Daily COVID-19 Deaths: Figure 10. R-effective: Peru and France
 Peru and France (R < 1: pandemic on retreat, R > 1: pandemic expanding)

 Sources: Google COVID-19 hub; and IMF staff calculations. Sources: Google COVID-19 hub; and IMF staff calculations.

_____________________________
4We measure the timeliness of a lockdown by looking at how widespread the disease was at the time of the lockdown. If the
number of daily new cases per million people is already high, the lockdown is late, it the number of daily new cases is still low, it
is early. As the number of new cases is often several underestimated because of lack of testing, we look instead at the number of
deaths two weeks after lockdown. Given the lags, this is a good proxy for the number of new cases at the time of lockdown. And
because of the lag, the number of deaths two weeks after lockdown is not yet affected by the lockdown itself.

 International Monetary Fund | October 2020 5
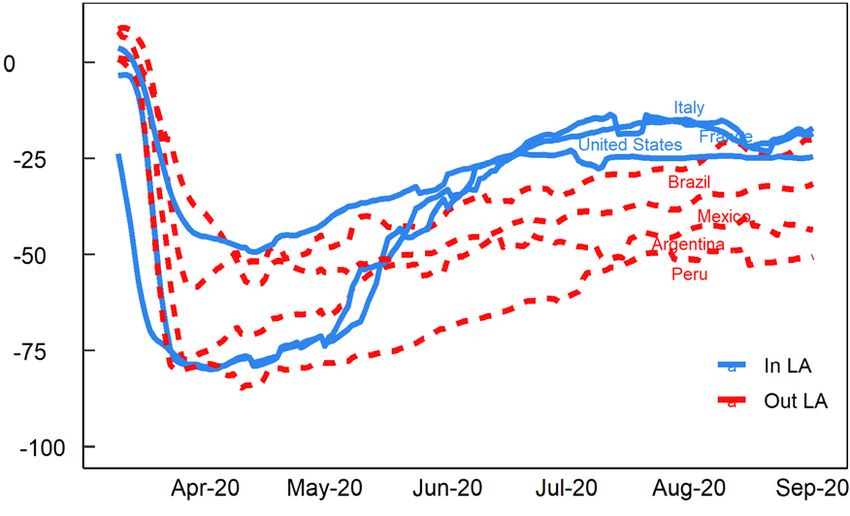
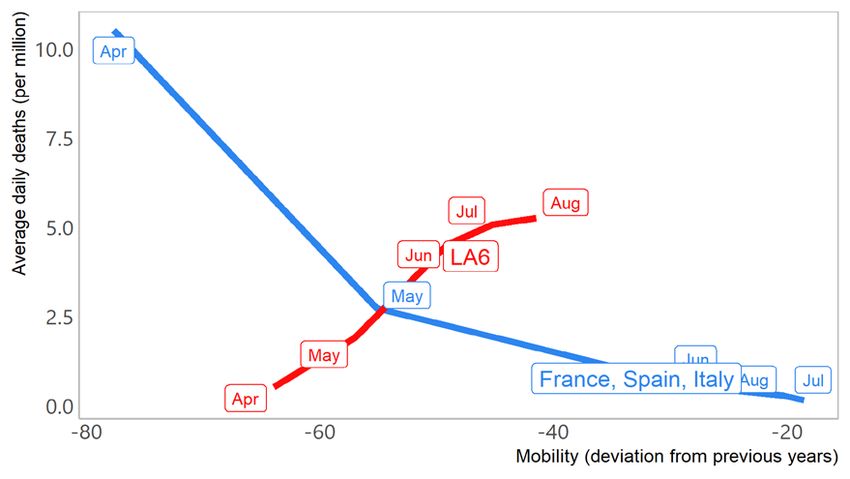
REGIONAL ECONOMIC OUTLOOK: WESTERN HEMISPHERE

Structural factors and government policies may have hampered the effectiveness of lockdowns
The nature of work (informal) and living conditions (densely populated poor communities) as well as
weak institutional capacity in Latin America may have hampered the effectiveness of lockdowns. As
discussed in Box 2, flattening the curve may be a challenge for countries with high degrees of economic
informality and low government effectiveness—two features that are symptomatic of LAC region
(Figures 11 and 12). Other empirical work has identified that higher population density and weak health
systems may also be a factor hampering the effectiveness of containment policies (Deb, Furceri, Ostry,
and Tawk, 2020).
 Figure 11. Informality Figure 12. Government Effectiveness
 (Percent, average by region) (Higher is better, average by region)

 Source: International Labour Organization; and IMF staff calculations. Source: Worldbank, Worldwide Governance Indicators database; and IMF staff
 Note: AFR = Africa; ASP = Asia and Pacific; EUR = Europe; LAC = Latin calculations.
 America and the Caribbean; MNC = Middle East, North Africa, Central Asia; Note: AFR = Africa; ASP = Asia and Pacific; EUR = Europe; LAC = Latin
 UCA = United States and Canada. America and the Caribbean; MNC = Middle East, North Africa, Central Asia;
 UCA = United States and Canada.

Anecdotal evidence from Peru provides some indication of how these factors may have operated in
practice and also points towards possible additional factors. In particular, crowded living conditions and
agglomerations in food markets and banks may have contributed to the spread of the virus and
diminished the effectiveness of the lockdowns. Limited financial inclusion and informal working
conditions may have also contributed, as a nontrivial share of households needed to go to the banks in
person to receive the government’s cash transfers and also to do food purchases in cash in food markets.
Lockdown fatigue and the necessity to work have likely contributed to the only partial
effectiveness of lockdowns
A further reason for the only partial effectiveness of lockdowns may have been “lockdown fatigue” and
the necessity of low-income households to engage in economic activity, i.e. overcoming the fear of
infections. The result was an increase in mobility in Latin America from April onwards (Figure 13). This
increase in mobility may have further contributed to the spreading of the disease. As Figure 14 illustrates,
the rebound in mobility in Latin America occurred when the daily death toll was still rising. By contrast,
the rebound in Europe occurred when daily deaths were in clear retreat. 5

_____________________________
5More recently, Europe has seen a surge in new cases, although new deaths have remained more subdued. The pickup in Europe
may be associated with increased mobility.

6 International Monetary Fund | October 2020
COVID-19 IN LATIN AMERICA AND THE CARIBBEAN

 Figure 13. Mobility in LA6 Figure 14. Mobility and Daily Death Toll
 (Deviation from previous years, percent) (Unweighted country averages)

 Sources: Google COVID-19 hub; and IMF staff calculations. Sources: Google COVID-19 hub; and IMF staff calculations.

Factors that affected the death toll
In addition to the factors that hamper the effectiveness of lockdowns and facilitate the spread of the
disease, there are other factors that affect the death toll from COVID-19 more directly. Box 3 explores
the role of “fundamentals” in COVID-19-related deaths. Population size, 6 low hospital capacity, aging
population, and the lack of routine BCG vaccination are on average associated with higher COVID-19
deaths. 7,8 (Figure 15) Although the region as a whole has a relatively young population and routine BCG
vaccination, its health system was poorly prepared to the task. What the evidence from Box 3 suggests is
that even controlling for these “deep-determinants”, too many deaths happened in many countries in the
region. In particular, the regressions residuals are excessively large for Peru, Brazil, Chile, Bolivia, and
Mexico.
 Figure 15. Factors that Influenced COVID-19 Deaths in LA Countries
 300 14 120
 Average Deaths COVID Indicators
 (Per million people) (Average per group)

 250 12
 100

 10 Advanced
 200 Other EMs 80
 LAC
 8
 150 60
 6

 100 40
 4

 50 20
 2

 0 0
 0
 High Low High Low Yes No BCG vaccine
 Hospital beds per Age 70+
 Hospital beds Age BCG vaccine 1,000

 Sources: Johns Hopkins University; Our World in Data database; and IMF staff calculations.
 Note: Hospital beds: high/low = above/below world median; Age: high/low = above/below 6.5 percent of elderly; BCG =
 Bacille Calmette-Guérin.. Age 70 + (share in total population); BCG vaccine (share in group total).

_____________________________
6In cross-country regressions, population size is significant while population density and the share of people living in urban areas
are not. We suspect population size may be a better proxy for the degree of actual connectedness amongst citizens since a
geographically large country can feature both large voids and some densely packed areas. Population size may also capture the
degree of logistical challenges involved in ensuring compliance with the lockdowns by a larger number of people. Finally, the
reach of central governments might be more limited in larger polities.
7We interpret the variable “Hospital beds per 1,000 people” as a reasonable proxy for the quality of the whole health system.
8Other authors have reached similar conclusions. For example, Banik, Naq, Chowdury and Chatterjee (2020) conclude that “our

study reveals that factors such as public health system, population age structure, poverty level and BCG vaccination are powerful
contributory factors in determining fatality rates.”

 International Monetary Fund | October 2020 7
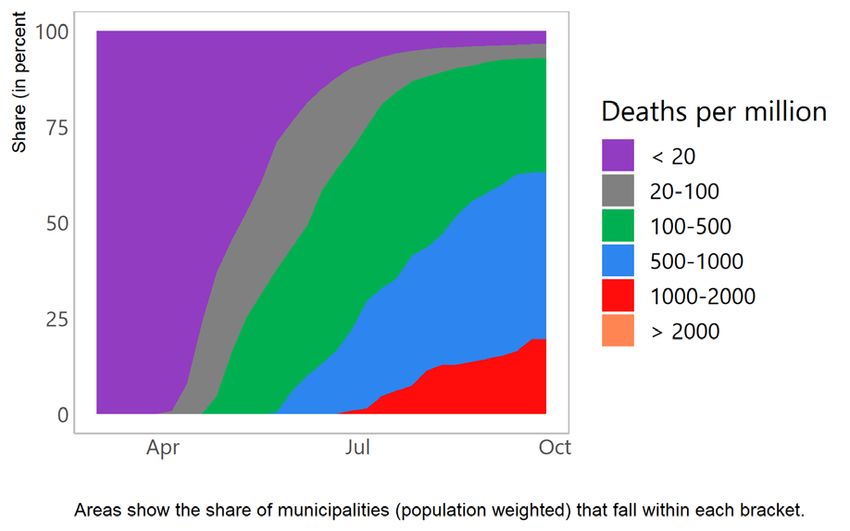
REGIONAL ECONOMIC OUTLOOK: WESTERN HEMISPHERE

Using data on individual municipalities in Latin America, we also find that the total death toll is higher in
more densely populated municipalities, where the contact rate is likely to be higher, as well as in locations
further away from the equator likely reflecting that climate plays a role in the virus' ability to reproduce
itself.
The geographical spread of COVID-19 in LAC
The increase in COVID-19 deaths over time Figure 16. Latin America: Spread of COVID-19 at the
does not just reflect an increase in deaths in Subnational Level
already affected areas, but also a geographical (Distribution of total COVID-19 deaths per million, population
spread to areas that had previously not been weighted)
infected.
Subnational Level
Figure 16 shows the spread at the subnational level
(typically states) of all countries in Latin
America. In late April about three quarters of
Latin America regions had less than 20 deaths per
million inhabitants; by July it was less than a
quarter. There were sharp geographical
differences; some regions have now more than Source: IMF staff calculations.
2 thousand deaths per million while others have Note: Areas show the share of subnational regions (population weighted) that
 fall within each bracket).
less than 20.
Turning to regions in individual countries, in mid-May, only 20 percent of Brazil had a death toll of more
than 100 per million; by mid-July, this had increased to 100 percent (Figure 17)
 Figure 17. Percentage of Country where COVID-19 Death Toll Exceeds 100, 400, 800, and 1,200 per Million
 (Percent; population weighted)

 Sources: Google COVID-19 hub; and IMF staff calculations.
 Note: Lines show the population share of the states within in a country where total deaths per million exceeded the threshold.

8 International Monetary Fund | October 2020
COVID-19 IN LATIN AMERICA AND THE CARIBBEAN

Local Level
Figure 18 shows the spread at the municipality Figure 18. Mexico: Spread of COVID-19 at the
level in Mexico. In April, almost all of Mexico Municipal Level
had less than 20 deaths per million. By July, it (Distribution of total COVID-19 deaths per Million, population-
 weighted)
was less than 10 percent. There are large
geographical differences within Mexico as well: a
tenth of municipalities has between one and two
thousand deaths per million, while 7 percent has
less than 100 deaths per million.

The Impact of Lockdowns and
Behavioral Changes on
Economic Activity and Mobility
The significant economic impact of the Source: IMF staff calculations.
COVID-19 pandemic in LAC is a result of the Note: Areas show the share of municipalities (population weighted) that fall
 within each bracket).
government policies (lockdowns) as well as
the behavioral response, though the impact Figure 19. Distribution of GDP Growth
of both factors has diminished over time. (Density of year-on-year GDP growth in WEO Database)

The COVID-19 pandemic has had a major
impact on the economies in LAC and elsewhere:
year-on-year growth in 2020Q2 was well below
previous quarters (Figure 19) and the variation in
growth rates among countries has increased
notably. In this section, we formally analyze the
factors behind the sharp slowdown in growth,
trying to disentangle the role of policies from
“purely” behavioral responses. We address the Sources: IMF, World Economic Outlook database; and IMF staff calculations.
issue using two different approaches.
First, we look at a cross-section of countries globally and, controlling for a number of factors—including
deaths per million (aimed at capturing behavioral reactions to the pandemics) and stringency (de jure
impediments to mobility)— investigate the determinants of GDP growth during the second quarter of
2020. This initial approach using quarterly data does not explore the time dimension and hence cannot
answer questions like: does the grip of the de jure measures on the economy change over time? Or, what
happens to the economy when people start to get isolation fatigue or overcome the fear of the pandemic
due to the necessity to work? Additionally, questions such as “to what extent has the behavior of people
been influenced by what happens in other countries?” are hard to tackle with a restricted time dimension.
We will come back to these questions in the following section on mobility. 9
To complement the first, the second approach resorts to a panel dataset comprised of 17 Latin American
countries and monthly economic activity indices in lieu of GDP. This allows us to better understand the

_____________________________
9For example, it could well be that behavior was also influenced by what was happening in Spain or the United States. However,

as in the cross-section we try to explain differences in growth across countries, a variable like the number of deaths in Spain
would be the same for each country, and hence could not help explaining cross-country differences.

 International Monetary Fund | October 2020 9
REGIONAL ECONOMIC OUTLOOK: WESTERN HEMISPHERE

dynamics of the relationship of interest and how elasticities to the stringency of lockdowns and
behavioral factors vary over time (February to June).
In this second exercise, a fixed-effects estimator is applied, which means that all time-invariant factors are
absorbed by the country dummies (not reported). The advantage of this approach is twofold: (i) given
that the fixed effects act as a surrogate for the full set of country-specific variables, omitted variables bias
is much less of a concern and (ii) perceptions, beliefs about the future, fatigue, and other common trends
that might be hard to quantify 10 but are nevertheless relevant, can be captured by the time dimension.
Cross-Country Regressions
A simple way to embed “growth Table 1. Growth and Pandemics: Cross Section
fundamentals” in our cross-section analysis (Dependent variable is year-on-year growth of 2020Q2 GDP)
is to add average past growth rates
 Year-on-year GDP growth in 2020Q2
(2016Q1-2019Q4) to the set of control (a) (b) (c) (d) (e)
variables. This is arguably a good proxy for Past Growth 1.599*** 1.395*** 0.959** 0.611 0.583
 0.383 0.38 0.406 0.384 0.398
a myriad of factors ranging from countries’ Stringency -0.179*** -0.157*** -0.145*** -0.125*** -0.120**
human capital to the quality of their -0.048 -0.047 -0.046 -0.043 -0.046

institutional frameworks and ease of doing GDP per capita 0.00001 0.00003 -0.0001 -0.0001* -0.0001*
 0.00004 0.00004 -0.00005 -0.00004 -0.00004
business, all of which might help mitigate New Deaths -0.829** -3.686*** -4.788*** -4.615
 ***

the adverse impact of the pandemics. -0.364 -1.228 -1.163 -1.291

Controlling for the set of variables in the
 **
 New Deaths*GDP per capita 0.0001 0.0001*** 0.0001
 ***

 0.00003 0.00003 0.00003
table, 11 we are able to explain more than Stringency*Tourism -0.003
 **
 -0.003**
half of the variation in 2020Q2 year over -0.001 -0.001
 LAC -0.775
year growth rates, even with a relatively -2.415
short sample of countries. 12 Most variables Constant -3.7 -4.192 -1.001 1.354 1.155
and interactions are highly significant and -4.05 -3.91 -3.968 3.695 3.779
 Observations 59 59 59 58 58
have the expected signs. 13 R
 2
 0.353 0.41 0.469 0.566 0.567
 2
 Adjusted R 0.318 0.366 0.419 0.515 0.506
Estimated elasticities are high: a tightening N * ** ***

of the Oxford stringency index from 50 to Source: IMF staff calculations.
 Note: Includes all countries for which quarterly GDP data are available in the World
100 would in itself be expected to cause a Economic Outlook database. *p < 0.1; **p < 0.05; ***p < 0.01.
drop of 6 percentage points in GDP
growth. 14 An increase in the daily death toll from 2 to 5 per million reduces year-on-growth by almost
2.5 percentage points according to column (b). 15

_____________________________
10As discussed before, it is likely that behavior may have been influenced by other factors than the death toll. Since this would in

principle affect all countries, the time interactions should be able to isolate these type of effects
11We experimented with other variables such as trade/GDP, the share of self-employed and population structure, but none

proved to be statistically significant.
12Quarterly GDP data are available for a small group of economies only.
13An important difference between our analysis and that in WEO chapter 2 is that our explained variable is actual GDP growth

in the second quarter, whereas in WEO the object of analysis is forecast errors for the first quarter. Reassuringly, both empirical
analyses arrive at very similar results.
14The Oxford Stringency Index is calculated from ordinal scores on 7 indicators: school closings, workplace closings, canceling

of public events, closing of public transport, public info campaigns, restrictions on internal movement and international travel
controls. Each indicator is rescaled to a maximum of 100; and the average of all indicators then yields the stringency index. A
required closing of schools, targeted closings of workplaces, required cancelling of all public events, and a ban on international
travel from high-risk regions would raise the index by 52 points.
15Of course, disentangling the behavioral effect (proxied by quarterly deaths/million and its interactions) from the policy effect is

not easy, as policy is not exogenous to how the epidemics evolves. But the fact that both variables are significant at 1 percent
suggests that they are not capturing the same thing.

10 International Monetary Fund | October 2020
COVID-19 IN LATIN AMERICA AND THE CARIBBEAN

Interestingly, as columns (c)-(e) show, the impact of deaths on activity varies according to the country’s
GDP per capita. In poorer countries, the impact of an increase in deaths on activity is more pronounced
than in richer economies (the interaction coefficient is positive, so the richer a country the less the
negative impact of deaths, ceteris paribus). This result is robust to using a different indicator of
development such as human development index.
Finally, the dummy for LA6 countries in this sample is not significant. This suggests that the large drop in
GDP in the region is not an idiosyncratic, region-related phenomenon. 16
LAC Panel Regressions
In this section we report the results from the Table 2. Growth and Pandemics: Panel
second exercise that now incorporates a time (Dependent variable is year-on-year growth rate of monthly activity in
 first six months of 2020)
dimension. The specification in the fixed-
 Year-on-year growth rate of
effects regression is similar to the previous one, monthly activity
but the inclusion of country dummies and time (1) (2) (3) (4)
interactions give some reassurance our
coefficients are not inflated by omitted variable Stringency -0.264
 ***
 -0.231
 ***
 -0.348
 ***
 -0.336
 ***

biases. The model now explains around -0.026 -0.032 -0.057 -0.065
80 percent of the variation in monthly real New Deaths *** ***
 -18.881 -16.586 -16.884
 ***

activity growth rates in the region and the -4.5 -4.349 -4.46
results suggest that both policy (stringency) and New Deaths*T 3.291 *** 2.791
 ***
 2.835 ***
behavioral (deaths) factors had significant 0.752 0.739 0.755
 ** **
impacts on economic growth. Stringency*T 0.023 0.023
 0.009 0.01
Importantly, though, the death-toll and the Stringency*Tourism -0.001
stringency index’s effect on growth appear to -0.002
diminish with time, particularly in the case of Observations 61 57 57 57
the former. Using the point estimates in R2 0.701 0.779 0.809 0.809
column (4), we see that by June this proxy for Adjusted R2 0.592 0.674 0.710 0.704
the behavioral effect becomes indistinguishable Source: IMF staff calculations.
 Note: Includes data for 17 countries in the region. *p < 0.1; **p < 0.05; ***p < 0.01.
from zero: -2.8*(T=6) - 16.9 = -0.1.
The impact of stringency diminishes more slowly: its impacts in April (T=4), May(T=5) and June(T=6)
are, respectively: -0.25, -0.22, -0.20. These are again high elasticities. Moving from a stringency index of
50 to a very restrictive 100 would cause a growth decline of approximately 10 percent.

_____________________________
16In econometrics jargon, the average residual for the region (again, represented by the LA6 economies) is very close to zero.

 International Monetary Fund | October 2020 11
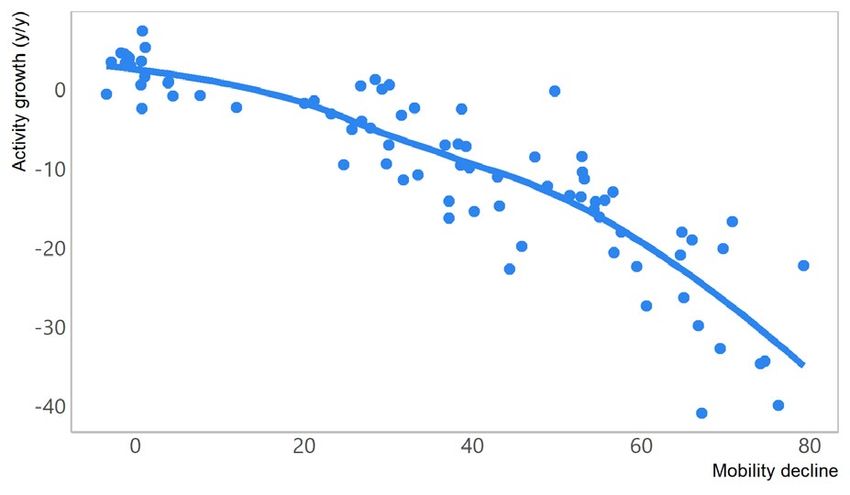
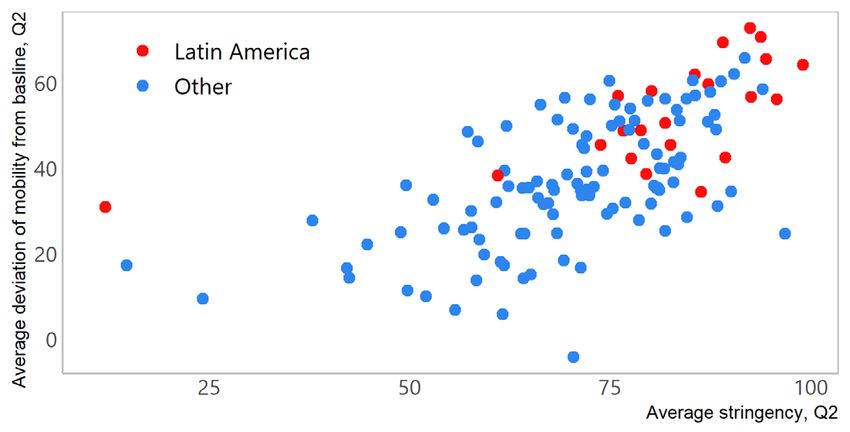
REGIONAL ECONOMIC OUTLOOK: WESTERN HEMISPHERE

What Explains the Sharp Drop in Mobility in Latin America—Policies or Behavior?
One drawback of using economic activity
 Figure 20. Latin American Countries: Mobility and
indicators is that they are available at a low
 Growth in First Half of 2020
frequency only, and with significant delays. (Data points are values for individual countries in individual months)
For many Latin American countries, they are
only available at a monthly frequency, and only up
until June. Moreover, sub-national data are
available only with much longer delays.
An alternative for using economic activity
data is using mobility data. These are
available at a daily frequency, with only a few
weeks delay; they exist for subnational levels;
and they are a good proxy for economic activity.
Figure 20 shows that in the first half of 2020,
there was a close link between the decline in Source: Google COVID-19 hub; Haver Analytics; and IMF staff calculations.
mobility and the decline in economic activity.
It is difficult to disentangle whether the sharp decline in mobility in Latin America was the result
of the lockdown or of behavior change. Did mobility drop because people were ordered to stay at
home, or because they opted to stay home, as they were afraid to get infected? Our findings suggest that
both factors mattered, a finding that is consistent with global cross-country findings (October 2020 WEO,
chapter 2). We also show that the impact of both variables seems to have weakened over time, suggesting
that populations experienced some degree of “fatigue” towards policies and pandemic developments or
because the economic necessity forced Figure 21. Stringency and Mobility Decline, 2020Q2
the people to overcome their fear of
infections.
In countries with stricter
lockdowns, mobility declined more
(Figure 21). However, that does not
necessarily mean that the sharp
mobility declines were the result of the
lockdowns. It could well be that the
same fear that led countries to impose
strict lockdowns, also resulted in a
sharp decline in mobility that would Sources: Google COVID-19 hub; and IMF staff calculations.
have occurred even in the absence of Note: Chart shows average deviation of mobility in the second quarter from baseline days.
lockdowns. Baseline days represent a normal value for that day of the week, given as median value over the
 five-week period from January 3rd to February 6th, 2020.

12 International Monetary Fund | October 2020
COVID-19 IN LATIN AMERICA AND THE CARIBBEAN

Regression analysis of cross-country differences cannot settle this issue either. The death toll was
very low when Latin America locked down, but fear must have been high—otherwise countries would
not have locked down. 17 Moreover, it is likely that the link between the daily death toll and mobility
changed over time. In many Latin American countries, mobility picked up over time, even as daily deaths
increased and stringency did not change much, suggesting that fear diminished, or people had to overcome
their fear due to the necessity to work to provide for their living.
Regression analysis of mobility differences within countries can shed some light on the
importance of the behavior factor. To mitigate endogeneity concerns, we perform the analysis on the
data from three countries that introduced nation-wide lockdowns early on in the pandemic when the new
cases and deaths were still low, namely, Peru, Argentina and Chile. We compare weekly mobility of
regions within these countries over time and assume that the stringency index for each region was the
same as the nation-wide stringency index. 18 We are particularly interested in two questions. First, has
mobility been lower in regions with higher daily deaths? Second, why did mobility pick up even though
daily deaths tolls continued rising? Has the impact of stringency on mobility declined over time, or has
the strength of the behavioral component diminished? We test this through the interaction of a time
index with the stringency index and the interaction of a time index with the daily death toll. In all
regressions, we use region fixed-effects, so all possible omitted variables that are not time-varying are
accounted for and do not have a bearing on the estimated coefficients.
 Table 3. Weekly Mobility in Regions in Countries

 Peru Argentina Chile
 Model 1 Model 2 Model 3 Model 4 Model 1 Model 2 Model 3 Model 4 Model 1 Model 2 Model 3 Model 4

 *** *** *** *** * *** *** *** *** *** *** ***
 New_deaths (lag)
 New Deaths (lag) -0.744 -3.058 -1.005 -0.529 -1.182 -24.557 -5.778 -2.965 -1.669 -5.303 -4.576 -1.925
 -0.164 -0.398 -0.138 -0.134 -0.661 -3.045 -1.689 -0.953 -0.296 -1.257 -0.561 -0.418

 *** ***
 0.019*
 *** *** *** *** **
 New Deaths (lag)
 New_deaths (lag) **TT 0.189 0.086 1.246 0.367 0.049 0.240 0.309 0.063
 -0.03 -0.01 -0.011 -0.159 -0.087 -0.05 -0.081 -0.036 -0.028

 *** *** ***
 -0.857***
 *** ***
 Stringency -0.838 -0.878 -0.703 -0.649 -0.832
 -0.012 -0.012 -0.018 -0.011 -0.016 -0.015

 *** *** ***
 Stringency * T 0.007 0.018 0.015
 -0.001 -0.001 -0.001

 Observations 645 645 645 645 608 608 608 608 425 425 425 425
 2
 R 0.032 0.091 0.896 0.913 0.005 0.101 0.747 0.92 0.073 0.092 0.82 0.91
 2
 Adjusted R -0.008 0.052 0.891 0.908 -0.037 0.061 0.735 0.916 0.034 0.052 0.812 0.906

 Source: IMF staff calculations.
 Note: *p < 0.1; **p < 0.05; ***p < 0.01.

The results suggest that the behavioral component mattered, but its impact declined over time.
Regions with higher daily deaths per million had lower mobility (column 1). 19 The coefficient on the
interaction of a time index with daily deaths (column 2) is positive, which implies that the impact of new
deaths on mobility declined over time. 20 This conclusion does not change when we add stringency to the
equation—a variable that in itself is highly significant (column 3). The impact of stringency also declined

_____________________________
17We tried adding other variables to capture fear, such as the daily death toll in the US and Spain, and combinations of them, but

they had little explanatory power.
18For Latin American countries, the stringency index is only available at the national level. The October 2020 WEO followed a

similar approach.
19New_deaths (lag) = previous week’s average daily deaths per million. T is a time index for the week.
20For Peru, the impact of new deaths on mobility is (-3.058+0.189 * week_index)* Deaths_per_1M_lagged. Over time, the

impact become less pronounced.

 International Monetary Fund | October 2020 13
REGIONAL ECONOMIC OUTLOOK: WESTERN HEMISPHERE

over time. The coefficient of the interaction of a time index with stringency is positive and highly
significant (column 4). 21
In summary, both the lockdowns and the behavioral component had an impact on mobility, but
their importance seem to have diminished over time. The diminishing effects of the lockdowns and
of the behavioral component on mobility may both reflect the necessity of the low income households to
engage in economic activity. The result was that that for any given level of stringency or daily deaths,
people were less likely to remain at home. Hence, over time, lockdowns became less effective in
containing mobility.

Reopenings
LAC countries have been gradually easing their lockdown restrictions, but they remain elevated
in most of the region (Figure 22). Stringency indicators in South America, Mexico, and Central America,
have remained elevated given the difficulties in containing the pandemic. Strikingly, for the last five
months, stay-at-home requirements in the LA6 have been as stringent as they were in France in April and
May. The only region where stringency indicators have come down sharply is the Caribbean, where in
many islands the epidemic has been subdued.
The easing of lockdown restrictions and economic reopening have been associated with a pick-
up in mobility and economic activity (Figure 23). For example, in Brazil, in mid-August, the
stringency index was 17 points lower than at the peak, the deviation of mobility from the baseline in mid-
August was 35 percentage points less than at the peak. This pattern is similar across other LAC countries
and worldwide. In line with the mobility-activity link identified in the previous section, economic activity
has recovered along with the pick-up in mobility. For instance, for a sample of 17 LAC countries, average
mobility recovered from -60 percent (year-over-year) in April to -44 percent (year-over-year) in June,
while the average economic contraction eased from -20 percent to -10 percent (year-over-year).

 Figure 22. Stringency in Latin American Regions Figure 23. The Decline in Stringency and Increase in
 Mobility

 Sources: Google COVID-19 hub; and IMF staff calculations. Sources: Google COVID-19 hub; and IMF staff calculations.
 Note: Unweighted average by region.

_____________________________
21We also investigated whether the “fear” component would perhaps be better captured by other variables such as daily deaths in
Spain or in the United States—two countries that are closely followed in Latin America. However, while they were often
statistically significant, they did not add much explanatory power.

14 International Monetary Fund | October 2020
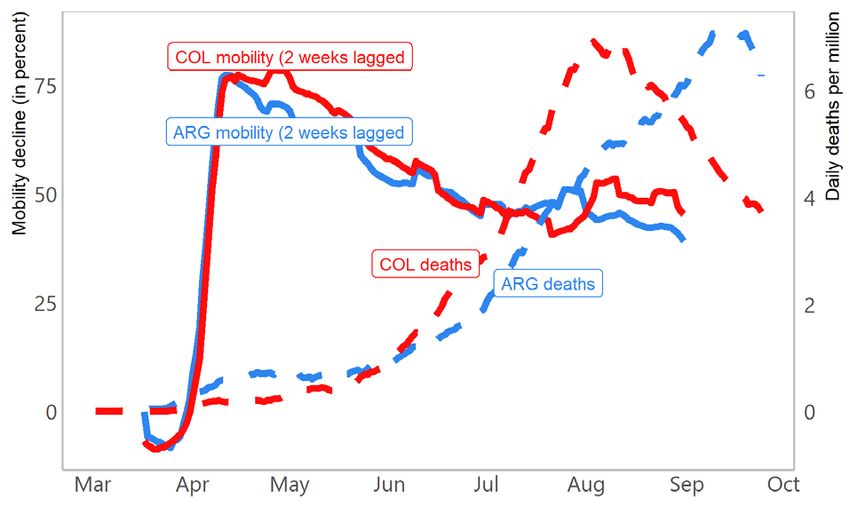
COVID-19 IN LATIN AMERICA AND THE CARIBBEAN

However, the flipside of the reopening Figure 24. Argentina and Colombia: Mobility and Daily
process has been a pick-up in new Deaths
COVID-19 deaths, which highlights the
still difficult trade-offs faced by
policymakers. The rebound in mobility may
help explain why some countries that had
initially been less affected, subsequently saw a
surge. This was, for example, the case in
Argentina and Colombia (Figure 24), as well as
in Paraguay, Costa Rica, and Suriname. While
this problem has not been exclusive to LAC—
e.g., countries such as the U.S., and Indonesia
(which recently reimposed lockdown
restrictions) have also seen resurgences after a
 Sources: Google Mobility; Johns Hopkins University; and IMF staff calculations.
period of easing. This would also be in line
with the findings of the October 2020 Regional Economic Outlook: Europe, which suggests that reopening
measures in Europe led to a recovery in mobility but at the cost of some uptick in infections. The LAC
region may have been particularly vulnerable to it given that its containment strategy relied primarily on
stringency and was weak in terms of testing (Figure 25). These limitations in terms of testing and tracing
also make the region vulnerable to second waves of the pandemic.
 Figure 25. Containment Measures and Testing Capacity
 1. Containment Stringency 2. Tests over 100,000 People
 (Index) (May and September 2020)
 120 30,000
 Latest Early April May 1, 2020 September 1, 2020
 100 25,000

 80 20,000

 60 15,000

 40 10,000

 20
 5,000

 0
 0
 ECU
 ARG

 ESP

 COL
 PER

 BRA

 URY
 MEX
 CRI
 CHL

 SLV
 USA

 ITA
 JAM

 KOR

 NIC

 LAC EUR USA LAC EUR USA

 Source: Hale, Thomas, Sam Webster, Anna Petherick, Toby Phillips, and Beatriz Kira (2020). Oxford COVID-19 Government Response Tracker, Blavatnik
 School of Government; Our World in Data database; and IMF staff calculations.

Conclusion
The early and stringent lockdowns in LAC were initially successful in that they helped reduce mobility
sharply and prevent the rapid explosion of infections at the onset, which would have overwhelmed weak
medical capacity in the region.
However, the lockdowns were not fully effective in containing the spread of the pandemic and the total
death toll. The lockdowns only slowed the pandemic but did not stop it and over time the effectiveness
of lockdowns declined as mobility started to pick up when new cases and deaths were still on the rise.
This resulted in a “slow burn” death pattern, which in some cases led to a total death toll that by now
exceeds that in countries that experienced a rapid explosion of daily deaths (e.g., Spain, Italy)
Structural factors, not fully effective government policies as well as “lockdown fatigue”, likely due to the
necessity of low-income households to engage in economic activity have likely contributed to the

 International Monetary Fund | October 2020 15
REGIONAL ECONOMIC OUTLOOK: WESTERN HEMISPHERE

ineffectiveness (or partial effectiveness) of the lockdowns and to a very high death toll in the region. A
high degree of informality, high poverty and living conditions in some densely populated urban areas as
well as weak capacity of the health systems, low government effectiveness more generally and the inability
to ramp up testing and tracing capacity, in particular, while in some cases the lack of fiscal resources have
likely contributed to the continued stream of new infections and a resulting very high death toll in LAC.
The significant economic impact of the COVID-19 pandemic in LAC is a result of the government
policies (lockdowns) as well as the behavioral response though the impact of both factors has diminished
over time. It is difficult to say from empirical analysis, which factor contributed more.
LAC remains vulnerable to a resurgence in infections if reopening happens too quickly. The structural
factors remain intact and government policy weaknesses persist, including the fact that some LAC
policymakers have not utilized the time of the lockdowns efficiently to prepare for a safe reopening. For
example, testing capacity remains weak in several countries, suggesting that the strategies of testing and
tracing needed to contain the spread of the virus are still weaker than in other regions.

16 International Monetary Fund | October 2020
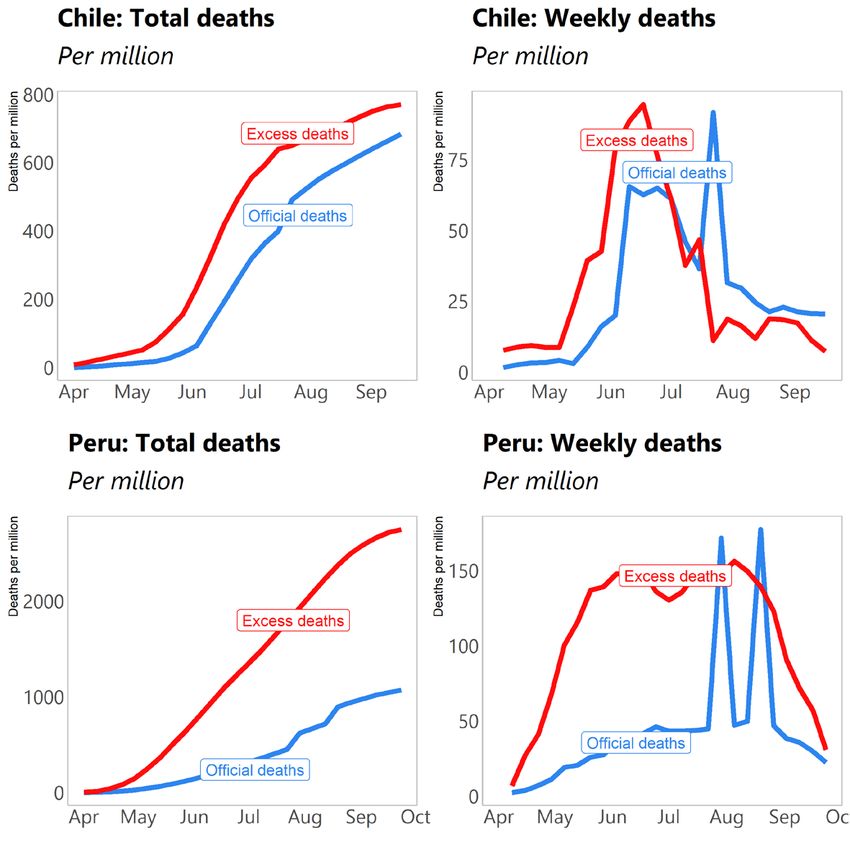
COVID-19 IN LATIN AMERICA AND THE CARIBBEAN

Box 1. Lack of COVID-19 Testing, Underestimation of Cases and Excess Deaths
Lack of testing
The number of COVID-19 cases and of Box Figure 1.1. Testing Capacity
COVID-19 deaths may be significantly (New infection cases as share of new tests, 7-day m.a.)
underestimated in Latin American countries, Emerging and Dev. Asia European Union
which may have implications for the assessment 100
 LAC Middle East and N. Africa
 United States
of the impact of the pandemic. This
underestimation is likely related to the limited
testing capacity, which in LAC has been well
below other regions. The lack of testing is 50
evident in the positive cases to tests ratio. When
there is limited testing, only sick people get
tested, and the ratio of positive cases to tests is
 0
high. In the U.S., in Asian, MENA, and
European countries, the ratio of the number of
positive cases to the number of tests performed
is below 20 percent. In LAC, on the other hand, Sources: Our World in Data database; and IMF staff calculations.
this ratio hovers between 50 and 100 percent.
Low testing seems to have been especially an issue in Mexico, Peru, Ecuador, Argentina, and Bolivia, while
only Chile appears to have achieved an appropriate testing capacity. (Box Figure 1.1)
Underestimation of deaths
The lack of testing capacity may also lead to an underestimation in the number of deaths. In Peru, the number
of “excess” deaths—i.e., the number of deaths in the current year in excess of the average of the previous few
years—has been almost 3 times the number of the official deaths (Box Figure 1.2). The problem is not
uniform: in Chile, excess deaths are close to the official figure.
Available data from the Box Table 1.1. COVID-19 Excess Deaths
Economist suggest that in Mexico, (Per million)
Peru and Ecuador, there has been
a significant undercounting of Country Dates Excess Covid Difference
COVID-19 deaths. In Mexico, deaths Deaths
excess deaths as of end July were
almost 3 times as high as the Brazil Mar 21st-Aug 14th 500 514 -14
official number of COVID-19 Mexico Mar 28th-Jul 31st 1,000 369 631
deaths. For Brazil and Chile, by Peru Mar 31st-Aug 30th 2,110 882 1,228
contrast, the number of excess Chile Apr 7th-Sep 14th 620 678 -58
deaths is close to the official Ecuador Feb 29th-Aug 30th 1,830 381 1,449
COVID-19 death count.
 Sources: Economist, COVID-19 Excess Deaths Tracker; and IMF staff calculations.
The combination of
underestimated cases and deaths
points towards an even more significant health impact of the pandemic in Latin America than the official
figures would suggest.

 This box was prepared by Bas Bakker and Mauricio Vargas.

 International Monetary Fund | October 2020 17
REGIONAL ECONOMIC OUTLOOK: WESTERN HEMISPHERE

 Box 1 (continued)
 Box Figure 1.2. Excess Deaths versus Official COVID-19 Deaths

 Sources: IMF staff calculations.

18 International Monetary Fund | October 2020
COVID-19 IN LATIN AMERICA AND THE CARIBBEAN

Box 2. On the Effectiveness of Containment Measures in Controlling the COVID-19 Pandemic: The Role
of Informality and Government Effectiveness
The local projection method is used to study the effectiveness of containment measures in slowing the spread of
the disease, as in David and Pienknagura (forthcoming). The typical state-dependent specification takes the
following form:
 ℎ ℎ ℎ ℎ
 , +ℎ − , −1 = (1 − ( , −1 )) � ℎ ℎ, + ℎ ℎ p + ℎ ℎ , � + ( , −1 ) � , + p + , �
 + , +ℎ .
with ( , −1 ) being a smooth function of the state
variable (high/low informality or high/low Box Figure 2.1. The Effect of Containment Policies on
 Total Cases
government effectiveness). denotes the natural
 1. The Role of Informality
logarithm of total cases; p is an index capturing the
 (Percentage difference relative to baseline)
stringency of containment policies at time t country i;
and ℎ denotes the time horizons considered.
denotes a set of control variables, including lagged
value of the stringency index, the evolution of cases
(the growth of cases in the days preceding the
implementation of containment policies), weather
variables, and country-specific time trends (linear,
squared and cubic) which capture the evolution of the
virus. The specification also includes country ( ℎ )
fixed effects to capture time-invariant country
characteristics.
Estimation results show starkly the difficulty of
containing the virus in high-informality settings (Box
 2. The Role of Government Effectiveness
Figure 2.1, panel 1). Countries with low informality see (Percentage difference relative to baseline)
a gradual decline in total cases to about 70 percent of
the baseline after 30 days of increasing containment.
By contrast, countries where informality prevails
experience no reduction in total cases relative to
baseline levels.
Low government effectiveness is also associated with
lower effectiveness of containment policies. The
slowdown in the spread of the virus after
implementing stricter containment policies is more
pronounced in countries with higher government
effectiveness compared to those with low effectiveness
(cases remain 65 percent below baseline levels 30 days
after an increase in the stringency of containment Source: IMF staff calculations.
measures)—in the latter case the impact is not
statistically different than zero (Box Figure 2.1, panel 2).
These results highlight the challenges of “flattening the curve” of COVID-19 cases in countries with high
informality and low government effectiveness.

 This box was prepared by Antonio David and Samuel Pienknagura (WHDRS), and is based on David, A. and S. Pienknagura (forthcoming).

 International Monetary Fund | October 2020 19
REGIONAL ECONOMIC OUTLOOK: WESTERN HEMISPHERE

 Box 3. Differences in COVID-19 Related Deaths: The Role of “Fundamentals”
 The death toll of COVID-19 depends on the dynamics of the pandemic, which is driven by the timeliness and
 effectiveness of lockdowns, as well as structural factors. This box explores structural determinants of total deaths
 per capita in a cross-section of countries and of municipalities.
 Across countries
 In the cross-country regressions, we tested Box Table 3.1. Total Deaths per Million in Countries
 a multitude of variables proxying for
 agglomeration, health capacity, state 90 days after 100th case 150 days after 100th case
 capacity and linkages to the world. The Population over 70 14.8*** 15.7***
 best specification, which is depicted in the [2.93] [4.73]
 Box Table 3.1 and explains around BCG dummy -117*** -107***
 30 percent of the variation when a LAC [30.9] [47.6]
 Hospital beds per 10,000 -12.5*** -14.3**
 dummy is added. The non-significant [5.14] [7.10]
 variables were: (i) trade to GDP, Log( total population) 10.20* 20.05**
 (ii) geographic latitude, (iii) population [2.68] [8.90]
 LAC Dummies n.sig 153.2***
 density, (iv) percentage of urban Constant Y Y
 population, (v) number of cities with more R2 0.35 0.27
 than 1million inhabitants, (vi) total death # of countries 152 124
 # of countries in lac 22 17
 rate in 2018, (vii) diabetes prevalence in the
 population, (viii) government effectiveness Source: IMF staff calculations.
 Note: Population density at the country level is not significant.
 index (and corruption), (ix) social trust—a
 variable of the World Value Survey that measures the share of survey respondents agreeing with the statement
 “most people can be trusted.” Other variables, including GDP per capita and Human Development Index had the
 wrong sign, with higher GDP per capita and higher HDI associated with more deaths. Robustness checks dropping
 very small countries and LICs, do not alter our results significantly.
 The median in the region for hospital beds per 10 thousand people is 1.5 only. In Argentina, the number is 5.
 Having 5 beds per 10 thousand people instead of 1.5, makes a difference in total deaths of roughly 50 per million
 after 150 days Age structure matters as well. The regional median for the share of people over 70 years old is
 4.5 percent. In Uruguay, it is 10 percent. This difference would, ceteris paribus, amount to 85 more deaths per
 million people.
 Uruguay, however, has the lowest death toll in the region and this is not solely due to other variables offsetting age.
 In econometric parlance, the error term for the country is quite large (significantly fewer deaths than predicted).
 This hints that other (possibly non-observable) country-level variables are relevant.
 Therefore, we redo the exercise using municipal level data, which allows us to add country dummies to our
 specifications (eliminating the biases generated by omitted factors at the country level). In addition, we include
 population density, which may not be a good indicator of how densely together people actually live at the country
 level but nay better capture this aspect at the municipal level as well as geographic latitude, a variable that is hard to
 capture at the country level (e.g. an average of Chile or Brazil would not capture a significant variation across
 regions).

 This box was prepared by Carlos Goncalves.

20 International Monetary Fund | October 2020
COVID-19 IN LATIN AMERICA AND THE CARIBBEAN

Box 3 (continued)
Across municipalities
We perform a similar analysis using municipality- Box Table 3.2. Total Deaths per Million in Municipalities
level data available from Google. The advantages
 30-May 30-Aug
are: (i) a larger sample, (ii) possibility of Population over 70 17.90*** 80.28***
controlling for country-effects. Our sample is [1.62] [6.22]
comprised of more than 1,000 municipalities for Population density 0.02*** 0.04***
which the share of elderly, density, and total [0.003] [0.006]
 Geographical latitude 19.50*** 17.15**
population are available. From these, about
 [2.68] [7.76]
45 percent are from Latin America. Hospital Log( total population) 47.50*** 94.03***
beds per capita are not available at this level of [7.45] [21.57]
disaggregation and BCG vaccination is a Country Dummies Y Y
constant across cities in a given country. Constant Y Y
 R2 0.26 0.38
As Box Table 3.2 shows, both population density # of municipalities 1185 1150
and geographic latitude are statistically significant # of municipalities from LAC 533 521
now. Interestingly, the coefficient linking Source: IMF staff calculations.
population over 70 to deaths per million increase
significantly through time. Quantitatively, population density is very important. Cuajimalpa de Morelos, in
Mexico, has 2,322 inhabitants per km2, whereas the municipality of Sao Paulo, Brazil, has 7,940. This
difference alone accounts for 202 deaths per million.
Across states
Using state level data, we arrive at similar Box Table 3.3. Total Deaths per Million in States
results as those for municipalities, though the
 30-May 30-Aug
estimations are of lower overall quality. For
instance, population structure has the correct Population over 70 15.66 2.69
 [16.52] [2.20]
sign, but is not statistically significant (likely
 Population density 0.04 0.12**
because after controlling for country dummies, [0.03] [0.05]
age structure does not vary much across states). Geographical latitude 12.32*** 13.05***
(Box Table 3.3) [4.08] [5.32]
 Log (total population) 46.72** 42.90
 [21.97] [29.89]
 Country Dummies Y Y
 Constant Y Y
 R2 0.23 0.19
 # of states 225 215
 # of states from LAC 72 80
 Source: IMF staff calculations.

 International Monetary Fund | October 2020 21
REGIONAL ECONOMIC OUTLOOK: WESTERN HEMISPHERE

Annex 1. COVID-19 at the Country Level
 Annex Table 1.1. COVID-19: A Snapshot
 (Per million people)

 Country/Region Total Deaths Total Cases Daily new deaths Daily new cases Mobility Mobility
 (Oct-01) (Oct-01) (Sept 01-Oct 01) (Sept 01-Oct 01) (Sept 01-Oct 01) (March-July)

 Latin America 577 15,479 3.8 110 -26 -48
 South America and Mexico 638 16,757 4.2 119 -23 -50
 Central America 204 8,111 1.3 63 -32 -53
 The Caribbean 94 4,975 0.7 32 -28 -44
 USA 633 22,172 2.3 128 -29 -32
 European Union 389 6,768 0.8 91 -18 -31
 Peru 965 23,465 3.7 176 -41.0 -56.0
 Bolivia 662 11,350 3.4 48 -29.6 -54.0
 Brazil 649 21,533 3.6 145 -8.8 -43.0
 Chile 648 23,548 2.5 87 -35.3 -46.0
 Ecuador 638 7,276 1.5 64 -26.5 -22.0
 Mexico 576 5,469 3.0 33 -24.6 -34.0
 Panama 532 25,010 3.1 150 -46.2 -58.0
 Colombia 481 15,198 3.6 138 -25.4 -42.0
 Argentina 290 14,049 5.4 241 -22.4 -32.0
 Honduras 224 7,348 1.5 56 -33.9 -48.0
 Dominican Republic 191 10,084 1.1 62 -31.8 -42.0
 Guatemala 188 5,146 1.4 30 -31.5 -42.0
 Suriname 177 8,314 0.7 24 na na
 Costa Rica 140 12,622 3.3 234 -31.2 -41.0
 El Salvador 126 4,269 0.6 14 -33.2 -35.0
 Paraguay 94 4,758 2.7 116 -12.9 -52.0
 Belize 54 4,168 0.7 54 NA -18.0
 Trinidad and Tobago 47 2,796 1.2 88 -29.4 -35.0
 Antigua and Barbuda 31 988 0.0 1 -31.0 -32.0
 Barbados 24 658 0.0 4 -25.1 -40.0
 Jamaica 23 1,692 1.2 59 -28.1 -42.0
 Nicaragua 22 758 0.1 3 -17.6 -21.0
 Haiti 20 765 0.0 2 -21.3 -26.0
 Uruguay 13 554 0.0 4 -5.9 -25.0

 Sources: Johns Hopkins University; Google Mobility Report; and IMF staff calculations.

22 International Monetary Fund | October 2020
COVID-19 IN LATIN AMERICA AND THE CARIBBEAN

References
Banik, Arindam, Tirthankar Nag, Sahana Roy Chowdhury, and Rajashri Chatterjee. 2020. “Why Do
 COVID-19 Fatality Rates Differ Across Countries? An Explorative Cross-country Study Based
 on Select Indicators.” Global Business Review 21(3) 607–625. Available at
 https://journals.sagepub.com/doi/10.1177/0972150920929897

David, A., and S. Pienknagura “On the effectiveness of containment measures in controlling the
 COVID-19 pandemic: The role of labor market characteristics and governance,” Applied
 Economic Letters. (Forthcoming).

Deb, Pragyan, Davide Furceri, Johnathan David Ostry, and Nour Tawk. 2020. “The Effect of
 Containment Measures on the COVID-19 Pandemic.” IMF Working Paper 20/159,
 International Monetary Fund, Washington, DC.

Delamater, P.L., E.J. Street, T.F. Leslie, Y. Yang, and K.H. Jacobsen. 2019. “Complexity of the Basic
 Reproduction Number (R0).” Emerging Infectious Diseases 25(1):1–4.

Hale, Thomas, San Webster, Anna Petherick, Toby Phillips, and Beatriz Kira. 2020. “Variation in
 Government Responses to COVID-19.” BSG Working Paper Series, BSG-WP-2020/031,
 Oxford, March.

International Monetary Fund. (IMF). 2020. “Dissecting the Economic Impact.” Chapter 2 of the World
 Economic Outlook, Washington, DC, October.

_______, “Europe’s Exit from Lockdowns: Early Lessons.” Chapter 2 of Regional Economic Outlook:
 Europe, Washington, DC, October.

 International Monetary Fund | October 2020 23
You can also read