Uncovering isolated resonant responses in antagonistic pure-shear dielectric elastomer actuators
←
→
Page content transcription
If your browser does not render page correctly, please read the page content below
Cao et al. Soft Sci 2021;1:1
DOI: 10.20517/ss.2021.01
                                                                                                                      Soft Science

Research Article                                                                                                               Open Access

Uncovering isolated resonant responses in
antagonistic pure-shear dielectric elastomer
actuators
Chongjing Cao1,2, Thomas L. Hill3, Bo Li4, Guimin Chen4, Lei Wang1,2, Xing Gao1,2
1
 Research Centre for Medical Robotics and Minimally Invasive Surgical Devices, Shenzhen Institutes of Advanced Technology
(SIAT), Chinese Academy of Sciences, Shenzhen 518055, Guangdong, China.
2
  CAS Key Laboratory of Health Informatics, Chinese Academy of Sciences, Shenzhen 518055, Guangdong, China.
3
  Department of Mechanical Engineering, University of Bristol, Bristol BS8 1TR, UK.
4
  Shaanxi Key Lab of Intelligent Robots, School of Mechanical Engineering, Xi’an Jiaotong University, Xi’an 710049, Shaanxi,
China.

Correspondence to: Dr. Xing Gao, Shenzhen Institutes of Advanced Technology (SIAT), Chinese Academy of Sciences, 1068
Xueyuan Road Nanshan District, Shenzhen 518055, Guangdong, China.
E-mail: xing.gao@siat.ac.cn; hustergaoxing@hotmail.com

How to cite this article: Cao C, Hill TL, Li B, Chen G, Wang L, Gao X. Uncovering isolated resonant responses in antagonistic
pure-shear dielectric elastomer actuators. Soft Sci 2021;1:1. http://dx.doi.org/10.20517/ss.2021.01

Received: 31 Mar 2021 First Decision: 30 Apr 2021 Revised: 2 May 2021 Accepted: 21 May 2021 First online: 21 May 2021

Academic Editor: Zhifeng Ren Copy Editor: Yue-Yue Zhang Production Editor: Yue-Yue Zhang

Abstract
The dielectric elastomer actuator (DEA) is one type of emerging soft actuator that has the attractive features of
large actuation strains, high energy density, and inherent compliance, which is desirable for novel bio-inspired and
soft robotic applications. Due to their inherent elasticity, when stimulated by an alternating current voltage with
a frequency matching the natural frequency of the DEA system, the DEAs can exhibit resonant responses which
maximize the oscillation amplitude. Silicone elastomers are widely utilized for resonant actuation applications
for their reduced viscous damping hence better dynamic performance compared to VHB elastomers. However,
the low pre-stretch ratios adopted by silicone elastomers could induce loss-of-tension of the mem-branes in
high amplitude oscillations, yet its effects on the dynamic responses of a DEA are not fully understood. By using
a numerical dynamic model, this work studies the effects of the loss-of-tension on the frequency response of
the antagonistic pure-shear DEAs. A subharmonic frequency response curve isolated from the main response
branch is uncovered for the first time in a parametrically forced DEA system, which causes a sudden jump in the
oscillation amplitude and serves as a severe threat to the dynamic stability and controllability of the DEA system.
By using a global analysis method, the evolution of the isolated response curve against the excitation components
and system physical parameters is also investigated numerically.

                       © The Author(s) 2021. Open Access This article is licensed under a Creative Commons Attribution 4.0
                       International License (https://creativecommons.org/licenses/by/4.0/), which permits unrestricted use,
    sharing, adaptation, distribution and reproduction in any medium or format, for any purpose, even commercially, as long
    as you give appropriate credit to the original author(s) and the source, provide a link to the Creative Commons license,
    and indicate if changes were made.

                                                                                                                       www.softscijournal.com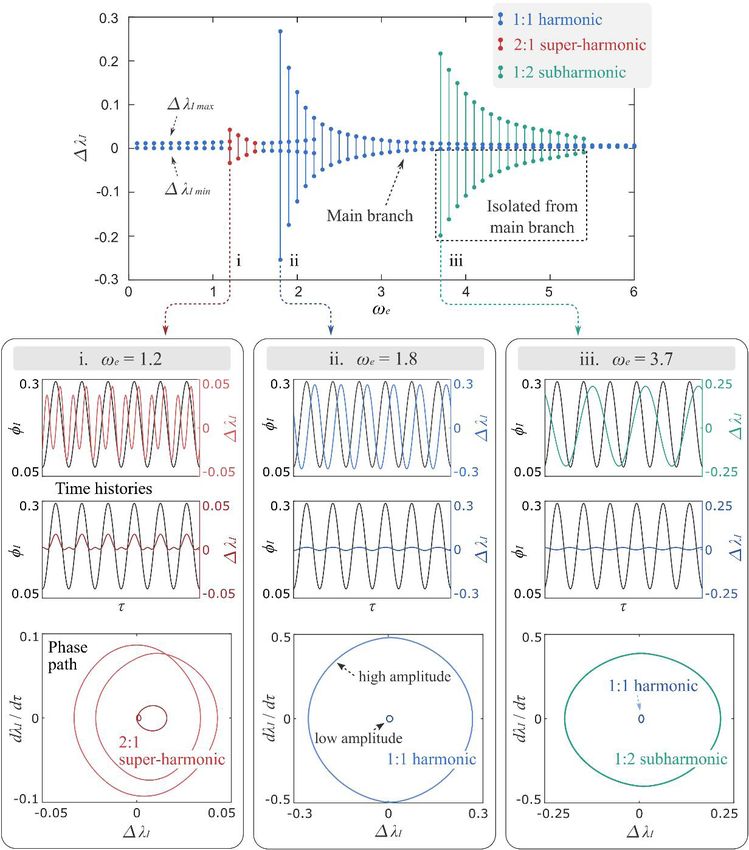
Page 2                                                 Cao et al. Soft Sci 2021;1:1 I http://dx.doi.org/10.20517/ss.2021.01

Keywords: Dielectric elastomer actuators, pure-shear configuration, nonlinear dynamics, isolated response curve,
soft oscillator

INTRODUCTION
Dielectric elastomer actuators (DEAs) are an emerging type of soft actuator that possess several advantages
over conventional actuators in terms of large actuation strain, high theoretical efficiency, inherent
compliance, and low cost[1,2]. An idealized DEA consists of two pieces of compliant electrodes with one
layer of dielectric elastomer in between. When a voltage is applied across the electrodes, opposing charges
are accumulated on the two sides of the membrane, which cause it to contract in thickness and expand in
area. Many configurations of DEAs have been proposed; for instance, stacked DEAs[3], conical DEAs[4,5],
rolled DEAs[6,7], and the dielectric elastomer minimum energy structures[8,9]. Many robotic applications
based on DEAs have been developed in soft robotic locomotion[10-16], fluidic pumps[17,18], and grippers[19,20].

Pure-shear DEAs represent one class of planar and linear DE actuation system that utilizes the active
area expansion of the membrane in one planar direction as the output. Such a design has a compact
configuration which is desirable for many applications in robotics such as a flexible morphing wing[21], a
vibration shaker[22], and a fishlike airship[23]. In order to maintain the tension on the membrane, one end
of it is usually fixed while the opposing end is typically attached to a biasing mass [24-26] or an equivalent
force[27], a spring[28-30], an antagonistic pure-shear DEA[31,32], or a bistable mechanism[33,34].

Large actuation strains of the DEAs can reduce the system complexity and robot size (i.e., no strain
amplification mechanism required) and also increase the range of motion of the robot designs. Hence,
several works have focused on optimizing the quasi-static linear actuation strains of the pure-shear DEAs.
Lu et al.[35] utilized the anisotropic pre-stretch and stiff fiber constraints to achieve an output strain up to
142%. By using the same anisotropic pre-stretch principle and adding an optimal mass to the membrane, a
maximum actuation strain over 500% was documented by Goh et al.[26].

Due to the inherent elasticity, when stimulated by an alternating current (AC) voltage signal, the DEAs can
generate oscillatory motions. As the excitation frequency approaches the natural frequency of the DEA
system, it can exhibit a dramatic increase in its oscillation amplitude. This soft oscillation technology can
have advantages over other conventional rigid mechanical oscillators in terms of inherent compliance,
which can be readily integrated with soft robotic systems to allow active vibration control and dynamic
robotic locomotion[36]. As a result, more works have been concerned with the nonlinear dynamics of the
pure-shear DEAs.

For example, Li et al.[37] have extensively investigated the nonlinear dynamics of pure-shear DEAs with
specific focus on the effects of biasing elements, membrane strain-stiffing [29], and the viscosity-induced
drifting[38]. Zhang et al.[27,39] studied the effects of dissipating factors of a pure-shear DEA (viscous damping
and leakage current) on its dynamic responses. By using an antagonistic pure-shear DEA configuration,
Zhang et al.[40] also investigated the loss-of-tension due to the large deformation of the membranes during
vibrations and demonstrated that the loss-of-tension can be eliminated by increasing the pre-stretch ratio.

However, although loss-of-tension in pure-shear DEAs has been demonstrated, no work has looked at
the effects of loss-of-tension on the frequency responses of such actuators. For silicone elastomers, which
usually adopt low pre-stretch ratios (typically between 1-2; e.g., 1.0 in[14], 1.02 in[15], or 1.2 in[19]) and exhibit
low viscous damping[18,41,42], loss-of-tension could be expected in high-amplitude vibrations, particularly
near the resonance of the system where amplitude can be dramatically increased. Hence in this work, by
adopting the antagonistic pure-shear DEA configuration, we use a numerical model to analyze the effects
Cao et al. Soft Sci 2021;1:1 I http://dx.doi.org/10.20517/ss.2021.01 Page 3
of the loss-of-tension mechanism on the nonlinear dynamic response of the DEA under low pre-stretch
conditions. From this, we uncover the resonant responses that are detached from the main response branch
- these isolated resonant responses cannot be detected by conventional continuation methods but, once
triggered, they will cause a sudden change in the oscillation amplitude and response phase, which serves as
a real threat to the dynamic stability and controllability of such DEA systems; hence they demand careful
and dedicated investigation.
The rest of this paper is structured as follows. In section DYNAMIC MODELLING, the DEA structure is
introduced and the governing dynamic equations are developed. In section RESULTS AND DISCUSSION,
the nonlinear dynamics and resonances due to loss-of-tension are investigated in the subsection Nonlinear
dynamic response. A parametric study is then conducted in the subsection Parametric study which studies
the effects of the forcing parameters and physical system parameters on the frequency responses. Finally,
conclusions are drawn in section CONCLUSION.
DYNAMIC MODELLING
System overview and actuation principle
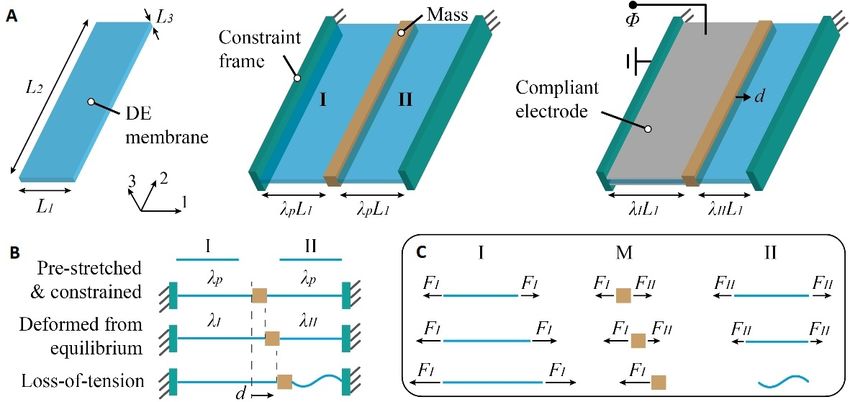
The basic structure of the antagonistic pure-shear DEA is shown in Figure 1A. The undeformed DE
membrane has the dimensions of L1, L2, and L3 in direction 1, 2, and 3, respectively. Two identical DE
membranes, I and II, are pre-stretched along direction 1 by λ p and then bonded to the constraint frames.
One mass, M, is attached to one end of each membrane and is constrained to allow only horizontal
translation (i.e., no vertical motion, hence neglecting gravitational force). In its passive equilibrium (no
actuation voltage applied), the mass is balanced in the center by the tensile forces of the two membranes,
FI and FII. The actuation principle of the antagonistic pure-shear DEA relies on the force balance of the two
membranes on the mass. When a voltage, Φ , is applied across the electrodes of DEA I, the electrostatic
pressure, induced by the electric field, reduces the tension on membrane I, FI. The force imbalance leads
to a translation of the mass along direction 1 until another force balance is achieved between the two
membranes, as is shown in Figure 1A. The stretch ratios of membranes I and II during deformation, λ I and
λ II, are defined as the ratios of the deformed lengths in direction 1 and the initial length, L1.
Equation of motion
The equation of motion that describes the dynamic responses of this system has been described in detail
in previous studies[24,26,36,40,43]. Hence, in this work, the development of the equation of motion is introduced
briefly and the final equation used for the rest of the study is given in the end of this subsection.
The two DE membranes and mass are considered separately at this stage with the subsystem membrane I
being investigated first. A thermodynamic framework is adopted, which indicates that the variation of the
free energy of the DE during actuation is equal to the work done jointly by the voltage, tensile force, the
viscous damping, and the inertial force of the membrane.
To derive this model, it is assumed that a voltage, T I, is applied across the compliant electrodes of the
membrane and a charge, QI, is built on the electrodes. A tensile force, P, is applied to the membrane in
direction 1. The membrane material is assumed to have a density, ρ , and a viscous damping coefficient, c.
For an infinitesimal variation of δλ I, by conservation of energy
(1)
where W is the Helmholtz free energy density, and can be expressed using the Gent model[44] as
(2)
Page 4                                                         Cao et al. Soft Sci 2021;1:1 I http://dx.doi.org/10.20517/ss.2021.01

Figure 1. (A) Schematic diagram of the antagonistic pure-shear DEA and its actuation principle. (B) Demonstration of loss-of-tension in
the membrane induced by large deformation (λ < 1). (C) Force balance analysis on membrane I, mass M, and membrane II.

where μ is the shear modulus of the material, J is the constant relating to the limiting stretch, DI is the
electric displacement of membrane I and is given as         , and ε is the permittivity.

Note that the Helmholtz free energy density equation given here is simplified due to there being no stretch
in direction 2 on the DE membrane.

By partially differentiating equation 2 with respect to λ I and substituting to equation 1, one can obtain the
expression for the tensile force, which is written as
                                                                                                           (3)

It is worth noting that a membrane is a type of element that can only withstand tension in direction 1 by
neglecting the effects of shear stress in the membrane due to the sufficiently high area-to-thickness ratio.
Hence if the tensional force on the membrane in the deformation direction becomes zero, the membrane
loses tension in this direction, as illustrated in Figure 1B and C. However, this phenomenon cannot be
captured by the well-developed continuous force-stretch function in equation 3, for instance, when λ I < 1,
the tensile force, P, becomes a finite negative value, which cannot be true. Note that in previous antagonistic
pure-shear DEA studies, P was considered as a continuous function in the region-of-interest as the pre-
stretch value was usually sufficiently large so that λ I remains > 1. However, in this study, where a low pre-
stretch value is used, the deformation, particularly at high-amplitude vibrations near the resonance of the
system, can be large enough to cause loss-of-tension on the DE membrane which creates non-smoothness
in the force function thus discontinuity in the stiffness. To take this effect in to account, a piecewise force
function is used in this work, and is written as
					FI = P(λ I, Φ I), (λ I, Φ I) > 0					 (4a)
					FI = 0, (λ I, Φ I) ≤ 0			                                                                             (4b)
where FI is the true tensile force in membrane I.

Due to the constraint applied to the two DE membranes, the stretch of membrane II can be written as
                                          λII = 2λ p - λ I			                                       (5)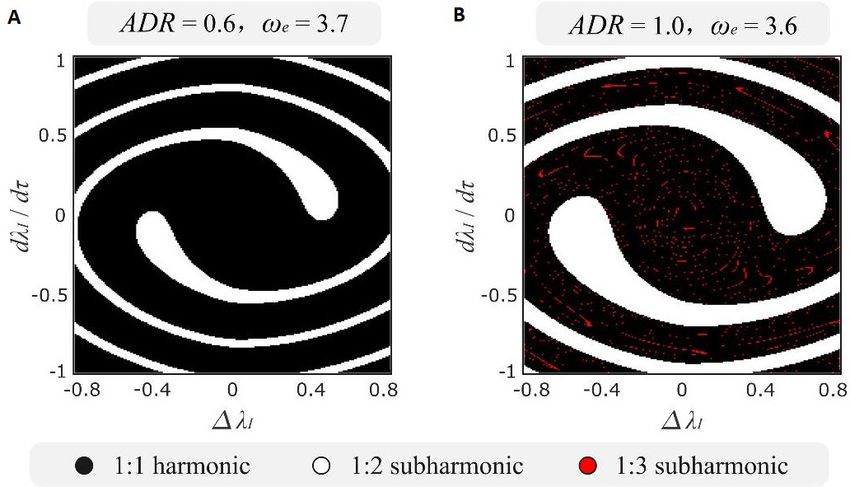
Cao et al. Soft Sci 2021;1:1 I http://dx.doi.org/10.20517/ss.2021.01 Page 5
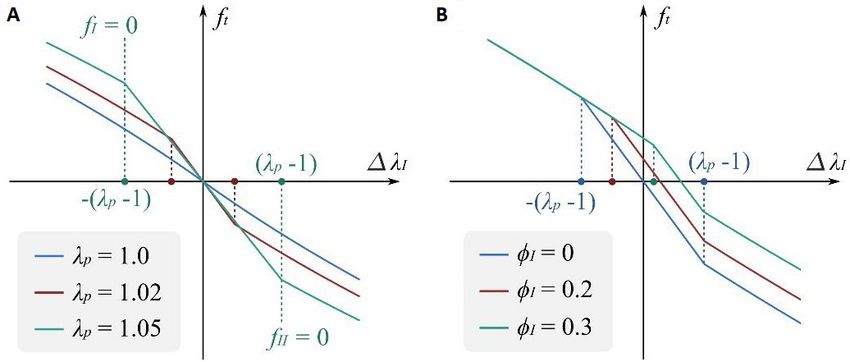
Figure 2. Force-displacement relationship of the antagonistic pure-shear DEA. (A) Total force vs. stretch offset with pre-stretch λ p = 1.0,
1.02, and 1.05. ϕ I = ϕ II = 0 in all three cases. (B) Total force vs. stretch offset with non-dimensional voltage ϕ I = 0, 0.2, and 0.3. λ p = 1.02
and ϕ II = 0 in all three cases.
Then the true tensile force, FII, can be obtained by substituting equation 5 into 4, and is given as
FII = P(2λ p - λ I, Φ II), P(2λ p - λ I, Φ II) > 0 (6a)
FII = 0, (2λ p - λ I, Φ II) ≤ 0 (6b)
where Φ II, is the voltage applied to membrane II.
The equation of motion for the mass can be obtained as
(7)
By performing nondimensionalization and neglecting the inertia force of the membranes by assuming
a sufficiently large M compared to the mass of the membrane, ρ L1L2L3, the equation of motion can be
rewritten as
(8)
where
fI = p(λ I, Φ I), (λ I, Φ I) > 0 (9a)
fI = 0, (λ I, Φ I) ≤ 0 (9b)
fII = p(2λ p - λ I, Φ II), (2λ p - λ I, Φ II) > 0 (9c)
fII = 0, (2λ p - λ I, Φ II) ≤ 0 (9d)
(9e)
is the non-dimensional time, is the non-dimensional voltage, is the
non-dimensional damping coefficient.
Figure 2A shows examples of the total force exerted on the mass, ft = -fI + fII, against the stretch offset from
its passive equilibrium (with no actuation voltage), Δλ I = λ I - λ p. Note from Figure 2A that, as the pre-
stretch is greater than 1.0, discontinuity is created when either fI or fII becomes zero, which corresponds
to λ I and λ II = 1, respectively. It is noteworthy that, in the region where -(λ p - 1) < Δλ I < (λ p - 1), the
system appears to be “stiffer” (the slope is steeper) than other regions as the two membranes act on the
mass antagonistically in this region. As a voltage is applied to membrane I, the discontinuity points do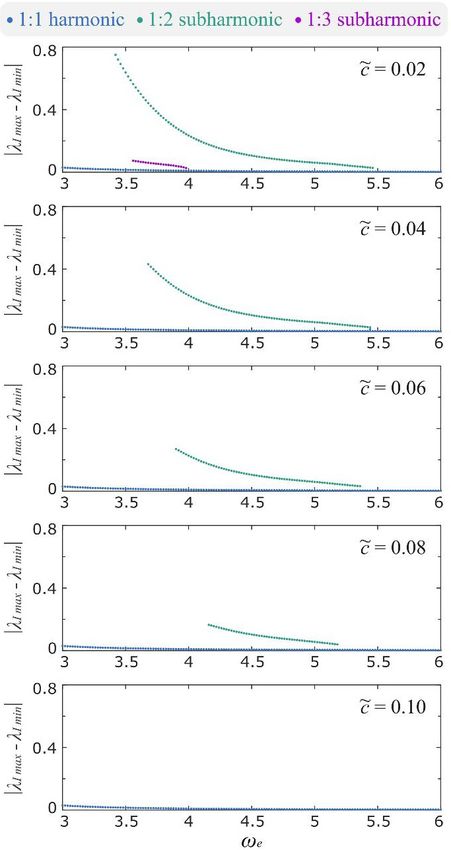
Page 6                                               Cao et al. Soft Sci 2021;1:1 I http://dx.doi.org/10.20517/ss.2021.01

not necessarily correspond to λ I and λ II = 1, as illustrated in Figure 2B. It can be noted that the leftmost
discontinuity is shifting to the right as the voltage increases and the force-displacement function is no
longer symmetrical around the passive equilibrium (origin in Figure 2).

In this work, the Gent model parameters (μ and J) are determined based on the previous studies on the
silicone elastomer ELASTOSIL (Wacker Chemie AG)[42,45,46] and is given as μ = 400 kPa and J = 16. The
dimension of the elastomer is defined as L1 = 20 mm, L2 = 200 mm, and L3 = 0.1 mm. The mass M is
chosen as 50 g. The permittivity, ε , is a product of the absolute permittivity of a vacuum and the relative
permittivity of the dielectric elastomer and is given as ε = 2.48 × 10⁻¹¹ F/m.

By solving the nondimensionalized equation of motion, equation 8, numerically in MATLAB (MathWorks),
the dynamic performance of the DEA system under parametric mechanisms of excitation is investigated
systemically in the following sections.

RESULTS AND DISCUSSION
Nonlinear dynamic responses
In this section, the nonlinear dynamic responses of the pure-shear DEA under AC voltage excitation
are investigated. In this study, only membrane I is subject to a time-varying voltage excitation, while no
actuation voltage is applied to membrane II. The forcing term of this system,         , as described in equation
9e, is a function of the displacement, λ I, hence this system is excited parametrically[47]. It is noteworthy that
the forcing term is also a function of the square of the voltage input. Therefore, for an non-dimensional AC
voltage signal given as ϕ I = ϕ DC + ϕ AC cos(ωeτ), where ϕ DC and ϕ AC are the non-dimensional direct current
(DC) and AC voltage amplitudes respectively and                      is the non-dimensional angular excitation
frequency, the force experienced by the moving mass is proportional to (following the authors’ previous
work[46])
      			                                                                        		                           (10)
where
      					                                                   		                                            (11a)
					Eb = 2ϕ DCϕ AC			                                                                                      (11b)
     					                                             			                                                        (11c)

From equation 10 it can be noted that the voltage forcing term contains one constant biasing component
and two time-varying components, one at the excitation frequency and the second at twice the input
frequency. As such, when the excitation frequency is close to either the natural frequency of the DEA
system or half of its value, resonances can be observed[42,48], which are termed primary harmonic resonance
and super-harmonic resonance, respectively. It is worth noting that both the DC and AC voltage amplitudes
contribute to the biasing forcing component, Ea. As a result, varying either ϕ AC or ϕ DC could result in a
change in the biasing excitation component, which then leads to a shift in the equilibrium point, and
hence the resonant behavior. To analyze the dynamic responses of the DEA system consistently, the biasing
forcing term, Ea, AC to DC amplitude ratio, ADR = ϕ AC/ϕ DC and the excitation frequency, ω e, are considered
as three independent variables. In this section, the frequency response of the DEA system is investigated
by varying the excitation frequency while fixing the Ea value at 0.22, and two ADR values of 0.6 and 1.0 are
chosen for comparison. In these two cases, the amplitudes for Eb are 0.041 and 0.053 respectively, while Ec
is changed from 0.006 to 0.013 as ADR is increased from 0.6 to 1.0. It can be noted that, even though the
biasing forcing amplitude Ea remains unchanged, the increase in ADR in fact increases the amplitudes of
the two time-varying forcing components. The results of these increments will lead to a higher resonance
amplitude of the DEA and can also lead to new dynamic phenomenon, as will be shown in the next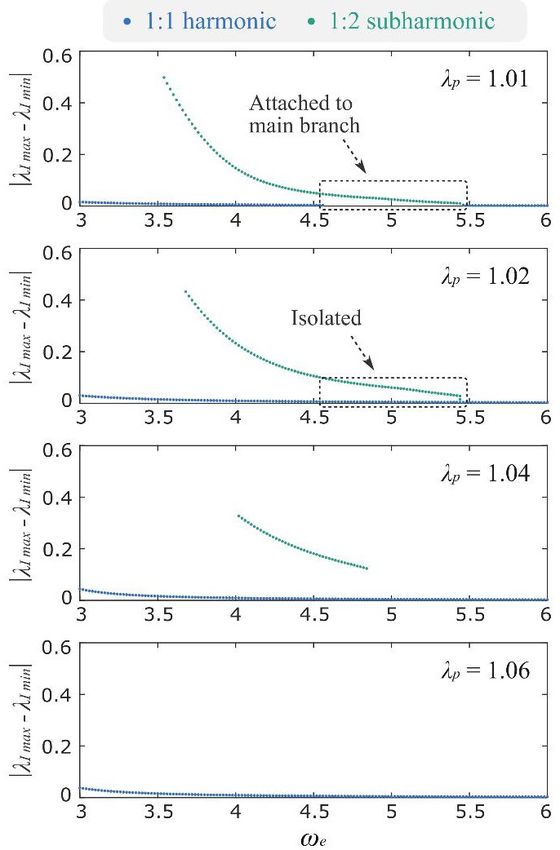
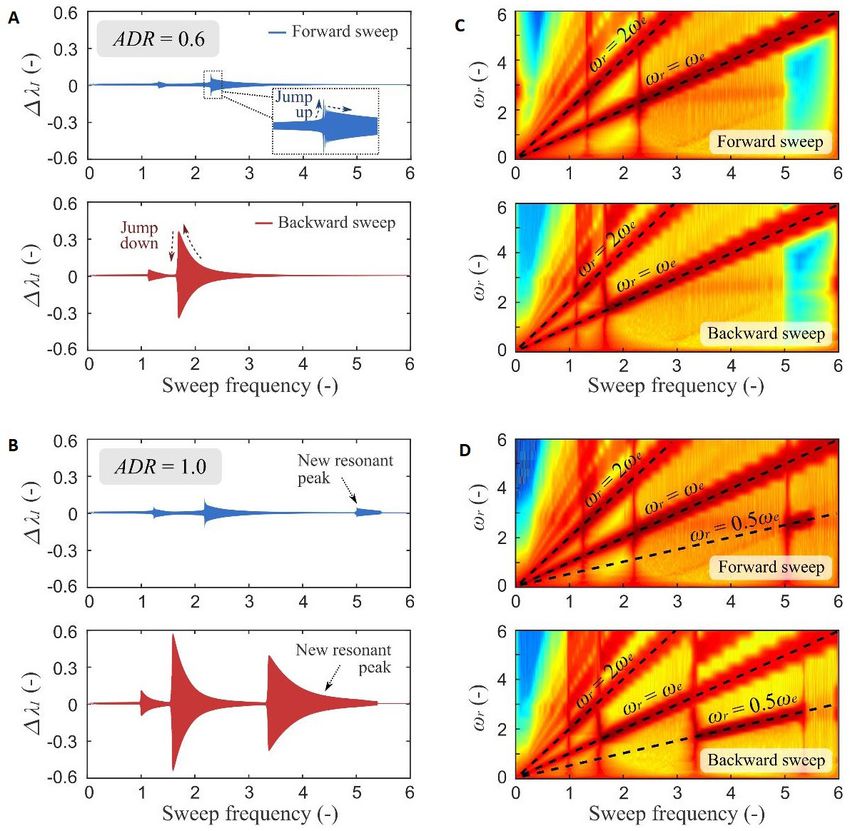
Cao et al. Soft Sci 2021;1:1 I http://dx.doi.org/10.20517/ss.2021.01                                                      Page 7

Figure 3. (A) Frequency sweep results of the ADR = 0.6 case, blue represents the forward frequency sweep and red illustrates the
backward sweep. (B) Frequency sweep results of the ADR = 1.0 case. (C) Scalogram of the ADR = 0.6 case, where dark-red represents
high-amplitude frequency responses. (D) Scalogram of the ADR = 1.0 case.

subsection. The non-dimensional damping coefficient is given as = 0.04 and the pre-stretch ratio is λ P
= 1.02. It is noteworthy that, with the material parameters adopted in this work, the nominal electrical
breakdown electric field is about 90 MV/m with no pre-stretch[49], while the applying nominal amplitude
adopted in this study is equivalent to about 40 MV/m, which is significantly lower than the critical value.
As a result, it is believed that no electric breakdown occurs within this study.

Frequency sweep results
In the first study, forward and backward frequency sweeps are conducted for the ADR = 0.6 and 1.0 case
from a non-dimensional frequency of 0 to 6 (6 to 0 for the backward sweep) over τ = 12000. The sweep
results are shown in Figure 3A and B, respectively. For the ADR = 0.6 case, two distinct resonant peaks can
be observed and, for each resonant peak, a backward sweep leads to a higher amplitude than the forward
sweep, which is mainly due to the strong nonlinearity in the DEA system causing the occurrence of two
Page 8                                                Cao et al. Soft Sci 2021;1:1 I http://dx.doi.org/10.20517/ss.2021.01

possible stable oscillations at the frequencies near resonance, one with very high resonant amplitude
and another one with low amplitude. Note that, in the forward frequency sweep, as the sweep frequency
approaches the resonant frequency from a lower value, the response first follows the lower branch and
experiences a sudden jump up, before gradually reducing as the excitation frequency increases further,
as illustrated by the dark-blue arrows in Figure 3A. However, in the backward sweep result, the response
follows the high amplitude branch as the sweep frequency decreases from above resonance and drops down
sharply once the maximum value is reached. As the ADR value is increased to 1.0, the two resonant peaks
observed in the ADR = 0.6 case grow in amplitude. Furthermore, a new resonant peak emerges at a higher
sweep frequency, as marked in Figure 3B.

The frequency components and their amplitudes in the forward frequency sweeps for the ADR = 0.6
and 1.0 cases are analyzed using a wavelet transform and the scalograms are shown in Figure 3C and D,
respectively. It can be noted from Figure 3C that the fundamental response frequency, ω r, (the frequency
component in the response with the highest amplitude, represented by the dark-red color) is equal to the
excitation frequency, ω e, with the exception near the first resonant peak, where ω r = 2ω e, demonstrating a
super-harmonic response. The fundamental response frequency in the case ADR = 1.0 follows the same
pattern. The new resonant peak found in this case shows an ω r = 0.5ω e relationship, which corresponds to a
subharmonic response.

Detailed frequency response study
The frequency sweep results demonstrated that, apart from super-harmonic and harmonic resonance,
which result from the square of the sinusoidal excitation function, there exists the subharmonic response
that is not directly correlated to the excitation. The results also illustrated that multiple stable periodic
solutions might exist at a single frequency for this dynamic system (e.g., the region between the jump-
up and down points in Figure 3A) and the stable periodic solution of the system is determined by the its
initial conditions, displacement and velocity. By using a sufficient set of initial conditions at each excitation
frequency, and numerically integrating the equation of motion in the time domain until the system reaches
a steady-state periodic oscillation, the stable responses of the DEA system, which might be hidden from the
forward and backward sweeps, can be analyzed.

i. ADR = 0.6 case
Figure 4 shows the frequency response for the ADR = 0.6 case. It can be noted that, apart from the super-
harmonic (red) and harmonic (blue) resonant peaks observed in the frequency sweep results in Figure 3A,
a “hidden” resonant peak is uncovered using this multi-initial condition approach, as marked in green in
Figure 4. The third resonant peak is in fact the same subharmonic resonant peak observed in the ADR =
1.0 case in Figure 3B, yet it is detached from the main response branch. Hence, in a continuous frequency
sweep, such a response is not able to be captured and tends to be overlooked when analyzing such systems.
Isolated response curves, or isolas, have been reported in different nonlinear dynamic systems (see, e.g.,[50-54]).
Yet to the best of the authors’ knowledge, this is the first time that an isolated subharmonic response curve
being demonstrated theoretically using a parametrically forced DEA system. The mechanism leading to this
type of isolated curve has not been fully understood, but it is believed to a result of the multi-valuedness
of the nonlinear system at some frequencies[50,51]. The oscillation amplitude of the isola can be over 10-fold
higher than the primary response at the same frequency, once triggered, it will cause a sudden jump in the
oscillation amplitude, which serves as a real threat to the dynamic stability and controllability of such DEA
systems. In practical applications, this could lead to a system failure and catastrophic outcomes.

Note from Figure 4 that, at all three frequencies where resonant peaks occur, as marked by i, ii, and iii,
there exists two stable periodic solutions. The time histories and the phase paths of the stable periodic
oscillations at ω e = 1.2, ω e = 1.8, and ω e = 3.7 are also plotted in Figure 4. It can be noted that at ω e = 1.2,
Cao et al. Soft Sci 2021;1:1 I http://dx.doi.org/10.20517/ss.2021.01                                                      Page 9

Figure 4. Frequency response, time histories and phase paths at ω e = 1.2, ω e = 1.8, and ω e = 3.7 for ADR = 0.6 case.

for both high and low amplitude solutions, the mass oscillates twice as the excitation signal repeats itself
once, demonstrating a clear 2:1 super-harmonic behavior (i.e., ω r:ω e = 2:1). At ω e = 1.8 where the primary
resonance occurs, the high amplitude solution lags behind the excitation signal by 90 degrees, while
the low-amplitude one is approximately in-phase with the excitation. At ω e = 3.7, two types of periodic
solutions exist, where the high amplitude solution corresponds to a 1:2 subharmonic response (i.e., the
mass oscillates once in every two excitation cycles). The low amplitude solution shows a 1:1 anti-phase
response with the excitation signal.
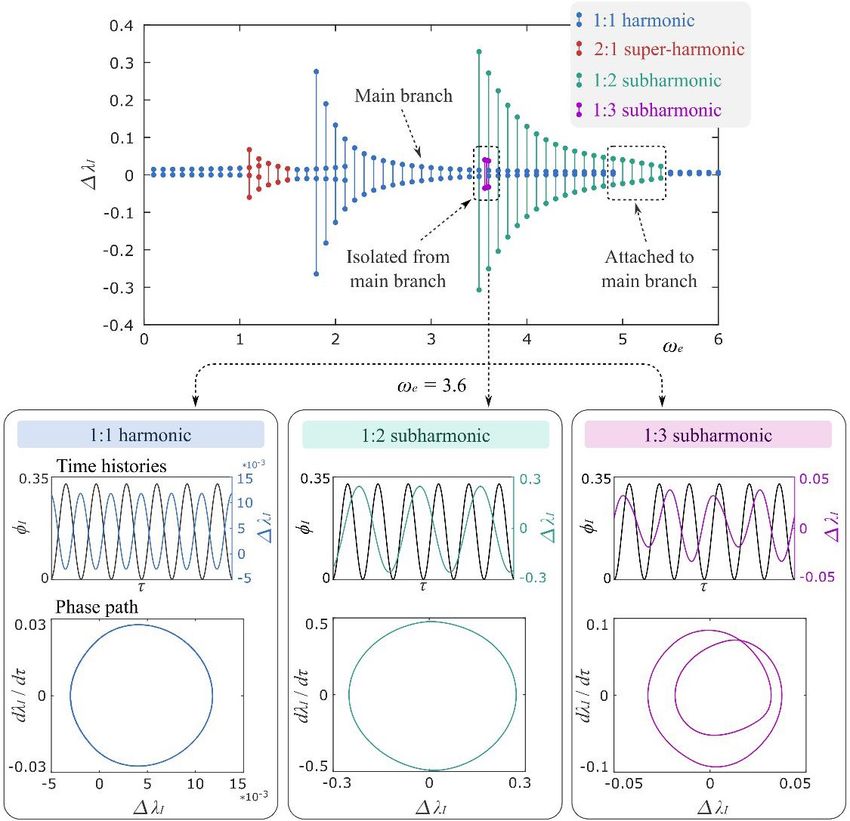
Page 10                                                           Cao et al. Soft Sci 2021;1:1 I http://dx.doi.org/10.20517/ss.2021.01

Figure 5. Frequency response, time histories and phase paths of the three stable periodic solutions at ω e = 3.6 for ADR = 1.0 case.

ii. ADR = 1.0 case
The same frequency response analysis is conducted for the ADR = 1.0 case and is shown in Figure 5. It
can be noted that, in contrast to the ADR = 0.6 case, the 1:2 subharmonic resonant branch is “attached” to
the main branch, that is, only one stable solution exists near the root of the subharmonic branch. Hence
this resonant response cannot be “skipped” in a continuous frequency sweep (as shown in Figure 3B).
The transition from an isola to an attached response curve is believed to be attributed to the transcritical
bifurcation[52], in other words, the unstable solution between the two stable solutions lowers and eventually
merges with the 1:1 harmonic branch as ADR increases.

It is noteworthy that, in the ADR = 1.0 case, a new isola emerges between the 1:1 harmonic and 1:2
subharmonic branches, as is indicated by the purple dots in Figure 5. However, this isola occurs only at a
very narrow frequency band from ω e ≈ 3.65 to 3.75. Note that, at ω e = 3.7, there exist three stable periodic
solutions, and the time history and phase path of each solution are plotted in Figure 5. The solution in
purple repeats itself in every three excitation cycles, which correlates to a 1:3 subharmonic response.
Cao et al. Soft Sci 2021;1:1 I http://dx.doi.org/10.20517/ss.2021.01                                                                Page 11

Figure 6. Basins of attraction for a parametrically forced DEA system with (A) ADR = 0.6, ω e = 3.7 and (B) ADR = 1.0, ω e = 3.6. The black,
white, and red regions represent the stable periodic solutions with the 1:1 harmonic, 1:2 subharmonic, and 1:3 subharmonic responses,
respectively.

iii. Basins of attraction
In the previous study, multiple stable periodic solutions of the DEA system at some excitation frequencies
have been demonstrated for both ADR = 0.6 and 1.0 cases. To map the initial conditions that are attracted
to the different periodic solutions in the two cases, a point mapping technique[55] is adopted by dividing the
initial condition region of interest into discrete points and numerically computing the steady-state response
that each initial condition leads to. By plotting the initial conditions and the corresponding steady-state
response, Basins of attraction can be obtained. In this study, the initial displacement and velocity ranges are
set as [-0.8, 0.8] and [-1, 1] with a step fixed at 0.08, which lead to a total of 201 × 251 points.

Two cases are considered in this basin of attraction study: (1) ADR = 0.6 and ω e = 3.7; and (2) ADR =
1.0 and ω e = 3.6. In the first case, there are two stable periodic responses (i.e., a 1:1 harmonic and 1:2
subharmonic) where the latter one is on the isola, as is demonstrated in Figure 4. In the second case, apart
from these two types of periodic orbits, a 1:3 subharmonic response also exists, as is demonstrated in
Figure 5.

The basins of attraction for the two cases are plotted in Figure 6A and B, respectively. The black, white
and red regions correspond to the periodic oscillations with 1:1 harmonic, 1:2 subharmonic and 1:3
subharmonic responses, respectively. It can be noted that both black and white basins follow a spiral
pattern. Also note that the black basin occupies the largest area in both cases, which indicates that, for both
cases, the system is more likely to be attracted to a low amplitude 1:1 harmonic response. A more intricate
pattern can be found for red basin in Figure 6B and its area is much smaller than the other two basins,
meaning it can be more difficult to detect without using the rigorous initial condition search since it is
isolated from the main response curve. It is worth noting that, for both cases, there exists a non-negligible
possibility to achieve a periodic response on the isolated response curve by adequately perturbing the
system.

Parametric study
In the last section, the frequency response of the DEA system with ADR = 0.6 and ADR = 1.0 were analyzed
and isolated response curves were uncovered in both cases. It was noted that the isola observed in the
ADR = 0.6 case becomes attached to the main response curve as ADR is increased to 1.0. In this section, an
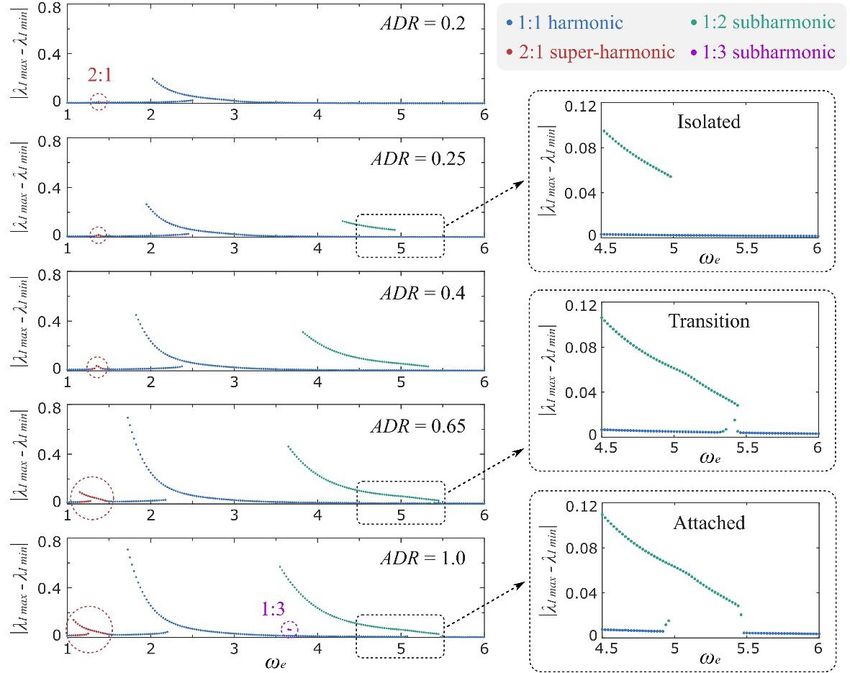
Page 12                                                          Cao et al. Soft Sci 2021;1:1 I http://dx.doi.org/10.20517/ss.2021.01

Figure 7. Effects of ADR value on the frequency response of the DEA system. Zoomed in sections show the evolution of the 1:2
subharmonic response curve. λ p = 1.02,   = 0.04, and E a = 0.22 are adopted in this study.

extensive parametric study is conducted to investigate the effects of excitation voltage parameters (ADR and
Ea), the damping, and the pre-stretch ratio of the DE membrane on the frequency response of the system.
Particular attention is given to the evolution of the isola and its interaction with the main branch.

Effects of excitation parameters
In this subsection, the effects of the excitation parameters (ADR and Ea) on the frequency response of the
system are studied. First, the ADR value is varied from 0.2 to 1.0 while keeping Ea as 0.22, and the results are
presented in Figure 7. The pre-stretch ratio is set as λ p = 1.02 and the non-dimensional damping coefficient
is = 0.04. Note that Figure 7 shows the oscillation amplitude as a function of the excitation frequency,
defined as the difference between the maximum and minimum values of λ I in a steady-state periodic
oscillation cycle.

As the ADR value increases, both the harmonic forcing amplitude Eb and super-harmonic forcing amplitude
Ec in equation 10 increase, which increases the harmonic and super-harmonic resonant amplitudes in
Figure 7. It can be noted from Figure 7 that, at a low ADR = 0.2, no subharmonic response can be found
in this system, and, as ADR is increased to 0.25, a subharmonic isola emerges and its amplitude grows
as ADR increases further. At ADR = 0.65, the isola begins to merge with the main branch, as highlighted
in the zoomed-in section. When the ADR value is increased to 1.0, this isolated response curve is firmly
attached to the main branch. Meanwhile, a new 1:3 subharmonic isola appears at ADR = 1.0, which is also
demonstrated in Figure 5.
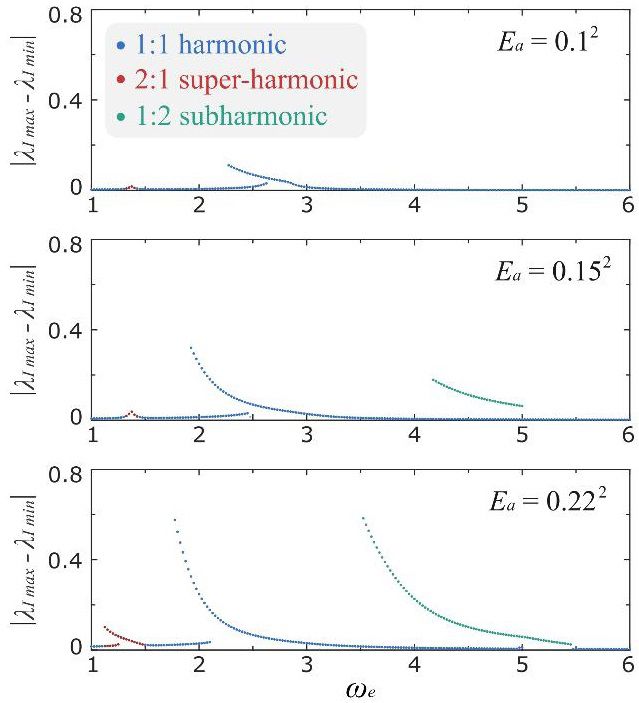
Cao et al. Soft Sci 2021;1:1 I http://dx.doi.org/10.20517/ss.2021.01                                                        Page 13

Figure 8. Effects of Ea value on the frequency response of the DEA system. λ p = 1.02,   and ADR = 0.6 are adopted in this study.

In the next study, the ADR value is fixed at 0.6 while varying the Ea and the results are plotted in Figure 8.
Increasing the Ea value increases both the AC and DC components of the excitation simultaneously, which
causes higher Eb and Ec forcing components; this leads to increases in the amplitudes of both the harmonic
and super-harmonic responses. The 1:2 subharmonic response also emerges as Ea increases, first as an
isola, before attaching to the main branch as Ea rises further. Note that, as Ea becomes sufficiently high,
the displacement from the equilibrium to one end could be greater than 1, which violates the physical
constraints of this system (i.e., the mass will collide with the constraint frames). For the case with λ p = 1.02,
  = 0.04, and ADR = 0.6, Ea should be less than 0.252 to avoid collision.

Effects of damping
In this subsection, the effects of a physical parameter, i.e., damping coefficient , is investigated with the
focus on the excitation frequency range of 3 to 6 where the subharmonic resonant peak occurs. In this
study, the ADR, Ea, and λ p values are set as 0.6, 0.22, and 1.02, respectively, while is increased from 0.02 to
0.1 with an increment of 0.02.

The frequency response of the DEA systems with different damping coefficients are shown in Figure 9. It is
worth noting that, for all five cases, the 1:2 subharmonic response curve remains detached from the main
curve. As the damping coefficient increases, the size of the isola shrinks and eventually vanishes at = 0.01.
Also note that in the lightest damping case ( = 0.02) there exists the 1:3 subharmonic isola, but this isola
quickly disappears as becomes higher. The viscous damping in the DE membranes has a clear effect on the
development of isolas in this system, for VHB elastomers which have significant viscoelastic properties, the
high viscous damping could reduce and even eliminate the isola phenomenon. However, utilizing resonant
actuation to optimize the dynamic performance of a DEA system usually requires minimizing the viscous
damping in the actuation system, which is one of the main reasons why, in dynamic applications, silicone
elastomers are preferable to VHB[15,16]. It should be noted that silicone DEA systems require comprehensive
Page 14                                                         Cao et al. Soft Sci 2021;1:1 I http://dx.doi.org/10.20517/ss.2021.01

Figure 9. Effects of damping coefficients on the frequency response of the DEA system. λ p = 1.02, ADR = 0.6, and E a = 0.22 are adopted in
this study.

dynamic analyses to ensure their dynamic behavior is fully understood due to their low viscous damping.

Effects of pre-stretch
Apart from the damping coefficient, another important physical parameter for the DEA system is the pre-
stretch ratio, λ p. In this study, the pre-stretch ratio is varied from 1.01 to 1.06, while the other parameters
are fixed at ADR = 0.6, Ea = 0.22, and = 0.04. The results of this study are plotted in Figure 10 with a focus
on the evolution of the subharmonic response curve. Note from Figure 10 that, at the lowest pre-stretch
value of 1.01, the subhramonic response curve is attached to the main branch, and quickly transitions to
an isola as λ p is increased to 1.02. It is noteworthy that increasing λ p leads to a reduction in the size of the
subharmonic response curve, such that the peak amplitude reduces and the bottom of the curve separates
Cao et al. Soft Sci 2021;1:1 I http://dx.doi.org/10.20517/ss.2021.01                                                       Page 15

Figure 10. Effects of pre-stretch ratio on the frequency response of the DEA system. ADR = 0.6, Ea = 0.22, and   are adopted in this
study.

further from the main branch. At λ p = 1.06, the subharmonic curve disappears under the current forcing
conditions.

Discussions
The study of the effects of the damping coefficients and the pre-stretch ratios demonstrate that, under
the same forcing conditions, by increasing either the damping coefficients or the pre-stretch ratios, the
subharmonic response is suppressed and eventually vanishes. However, it cannot be concluded that
subharmonic responses, either in isolated or attached form, do not exist in the parametrically forced DEA
system when the physical parameters reach those values. For insistence, as is demonstrated in the last
subplot in Figures 9 and 10, for ( = 0.1, λ p = 1.02) and ( = 0.04, λ p = 1.06) cases, no subharmonic response
is observed with the forcing condition of ADR = 0.6 and Ea = 0.22. However, it is found that, by increasing
the forcing amplitude, a subharmonic response can be triggered again, as is demonstrated in Figure 11.

The structure of the subharmonic response exhibits a complex interaction between the two physical
parameters ( and λ p) and the forcing parameters (ADR and Ea). Note that, by using the control variate
technique, the effects of each parameter may be analyzed separately. However, the subharmonic response of
this system is due to the interaction between different parameters. As shown in Figure 12, when λ p reaches
1.2, even though the forcing amplitude is higher (Ea = 0.32), there is no subharmonic response. Hence a
Page 16                                                          Cao et al. Soft Sci 2021;1:1 I http://dx.doi.org/10.20517/ss.2021.01

Figure 11. Examples showing that, by increasing the forcing amplitude, the vanished subharmonic response can be triggered again. (A) =
0.1, λ p = 1.02, and ADR = 0.6. Ea is increased from 0.22 to 0.32. (B)     , λ p = 1.06, and ADR = 0.6. Ea is increased from 0.22 to 0.252.

Figure 12. Frequency response of the DEA system with λ p = 1.2. No subharmonic response can be observed in this example.             , ADR
= 0.6, and Ea = 0.32 are adopted in this case.

future work that fully investigates the five-dimensional space (ω e, Ea, ADR, , and λ p) could enhance the
understanding of the isolated resonance responses in the DEA system.

CONCLUSIONS
This paper has investigated the nonlinear dynamic behavior of an antagonistic pure-shear DEA with a low
pre-stretch ratio. Under high-amplitude oscillations, such a configuration can lead to the loss-of-tension
of the DE membranes, which induces the discontinuity in the force-displacement function. By simulating
the effect of initial conditions, the isolated subharmonic resonant responses have been uncovered; these
behaviors cannot be captured using conventional continuation methods (e.g., frequency sweeps or
steps). The main contributions of this work are: (1) reporting isolated subharmonic response curves in a
DEA system for the first time; (2) developing a comprehensive method for the analysis of isolas in DEA
systems, including global analysis and an electro-mechanically coupled DEA dynamics model; and (3)
demonstrating the correlation between the system and forcing parameters and the evolution of isolas. The
key findings of this paper are listed as follow:
Cao et al. Soft Sci 2021;1:1 I http://dx.doi.org/10.20517/ss.2021.01                                    Page 17

(1) The pure-shear DEA exhibits multiple types of frequency response, including 2:1 super-harmonics, 1:1
harmonics, 1:2 subharmonics, and 1:3 subharmonics.

(2) The 2:1 super-harmonic and 1:1 harmonic responses are the result of the square of the excitation
function.

(3) Subharmonic resonant responses do not occur naturally from the forcing function, instead, it is a result
of the complex interaction between the forcing and response.

(4) Increasing the forcing amplitude first leads to the growth of the subharmonic response curve outside
the main frequency response curve, before causing it to attach to the main branch.

(5) Under the same forcing condition, increasing the damping coefficient and pre-stretch ratio could reduce
the size of the subharmonic response curve until it vanishes.

Isolated response curves have received increasing attention in the nonlinear dynamics community as
they often represent high amplitude responses which could lead to catastrophic outcomes[56]. For DEA
dynamic systems, isolas can be easily overlooked by using continuation methods and in controlled
environments with no perturbations, such as static lab conditions. However, in practical applications
where the environment is dynamically changing, adequate perturbations could trigger isolas hidden in
DEA systems, causing the response to jump to a high amplitude, which then leads to loss of control of
the system. As a result, a careful selection of the system parameters and a comprehensive study of the
dynamic responses are essential to avoid such outcomes in resonating DEA applications where dynamic
stability and controllability are crucial. In the meantime, as highlighted in[50,51], the isolas demonstrated
in the antagonistic pure-shear DEA system could also be exploited, for instance, in highly versatile
dynamic mechanical oscillation systems with multiple resonant modes and amplitudes. Such oscillating
systems could have practical applications in highly programmable robotic locomotion where the multiple
resonant modes and amplitudes can serve as means for steering and speed regulation. The initial condition
sensitivity of the isolas within these systems can be utilized as a passive collision controller for robots. For
example, when a robot collides with other objects, the sudden change in system states can trigger isolas
which increases the oscillation amplitude of the actuator, thus allowing for rapid escape of the robot. These
systems can also be used in smart energy harvesting where the isolas can be actively triggered to increase
bandwidth and efficiency of energy conversion.

DECLARATIONS
Authors’ contributions
Made substantial contributions to conception: Cao C, Hill TL, Gao X
Design of the study: Cao C, Chen G, Li B, Gao X
Data analysis and interpretation: Cao C, Hill TL, Wang L, Gao X
Data acquisition: Cao C
Administrative, technical, and material support: Cao C, Hill TL, Wang L, Gao X
Manuscript writing: Cao C, Hill TL, Li B, Chen G, Wang L, Gao X

Availability of data and materials
Not applicable.

Financial support and sponsorship
This work was supported in part by Guangdong Basic and Applied Basic Research Foundation
2020A1515110175; in part by the National Natural Science Foundation of China, under Grant 62003333; in
Page 18                                                             Cao et al. Soft Sci 2021;1:1 I http://dx.doi.org/10.20517/ss.2021.01

part by in part by Shenzhen Fundamental Research Project JCYJ20200109115639654.

Conflicts of interest
All authors declared that there are no conflicts of interest.

Ethical approval and consent to participate
Not applicable.

Consent for publication
Not applicable.

Copyright
© The Author(s) 2021.

REFERENCES
1.    Pelrine R, Kornbluh R, Pei Q, et al. High-speed electrically actuated elastomers with strain greater than 100%. Science 2000;287:836-9.
2.    Wang N, Cui C, Guo H, et al. Advances in dielectric elastomer actuation technology. Sci China Technol Sci 2018;61:1512-27.
3.    Carpi F, Salaris C, De Rossi D. Folded dielectric elastomer actuators. Smart Mater Struct 2007;16:S300-5.
4.    Conn A, Rossiter J. Towards holonomic electro-elastomer actuators with six degrees of freedom. Smart Mater Struct 2012;21:035012.
5.    Cao C, Chen L, Thomas H, et al. On the mechanical power output comparisons of cone dielectric elastomer actuators. IEEE/ASME Trans
      Mechatron 2021.
6.    Zhao H, Hussain A, Duduta M, et al. Compact dielectric elastomer linear actuators. Adv Funct Mater 2018;28:1804328.
7.    Luo M, Liu L, Liu C, et al. A single-chamber pneumatic soft bending actuator with increased stroke-range by local electric guidance.
      IEEE Trans Ind Electron 2020.
8.    Kofod G, Wirges W, Paajanen M, et al. Energy minimization for self-organized structure formation and actuation. Appl Phys Lett
      2007;90:1-4.
9.    Wang Y, Gupta U, Parulekar N, et al. A soft gripper of fast speed and low energy consumption. Sci China Technol Sci 2019;62:31-8.
10.   Tang C, Li B, Fang H, et al. A speedy, amphibian, robotic cube: resonance actuation by a dielectric elastomer. Sensors Actuators A Phys
      2018;270:1-7.
11.   Gu G, Zou J, Zhao R, et al. Soft wall-climbing robots. Sci Robot 2018;3:eaat2874.
12.   Li T, Zou Z, Mao G, et al. Agile and resilient insect-scale robot. Soft Robot 2018;6:133-41.
13.   Zhao J, Niu J, McCoul D, et al. Phenomena of nonlinear oscillation and special resonance of a dielectric elastomer minimum energy
      structure rotary joint. Appl Phys Lett 2015;106:133504.
14.   Cao C, Gao X, Burgess S, et al. Power optimization of a conical dielectric elastomer actuator for resonant robotic systems. Extrem Mech
      Lett 2019;35:100619.
15.   Chen Y, Zhao H, Mao J, et al. Controlled flight of a microrobot powered by soft artificial muscles. Nature 2019;575:324-9.
16.   Ji X, Liu X, Cacucciolo V, et al. An autonomous untethered fast soft robotic insect driven by low-voltage dielectric elastomer actuators.
      Sci Robot 2019;4:eaaz6451.
17.   Li Z, Zhu J, Foo C, et al. A robust dual-membrane dielectric elastomer actuator for large volume fluid pumping via snap-through. Appl
      Phys Lett 2017;111:212901.
18.   Cao C, Gao X, Conn, A. A magnetically coupled dielectric elastomer pump for soft robotics. Adv Mater Technol 2019;4:1900128.
19.   Shintake J, Rosset S, Schubert B, et al. Versatile soft grippers with intrinsic electroadhesion based on multifunctional polymer actuators.
      Adv Mater 2016;28:231-8.
20.   Gao X, Cao C, Guo J, et al. Elastic electroadhesion with rapid release by integrated resonant vibration. Adv Mater Technol
      2019;4:1800378.
21.   Li B, Cai Y, Jiang L, et al. A flexible morphing wing by soft wing skin actuation utilizing dielectric elastomer: experiments and electro-
      aerodynamic model. Smart Mater Struct 2020;29:015031.
22.   Gupta U, Godaba H, Zhao Z, et al. Tunable force/displacement of a vibration shaker driven by a dielectric elastomer actuator. Extrem
      Mech Lett 2015:2:72-7.
23.   Jordi C, Michel S, Kovacs G, et al. Scaling of planar dielectric elastomer actuators in an agonist-antagonist configuration. Sensors
      Actuators A Phys 2010;161:182-90.
24.   Gu G, Gupta U, Zhu J, et al. Modeling of viscoelastic electromechanical behavior in a soft dielectric elastomer actuator. IEEE Trans
      Robot 2017;33:1263-71.
25.   Lu T, Huang J, Jordi C, et al. Dielectric elastomer actuators under equal-biaxial forces, uniaxial forces, and uniaxial constraint of stiff
      fibers. Soft Matter 2012;8:6167.
26.   Goh Y, Akbari S, Khanh Vo T, et al. Electrically-induced actuation of acrylic-based dielectric elastomers in excess of 500% Strain. Soft
Cao et al. Soft Sci 2021;1:1 I http://dx.doi.org/10.20517/ss.2021.01 Page 19
Robot 2018;5:675-84.
27. Zhang J, Chen H, Sheng J, et al. Dynamic performance of dissipative dielectric elastomers under alternating mechanical load. Appl Phys
A 2014;116:59-67.
28. Liu F, Sun W, Zhao X, et al. Method towards optimal design of dielectric elastomer actuated soft machines. Sci China Technol Sci
2018;61:959-64.
29. Li B, Zhang J, Chen H, et al. Voltage-induced pinnacle response in the dynamics of dielectric elastomers. Phys Rev E 2016;93:052506.
30. Dai H, Wang L. Nonlinear oscillations of a dielectric elastomer membrane subjected to in-plane stretching. Nonlinear Dyn 2015; 82:
1709-19.
31. Shintake J, Rosset S, Schubert B, et al. A foldable antagonistic actuator. IEEE/ASME Trans Mechatron 2015;20:1997-2008.
32. Liu L, Chen H, Sheng J, et al. Experimental study on the dynamic response of in-plane deformation of dielectric elastomer under
alternating electric load. Smart Mater Struct 2014;23:025037.
33. Li T, Zou Z, Mao G, et al. Electromechanical bistable behavior of a novel dielectric elastomer actuator. J Appl Mech 2013;81:041019.
34. Hau S, Bruch D, Rizzello G, et al. Silicone based dielectric elastomer strip actuators coupled with nonlinear biasing elements for large
actuation strains. Smart Mater Struct 2018;27:074003.
35. Lu T, Shi Z, Shi Q, et al. Bioinspired bicipital muscle with fiber-constrained dielectric elastomer actuator. Extrem Mech Lett 2016;6:75-
81.
36. Rus D, Tolley M. Design, fabrication and control of soft robots. Nature 2015;521:467-75.
37. Li B, Zhang J, Liu L, et al. Modeling of dielectric elastomer as electromechanical resonator. J Appl Phys 2014;116:124509.
38. Liu L, Li B, Sun W, et al. Viscoelastic effect and creep elimination of dielectric elastomers in adversarial resonance. J Appl Phys
2016;120:164502.
39. Zhang J, Zhao J, Chen H, et al. Dynamic analyses of viscoelastic dielectric elastomers incorporating viscous damping effect. Smart Mater
Struct 2017;26:015010.
40. Zhang J, Chen H, Li D. Pinnacle elimination and stability analyses in nonlinear oscillation of soft dielectric elastomer slide actuators.
Nonlinear Dyn 2018;94:1907-20.
41. Cao C, Burgess S, Conn A. Toward a dielectric elastomer resonator driven flapping wing micro air vehicle. Front Robot AI 2019;5:1-11.
42. Cao C, Hill T, Conn A. On the nonlinear dynamics of a circular dielectric elastomer oscillator. Smart Mater Struct 2019;28:075020.
43. Sheng J, Chen H, Li B, et al. Nonlinear dynamic characteristics of a dielectric elastomer membrane undergoing in-plane deformation.
Smart Mater Struct 2014;23:045010.
44. Gent A. A new constitutive relation for rubber. Rubber Chem Technol 1996;69:59-61.
45. Cao C, Gao X, Conn A. A compliantly coupled dielectric elastomer actuator using magnetic repulsion. Appl Phys Lett 2019;114:011904.
46. Cao C, Hill T, Conn A, et al. Nonlinear dynamics of a magnetically coupled dielectric elastomer actuator. Phys Rev Appl 2019;12:044033.
47. Zhu J, Cai S, Suo Z. Resonant behavior of a membrane of a dielectric elastomer. Int J Solids Struct 2010;47:3254-62.
48. Hodgins M, Rizzello G, Naso D, et al. An electro-mechanically coupled model for the dynamic behavior of a dielectric electro-active
polymer actuator. Smart Mater Struct 2014;23:104006.
49. Forster-Zügel F, Solano-Arana S, Klug F, et al. Dielectric breakdown strength measurements with silicone-based single-layer dielectric
elastomer transducers. Smart Mater Struct 2019;28:075042
50. Gatti G. Uncovering inner detached resonance curves in coupled oscillators with nonlinearity. J Sound Vib 2016;372:239-54.
51. Gatti G, Brennan M. Inner detached frequency response curves: an experimental study. J Sound Vib 2017;396:246-54.
52. Duan C, Singh R. Isolated sub-harmonic resonance branch in the frequency response of an oscillator with slight asymmetry in the
clearance. J Sound Vib 2008;314:12-8.
53. Ehrhardt D, Hill T, Neild S. Experimentally measuring an isolated branch of Nonlinear normal modes. J Sound Vib 2019;457:213-26.
54. Hong D, Hill T, Neild S. Conditions for the existence of isolated backbone curves. Proc R Soc A Math Phys Eng Sci 2019;475:20190374.
55. Wagg D, Neild S. Nonlinear vibration with control. Springer-Verlag; 2009.
56. Noël J, Kerschen G. Nonlinear system identification in structural dynamics: 10 more years of progress. Mech Syst Signal Process
2017;83:2-35.You can also read