Movie Recommender System for Profit Maximization
←
→
Page content transcription
If your browser does not render page correctly, please read the page content below
Movie Recommender System for Profit Maximization

              Amos Azaria1 , Avinatan Hassidim1 , Sarit Kraus1,2 , Adi Eshkol3 , Ofer Weintraub3
                                                  Irit Netanely3
            1
              Department of Computer Science, Bar-Ilan University, Ramat Gan 52900, Israel
               2
                 Institute for Advanced Computer Studies University of Maryland, MD 20742
                          3
                            Viaccess-Orca, 22 Zarhin Street, Ra’anana 43662, Israel
                                     {azariaa1,avinatan,sarit}@cs.biu.ac.il,
                         {adi.eshkol, ofer.weintraub,irit.netanely}@viaccess-orca.com

ABSTRACT                                                                             from a third party - but also in these cases the site is paying for the
Traditional recommender systems minimize prediction error with                       recommendations). The business’ end goal is usually to increase
respect to users’ choices. Recent studies have shown that recom-                     sales, revenues, user engagement, or some other metric. In that
mender systems have a positive effect on the provider’s revenue.                     sense, the user is not the end customer of the recommendation sys-
   In this paper we show that by providing a set of recommenda-                      tem, although she sees the recommendations [13]. Still, one could
tions different than the one perceived best according to user ac-                    argue that it is better for the business to give the user the best possi-
ceptance rate, the recommendation system can further increase the                    ble recommendations, as it will also maximize the business’ profit,
business’ utility (e.g. revenue), without any significant drop in user               either in the short run (no point in giving recommendations which
satisfaction. Indeed, the recommendation system designer should                      are not followed by the users) or at least in the long run (good rec-
have in mind both the user, whose taste we need to reveal, and the                   ommendations make users happy).
business, which wants to promote specific content.                                      In this paper, we provide evidence that a business may gain sig-
   In order to study these questions, we performed a large body of                   nificantly by providing users with recommendations that may not
experiments on Amazon Mechanical Turk. In each of the experi-                        be best from the users point of view but serve the business’ needs.
ments, we compare a commercial state-of-the-art recommendation                       We provide an algorithm which uses a general recommender sys-
engine with a modified recommendation list, which takes into ac-                     tem as a black-box and increases the utility of the business. We
count the utility (or revenue) which the business obtains from each                  perform extensive experiments with it in various cases. In particu-
suggestion that is accepted by the user. We show that the modi-                      lar, we consider two settings:
fied recommendation list is more desirable for the business, as the                      1. The Hidden Agenda setting: In this setting, the business has
end result gives the business a higher utility (or revenue). To study                       items that it wants to promote, in a way which is opaque
possible reduce in satisfaction by providing the user worse sugges-                         to the user. For example, a movie supplier which provides
tions, we asked the users how they perceive the list of recommen-                           movies on a monthly fee basis but has different costs for dif-
dation that they received. Our findings are that any difference in                          ferent movies, or a social network which wants to connect
user satisfaction between the list is negligible, and not statistically                     users who are less engaged to more engaged ones. Netflix,
significant.                                                                                for instance, set a filter to avoid recommending new releases
   We also uncover a phenomenon where movie consumers prefer                                which have high costs to them [24].
watching and even paying for movies that they have already seen
in the past than movies that are new to them.                                            2. The Revenue Maximizing setting: In this case the goal of the
                                                                                            recommender system is to maximize the expected revenue,
1.     INTRODUCTION                                                                         e.g. by recommending expensive items. In this setting, there
                                                                                            is an inherent conflict between the user and the business.
   The main goal in designing recommender systems is usually to
predict the user’s wish list and to supply her with the best list of                    To study these settings, we conducted experiments on Amazon
recommendations. This trend is prevalent whether we consider a                       Mechanical Turk (AMT) in which subjects were asked to choose
social network recommending friends [2], consumer goods [14] or                      a set of favorite movies, and then were given recommendations for
movies [11].                                                                         another set of movies. For each recommendation, the subjects were
   However, in most cases, the engineers that design the recom-                      asked if they would or would not watch the movie1 . Finally, in or-
mender system are hired by the business which provides the sug-                      der to test possible reduce in satisfaction cased by tuning the rec-
gestions (in some cases the web-site buys a recommendation engine                    ommendations to the business’ needs, we asked each subject how
                                                                                     good she feels about the recommendations she received.
                                                                                        This form of experimentation makes two assumptions. First, we
                                                                                     simulate long term effects by asking users about their satisfaction
                                                                                     from the list. It is possible that users would report that the modi-
Permission to make digital or hard copies of all or part of this work for
personal or classroom use is granted without fee provided that copies are            fied list is satisfactory, but would enjoy it less subconsciously, and
not made or distributed for profit or commercial advantage and that copies           this would bias them against our system in the long run. Second,
bear this notice and the full citation on the first page. To copy otherwise, to      1
republish, to post on servers or to redistribute to lists, requires prior specific    In the Revenue Maximization setting each recommended movie
permission and/or a fee.                                                             also came with a price tag. We describe the experiments later in the
Copyright 20XX ACM X-XXXXX-XX-X/XX/XX ...$15.00.                                     experiments section.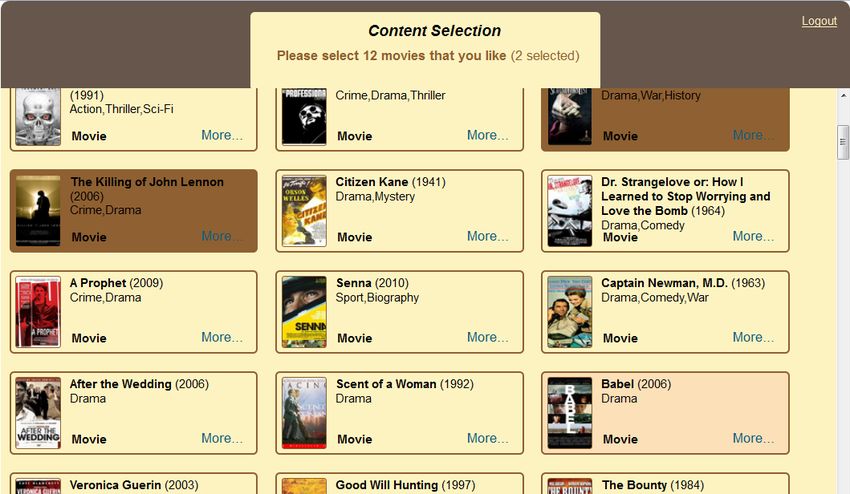
we assume that asking users if they are willing to pay for a movie          black box, does not change the pricing and tries to increase the
is the same as actually taking their money and showing them the             revenue directly.
movie. Both assumptions are common in the literature (for a com-               Pathak et al. [17] study the cross effects between sales, pricing
parison between hypothetical and real scenarios see [18]). We hope          and recommendations on Amazon books. They show that recom-
to integrate the algorithm in a real world system to circumvent the         mendation systems increase sales and cause price changes. How-
assumptions.                                                                ever, the recommendation systems that they consider are price in-
   Manipulating the recommender system in order to increase rev-            dependent, and the effect on prices is indirect - items which are
enue (or to satisfy some other hidden agenda) raises some ethical           recommended more are bought more, which affects their price (the
concerns. If users believe that a particular algorithm is being used        pricing procedure used in their data takes popularity into account).
(e.g. collaborative filtering), then they could be irritated if they find   They do not consider having the price as an input to the system,
out that recommendations are being edited in some way. However,             and do not try to design new recommendation systems.
most businesses do not provide the specification of their recom-               Chen et al. [4] develop a recommender system which tries to
mender system (treating it as a “secret sauce"), which diminishes           maximize product profitability. Chen et al. assume the usage of
this concern. Furthermore, several companies (including Netflix,            a collaborative filtering recommender system which, as part of its
Walmart and Amazon) admitted human intervention in their recom-             construction, provides a theoretically-based probability that a user
mender system [17], so it may well be that different companies are          will purchase each item. They multiply this probability by the rev-
already tweaking their recommender systems for their own good.              enue from each item and recommend the items which yield the
In this sense, an important lesson to take away from this work is           highest expected revenue. However, in practice, many recommender
“users beware". We show that businesses garner a large gain by              systems do not rely only upon collaborative filtering (which can’t
manipulating the system, and many companies could be tempted                be applied to new items or when the data is sparse), but also rely
by this increase in revenue. In this paper we proposes a method             on different engines (such as popularity, semantic similarity, etc.).
which allows businesses to mount their existing recommender sys-            Even a business using a pure collaborative filtering engine may not
tem in order to increase their revenue.                                     necessarily have access to (or may not want to access) the inter-
   An interesting phenomenon that we uncover is that subjects are           nal workings of their own recommender system. Therefore, we
more willing to pay for movies that they’ve already seen. While             assume a generic recommender system which is treated as a black-
a similar phenomena is known for other types of consumer goods,             box component, and dedicate most of our work to building a human
coming across it with regards to movies is new and somewhat counter-        model in order to predict the acceptance rate of a given item using
intuitive. Interestingly, in movie watching, two opposite effects           a generic recommender system.
come into play: 1. Variety seeking: users want new experiences                 Das et al. [5] provide a mathematical approach for maximizing
(see the survey [15] for a model of variety seeking customers). 2.          business revenue using recommender systems. However, they as-
Loyalty: users are loyal to brands that they know and used. It is           sume that as long as the recommendations are similar enough to
usually assumed that in movies the former effect is far more dom-           the customer’s own ratings, the customer is likely to follow the rec-
inant [12, 7]. Although we supply some explanation for this phe-            ommendations. Therefore, Das et al. do not model the actual drop
nomenon, further research is required in order to fully understand          in user acceptance rate as the item becomes less relevant or as the
it. We note that this phenomena has implications to the design of           item price increases, as is done in this work. Similarly, Hosanagar
recommender systems – some systems take care not to recommend               et al. [9] use a mathematical approach to study the conflict which a
a movie which was previously watched. Instead, one may be better            business confront when using recommender systems. On one hand
off recommending movies that the user saw in the past as well.              the business would like to recommend items with higher revenue
   To summarize, the main contribution of this paper is twofold:            (margins), but on the other hand it would like to recommend items
                                                                            which the users are more likely to buy. Hosanagar et al. show that
     • Providing an algorithm for utility maximization of a movie           in order to increase its total revenue, the business must balance be-
       supplier service, in two different settings, one with prices and     tween these two factors. Unfortunately, neither paper provides any
       the other without. This algorithm is provided along with an          actual experimental evaluation with people, as is provided in this
       extensive experiment demonstrating its performance.                  paper.
     • Uncovering the interesting behavior of movie consumers, who             Shani et al. [23] use a discrete-state MDP model to maximize the
       prefer watching and paying for movies that they have already         system’s utility function, taking into account the future interactions
       seen in the past (to watching and paying for movies which are        with their users. In their work, the system may, for example, de-
       new to them).                                                        cide to recommend a game console, since, if purchased, the user is
                                                                            likely to purchase many games for it in the future. This approach is
  These findings have major consequences for design of recom-               not applicable to our domain as we consider a single-shot recom-
mendation systems for movie providers..                                     mendation. Furthermore, in the movie recommendation domain,
                                                                            most movies have very little impact on each other, and watching a
2.     RELATED WORK                                                         certain movie doesn’t usually increase or decrease the probability
                                                                            that the user will watch a different movie. In [1] we model the long-
   Models for predicting users’ ratings have been proposed that are
                                                                            term affect of advice given by a self-interested system on the users
used by recommendation systems to advise their users (See Ricci et
                                                                            in route selection problems. In order for the system to maximize
al. [19] for a recent review). It has been shown that recommender
                                                                            its long term expected revenue, we suggest that it uses what we
systems, in general, are beneficial for the providing business [22].
                                                                            term the “social utility" approach. However, in [1] we assume that
However, most works in this realm do not explicitly try to maximize
                                                                            the user must select his action among a limited number of options
the system’s revenue, but only consider the utility of the user. The
                                                                            and the system merely recommends a certain action. Therefore the
works that do try to directly increase the system’s revenue usually
                                                                            system does not act as a classic recommender system, which rec-
take a more holistic approach, changing the pricing and using the
                                                                            ommends a limited number of items from a very large corpus. Still,
inner workings of the recommendation system. As far as we know,
                                                                            both of the above works may be found useful if combined with the
this is the first work which treats the recommender system as a
approach given in this paper, when considering repeated interac-
tions scenarios. Table 1: Function forms for considered functions. α and β are
We now turn to discuss related work to the phenomenon where non-negative parameters and r(m) is the movie rank.
movie consumers prefer watching movies that they have already function function form
seen. The marketing literature contains many examples in which linear (decay) α − β · r(m)
an individual experiencing one type of event is more likely to ex- exponent (exponential decay) α · e−β·r(m)
perience it again. Such examples include unemployment, accidents log (logarithmic decay) α − β · ln(r(m))
and buying a specific product (or brand). Heckman [8] discusses power (decay) α · r(m)−β
two possible explanations: either the first experience changes the
individual and makes the second one more likely (e.g. the indi-
vidual bought a brand and liked it), or that this specific individual
may only happen with the linear and log functions - however, in
is more likely to have this experience (e.g. a careless driver has a
practice, we did not encounter this need).
higher probability of being involved in a car accident). Kamakura
Among the functions that we tested, the linear function turned
and Russell [10] show how to segment a market into loyal and non-
out to provide the best fit to the data in the hidden agenda setting (it
loyal customers, where the loyal customers are less price sensitive
resulted with the greatest coefficient of determination (R2 )). There-
and keep buying the same brand (see the works of [6] and [20] who
fore, the probability that a user will want to watch a movie as a
show that even a very short purchase history data can have a huge
function of its rank (to the specific user) takes the form of (where
impact, and that of [16] which shows that consuming one product
α and β are constants):
from a particular company increases the probability of consuming
another product from the same company).
Russel et al. [21] interviewed 23 subjects regarding repeated ex-
p(m|r(m)) = α − β · r(m) (1)
periences. They describe several benifits people might have from
rereading a book, re-watching a movie etc. For example, when Given a new user, PUMA sorts the list of movies which is out-
rereading a book, the person can pay more attention to the lan- putted by the original recommender system according to its ex-
guage and the expressions used. Since people’s memory is imper- pected promotion value, which is given by:
fect, when re-watching a movie, people reconstruct their memory,
and this reconstruction may tack back and forth between the actual p(m|r(m)) · v(m) (2)
memory and new knowledge acquired since. The reconstructive
experience may add levels of complexity and depth. and provides the top n movies as its recommendation.
3. PUMA 3.2 Algorithm for Revenue Maximizing
In this section we present the Profit and Utility Maximizer Algo- In this setting, every movie is assigned a fixed price (different
rithm (PUMA). PUMA mounts a black-boxed recommender sys- movies have different prices). Each movie is also assumed to have
tem which supplies a ranked list of movies. This recommender a cost to the vendor. PUMA intends to maximize the revenue ob-
system is assumed to be personalized to the users, even though this tained by the vendor, which is the sum of all movies purchased by
is not a requirement for PUMA. the users minus the sum of all costs to the vendor.
PUMA’s variant for the Revenue Maximizing settings confronts
3.1 Algorithm for Hidden Agenda Setting a much more complex problem than the PUMA’s variant for the
In the hidden agenda setting, the movie system supplier wants hidden agenda for the following two reasons: 1. There is a direct
to promote certain movies. Movies aren’t assigned a price. We as- conflict between the system and the users. 2. PUMA must model
sume that each movie is assigned a promotion value, v(m), which the likelihood that the users will watch a movie as a function of both
is in V = {0.1, 0.2, ..., 1}. The promotion value is hidden from the movie rank and the movie price.
the user. The movie system supplier wants to maximize the sum Building a model by learning a function of both the movie rank
of movie promotions which are watched by the users, i.e. if a user and the movie price together is unfeasible as it requires too many
watches a movie, m, the movie supplier gains v(m); otherwise it data points. Furthermore, in such a learning phase the movie sup-
gains nothing. plier intentionally provides sub-optimal recommendation, which
The first phase in PUMA’s construction is to collect data on the may result in a great loss. Instead, we assume that the two vari-
impact of the movie rank (r(m)) in the original recommender sys- ables are independent, i.e. if the movie rank drops, the likelihood
tem on the likelihood of the users to watch a movie (p(m)). To this of the user buying the movie drops similarly for any price group.
end we provide recommendations, using the original recommender This assumption was used since we found no correlation between
system, ranked in leaps of a given k (i.e. each subject is provided the prices of movies in Amazon and their popularity in IMBD.
with the recommendations which are ranked: {1, k, ..., (n − 1) · In order to learn the impact of the price on the likelihood of the
k + 1} for the given subject in the original recommender system). users buying a movie, we use the recommender system as is, pro-
We cluster the data according to the movie rank and, using least viding recommendations from 1 to n. We cluster the data into pric-
squared regression, we find a function that best explains the data as ing sets where each price (fee f ) is associated with the fraction
a function of the movie rank. We consider the following possible of users who want to buy a movie (m) for that price. Using least
functions: linear, exponent, log and power (see Table 1 for function squares regression we find a function that best explains the data
forms). We do not consider functions which allow maximum points as a function of the price. We tested the same functions described
(global or local) which aren’t at the edges, as we assume that the above (see Table 1 - replace movie rank with movie fee), and the
acceptance rate of the users should be highest for the top rank and log function resulted with a nearly perfect fit to the data. Therefore,
then gradually decrease. Since these functions intend to predict the the probability that a user will be willing to pay in order to watch a
probability of the acceptance rate, they must return a value between movie as a function of its fee takes the form of (where α and β are
0 and 1, therefore a negative value returned must be set to 0 (this constants):p(m|f (m)) = α1 − β1 · ln(f (m)) (3)
In order to learn the impact of the movie rank (r) in the rec-
ommender system on the likelihood of the users buying a movie,
we removed all prices from the movies and asked the subjects if
they were willing to pay to watch the movie (without mentioning
its price). As in the hidden agenda settings, we provided recom-
mendations in leaps of k0 (i.e. recommendations are in the group
{1, k0 + 1, ..., (n − 1) · k0 + 1}). We clustered the data accord-
ing to the movie rank and once again using least squared regression
we found a function that best explains the data as a function of the
movie rank. Among the functions that we tested (see Table 1), the
log function turned out to provide the best fit to the data for the
movie rank as well (resulting with the greatest coefficient of deter- Figure 1: A screen-shot of a subject selecting movies he liked
mination (R2 )). Using the log function (which is a convex function)
implies that the drop in user acceptance rate between movies in the
top rankings is larger than the drop in user acceptance rate within minus the movie cost to the vendor (c(m)). I.e. given a human
the bottom rankings. The difference in the function which best fits model, PUMA recommends the top n movies which maximize:
the data between the hidden agenda setting and the revenue maxi-
(f (m) − c(m)) · p(m|r(m), f (m)) (8)
mizing setting is sensible, since, when people must pay for movies
they are more keen that the movies be closer to their exact taste,
therefore the acceptance rate drops more drastically. The probabil- 4. EXPERIMENTS
ity that a user will be willing to pay in order to watch a movie as a All of our experiments were performed using Amazon’s Me-
function of its rank takes the form of: chanical Turk service (AMT). Participation in all experiments con-
sisted of a total of 245 subjects from the USA, of which 50.6%
p(m|r(m)) = α2 − β2 · ln(r(m)) (4) were females and 49.4% were males, with an average age of 31.5.
The subjects were paid 25 cents for participating in the study and
A human model for predicting the human willingness to pay to a bonus of additional 25 cents after completing it. We ensured that
watch a movie, p(m|r(m), f (m)), requires combining Equations every subject would participate only once (even when considering
3 and 4; however this task is non-trivial. Taking p(m|r(m)f (m) different experiments). The movie corpus included 16, 327 movies.
to be p(m|r(m)) · p(m|f (m)) does not make sense: for example The original movie recommender system receives a list of 12 pre-
if both signals say that the probability of watching is 0.5 then the ferred movies for each user and returns a ranked list of movies that
output should be 0.5 and not 0.25. Using this intuition, we assume have a semantically similar description to the input movies, have a
that Equation 3 is exact for the average rank it was trained upon similar genre and also considers the released year and the popular-
which is n2 + 1. Therefore, by adding a correction term, γ(m), ity of the movies (a personalized non-collaborative filtering-based
to Equation 4 we require that Equation 4 gives the same viewing recommender system). We set n = 10, i.e., each subject was rec-
probability as Equation 3 on n2 + 1: ommended 10 movies.
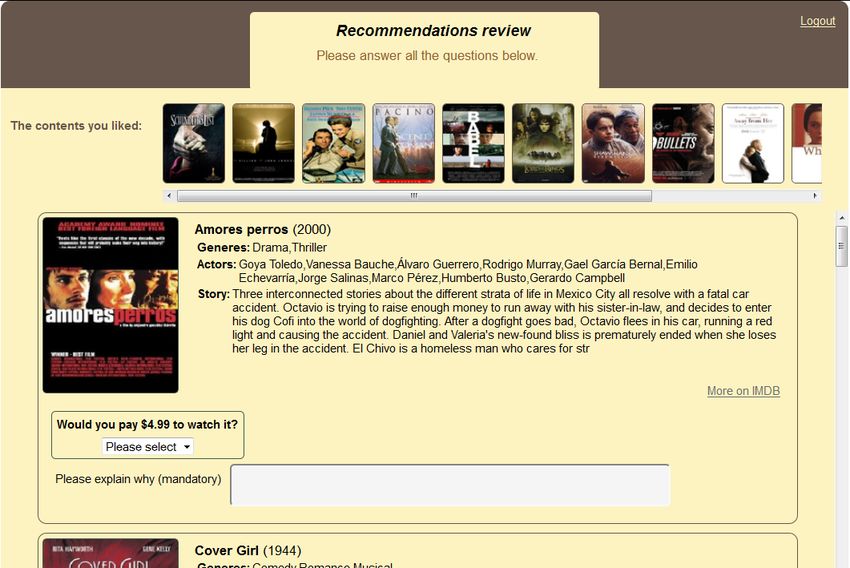
After collecting demographic data, the subjects were asked to
n choose 12 movies which they enjoyed most among a list of 120
α2 + γ(f (m)) − β2 · ln( + 1) = α1 − β1 · ln(f (m)) (5) popular movies (see Figure 1 for a screen-shot). Then, depending
2
on the experiment, the subjects were divided into different treat-
Isolating γ(m) we get: ment groups and received different recommendations.
n The list of recommendations included a description of each of
γ(f (m)) = (α1 − α2 ) + β2 · ln( + 1) − β1 · ln(f (m)) (6) the movies (see Figure 2 for an example). The subjects were shown
2
the price of each movie, when relevant, and then according to their
Therefore, our human model for predicting the fraction of users treatment group were asked if they would like to pay in order to
who will buy a movie, m, given the movie price, f (m), and the watch it, or simply if they would like to watch the movie. In order to
movie rank, r(m) (obtained from the recommender system) is: assure truthful responses, the subjects were also required to explain
their choice ("Please explain why (mandatory)"). After receiving
p(m|r(m), f (m)) = α2 + ((α1 − α2 )+ the list of recommendations and specifying for each movie if they
n would like to buy it (watch it), the subjects were shown another
β2 · ln( + 1) − β1 · ln(f (m))) − β2 · ln(r(m)) (7)
2 page including the exact same movies. This time they were asked
and after simple mathematical manipulations: whether they have seen each of the movies ("Did you ever watch
movie name?"), whether they think that a given movie is a good
r(m) recommendation ("Is this a good recommendation?") and rated the
p(m|r(m), f (m)) = α1 − β2 · ln( n ) − β1 · ln(f (m))
2
+1 full list ("How would you rate the full list of recommendations?")
on a scale from 1 to 5. These questions were intentionally asked on
Once a human model is obtained, PUMA calculates the expected a different page in order to avoid framing [25] and to ensure that
revenue from each movie simply by multiplying the movie revenue the users return their true preferences2 .
with the probability that the user will be willing to pay to watch it
(obtained from the model) and returns the movies with the highest 2
We conducted additional experiments where the subjects were
expected revenues. The revenue is simply the movie price (f (m)) first asked whether they watched each movie and then accordingTable 3: Coefficient of determination for functions tested for
the hidden agenda setting
function R2
linear 0.31
exponent 0.29
log 0.21
power 0.21
Table 4: The fraction of subjects who wanted to watch each
movie, average promotion gain, overall satisfaction and frac-
tion of movies who were marked as good recommendations
treatment want to average overall
group watch promotion satisfaction
Rec-HA 76.8% 0.436 4.13
Figure 2: Recommendation page screen-shot PUMA-HA 69.8% 0.684 3.83
Learn-HA 62.0% - 3.77
Table 2: Demographic statistics for the hidden agenda setting
treatment number of fraction of average was negative 0.56, which implies that the original recommender
group subjects females age system performed well), and additional data would have probably
Rec-HA 31 58.1% 32.3 yielded a better coefficient of determination. Nevertheless, the fit-
PUMA-HA 30 50.0% 32.6% to-data reached was definitely good enough, as can be seen by the
Learn-HA 30 53.3% 29.4% performance results. Table 3 lists coefficient of determination for
all functions tested.
The specific human model obtained, which was used by PUMA
4.1 Hidden Agenda Setting (in the hidden agenda settings) is simply:
In the hidden agenda setting we assume that the subjects have p(m|r(m)) = 0.6965 − 0.0017 · r(m) (9)
a subscription and therefore they were simply asked if they would
like to watch each movie ("Would you watch it?"). The hidden As for the results: PUMA significantly (p < 0.001 using stu-
agenda setting experiment was composed of three different treat- dent t-test) outperformed the original recommender system by in-
ment groups. Subjects in the Rec-HA group received the top 10 creasing its promotion value by 57% with an average of 0.684 per
movies returned by the original recommender system. Subjects in movie for PUMA-HA versus an average of only 0.436 per movie
the PUMA-HA group received the movies chosen by PUMA. Sub- for the Rec-HA group. No statistically significant differences were
jects in the Learn-HA group were used for data collection in or- observed between the two groups from the average satisfaction for
der to learn PUMA’s human model. Table 2 presents some demo- each of the movies or in the user satisfaction from the full list. It
graphic statistics on the subjects in these three treatment groups. is likely that using more data, one could get a statistically signifi-
For the data collection on the movie rank phase (Learn-HA) we cant drop in user satisfaction. Our best estimate is a 3% drop in the
had to select a value for k (which determines the movie ranks fraction of good recommendations (from 71% rated as good rec-
on which we collect data; see Section 3.1). The lower the k is, ommendations in the Rec-HA group vs. 69% in the PUMA-HA
the more accurate the human model is for the better (lower) rank- group), and a 7% loss in the satisfaction from the entire list. See
ings. However, on the other hand, the higher k is, the more rank- Table 4 for additional details.
ings the human model may cover. In the extreme case where the
ranking has a minor effect on the human acceptance rate, the ven- 4.2 Revenue Maximizing Setting
dor may want to recommend only movies with a promotion value For the revenue maximizing settings, all movies were randomly
of 1. Even in that extreme case, the highest movie rank, on av- assigned a price which was in F = {$0.99, $2.99, $4.99, $6.99, $8.99}.
3
erage, should not exceed |V | · n, which is 100. Therefore, we We assumed that the vendor’s cost doesn’t depend on the num-
set k = 10, which allows us to collect data on movies ranked: ber of movies sold and therefore set c(m) = 0 for all movies.
{1, 11, 21, 31, 41, 51, 61, 71, 81, 91}. The subjects were asked if they would pay the movie price in order
Unfortunately, the data collected in the Learn-HA group was to watch the movie ("would you pay $movie price to watch it?").
very noisy, as the movies in the 11th rank resulted with a much As in the hidden agenda setting, subjects were divided into three
higher acceptance rate than those in the 1st rank. Furthermore, the treatment groups. Subjects in the Rec-RM group received the top
movies in the 71st rank resulted in a much lower acceptance rate 10 movies returned by the original recommender system. Subjects
than those in the 81st rank. Therefore the coefficient of determina- in the PUMA-RM group received the movies chosen by PUMA.
tion (R2 ) was only 0.31. Still, the tendency of the data was clear Subjects in the Learn-RM group were used in order to obtain data
(the correlation between the movie rank and the acceptance rate about the decay of interest in movies as a function of the movie
rank (as explained in Section 3.2). The subjects in this group were
to their answer, were asked whether they would pay for watching it asked if they were willing to pay for a movie, but were not told its
(again). We obtained similar results to those presented in Section
3
4.3, regarding peoples preference to movies that they have already We used random pricing since we didn’t find correlation between
seen. However, we do not include these results, since they may Amazon’s movie price and features such as popularity of the movie
have been contaminated by the framing effect. in IMDB, release year, parental rating and country production.Figure 4: Average revenue for system (in dollars)
Figure 3: An example of PUMA’s selection process
Table 5: Demographic stats. for the revenue maximizing setting Table 7: the fraction of subjects who wanted to pay for a movie,
average revenue and overall satisfaction.
treatment number of fraction of average
group subjects females age treatment want to average overall
Rec-RM 31 41.9% 32.1 group buy revenue satisfaction
PUMA-RM 28 67.8% 29.7 Rec-RM 39.1% $1.33 4.13
Learn-RM 30 40.0% 33.9 PUMA-RM 37.1% $1.71 4.04
Learn-RM 56% – 4.03
price ("Would you pay to watch it?"). Table 5 presents some demo-
graphic statistics on the subjects in these three treatment groups. which 64.6% of the movies were either priced at $2.99 or $4.99.
In the movie rank learning phase, we set k0 = 5, i.e., recom- Figure 3 demonstrates the selection process performed by PUMA
mendations were in the group {1, 6, 11, 16, 21, 26, 31, 36, 41, 46}. for a specific user. After calculating the expected revenue using the
Once again, this is because k0 · n = |F | · n (even if the movie rank- human model, PUMA selects movies #1, #3, #4, #5, #7, #9,
ing has minor impact on the probability that the user will watch the #12, #13, #15 and #21, which yield the highest expected profit.
movie, and therefore PUMA would stick to a certain price; still, on In this example, when comparing PUMA’s recommendation’s ex-
average, it is not likely that PUMA will provide movies which ex- pected revenue to the expected revenue from the first 10 movies
ceed rank |F |·n, and therefore no data is needed on those high rank- (which would have been selected by the original recommender sys-
ings). The coefficient of determination value using the log function tem), the expected revenue increases from $1.34 to $1.52 (13%).
on the learning data was 0.60, as can be seen in Table 6.
The specific human model obtained, which was used by PUMA 4.3 Subject-Preference for Movies that Have
(in the revenue maximizing settings), is: Been Watched Before
r(m) We discovered that in all three groups in the revenue maximiz-
p(m|r(m), f (m)) = 0.82 − 0.05 · ln( ) − 0.31 · ln(f (m)) ing setting, many subjects were willing to pay for movies that they
6
have already watched before. As we discussed in the related work
As can be seen in Figure 4, PUMA significantly (p < 0.05 using section, marketing literature deals both with the variety effect (buy-
student t-test) outperformed Rec-RM, yielding an average revenue ers who want to enrich their experiences) and with loyalty (or the
of $1.71, as opposed to only $1.33 obtained by Rec-RM. No signif- mere-exposure effect). However, movies are considered to be a
icance was obtained when testing the overall satisfaction level from prominent example of a variety product, in which customers want
the list: 4.13 vs. 4.04 in favor of the Rec-RM group. However, to have new experiences, and therefore this result is surprising.
more data could probably give a statistically significant difference. Furthermore, subjects were willing to pay for movies that they
Our best estimate for this loss would be about 2.2%. While the have already watched more often than movies which were new
average movie price was also similar in both groups, with an aver- to them (although only in the Learn-RM group, where no price
age movie price of $5.18 for Rec-RM and an average movie price was present, these differences reached statistical significance with
of $5.27 for PUMA-RM, the standard deviation was quite differ- p < 0.001 using Fisher’s exact test). Similar behavior was also ob-
ent: 2.84 for the Rec-RM group, and only 1.95 for PUMA-RM, in served in the hidden agenda setting, where the subjects in all three
groups were simply asked if they would like to watch each movie
(and neither the word ’buy’ nor a price was present). In the hidden
Table 6: Coefficient of determination for the functions tested agenda settings the subjects significantly (p < 0.001) preferred
for the revenue maximizing setting. watching a movie again to watching a movie that was new to them.
We therefore set out to test whether this behavior will reoccur when
function R2
the movies are cheap and have a fee of $0.99, $1.99 or $2.99 - the
linear 0.43
Cheap group (see demographic details in Table 8).
exponent 0.39
This pattern was indeed repeated in the cheap group when prices
log 0.60
were mentioned and with statistical significance (p < 0.001 using
power 0.54
Fisher’s exact test). Figure 5 compares the fraction of subjects whoTable 8: Demographic statistics on the Cheap treatment group Table 10: Demographic statistics on the Choose-3 group
treatment number of fraction of average treatment number of fraction of average
group subjects females age group subjects females age
Cheap 35 34.3% 29.3 Choose-3 30 60.0% 33.1
movies have already been watched by the subjects.)
All these findings may be very relevant to designers of recom-
mender systems for movies. Today, most systems take great care
not to recommend movies that the user has already seen, while in-
stead perhaps one should try to recommend movies that the user
has both seen and liked.
5. DISCUSSION AND FUTURE WORK
One may be concerned about PUMA’s performance in the long
run, when it is required to interact with the same person many
times. Although this hasn’t been explicitly tested, we believe that
Figure 5: Comparison between the fraction of subjects who PUMA’s advantage over the recommendation system will not de-
wanted to watch/pay for movies they have already seen and grade; as the overall satisfaction from PUMA’s recommendations
movies that were new to them. and the average movie fee for PUMA’s recommendations (in the
revenue maximization setting) are both very close to that of the
original recommender system. An interesting property of PUMA
chose to pay or watch a movie that they hadn’t watched before to is that it allows online learning, as it may collect additional statis-
those who chose to pay or watch a movie that they had watched tics on-the-fly and use it to refine its human model. In the revenue
before (see Table 9 for the exact values). We term this phenomenon maximization setting, there is a clear conflict between the business
the WAnt To See Again (WATSA) phenomenon. On average 53.8% and the user: recommending movies that the advertiser prefers (ex-
of the movies recommended were already seen in the past by the pensive ones) is bound to reduce the probability that suggestions
subjects. One should not be concerned about the differences in the are accepted. In the hidden agenda setting, all movies are a-priori
column heights in Figure 5 across the different treatment groups as, the same for the user, and hence the only loss in showing a recom-
obviously, more subjects wanted to watch the movies for free (in mendation that the business likes to promote is that it’s lower on the
the hidden agenda), where no specific price was mentioned (Learn- user’s list. Due to this, there is an even greater gain in changing the
RM), and when the movies were cheap than when the movies were list of recommendations, and we see a larger gap between PUMA
more expensive (Rec-RM and PUMA-RM). and the recommendation engine in the hidden agenda setting.
In practice, when a recommender system is present, many times The WATSA phenomenon is heavily linked to the mere-exposure
the users are instructed to simply choose a (fixed size) set of movies effect [26]. It is well known that people prefer to consume products
which they would like to watch. We therefore conducted an addi- from brands they know, or to consume the same product several
tional treatment group (Choose-3) in which the original experimen- times [3]. However, seeing this phenomenon in movies is surpris-
tal settings were slightly modified. In this treatment group the sub- ing. Movies are often believed to be novelty driven, and watching
jects were instructed to choose the movies which they would like the same movie more than once may eliminate many properties
to watch ("Assume you are entitled to watch three of the recom- upon which movie enjoyment relies heavily (such as the element of
mended movies listed below, which movies would you choose?"). surprise, punch lines etc.). We assume that WATSA is also linked
Please refer to Table 8 for demographic details on the choose-3 to risk aversion, in which people prefer to watch or even pay for
treatment group. movies that they have seen in the past since they have already en-
As we hypothesized, in the choose-3 treatment group, subjects joyed them and are therefore less likely to regret watching them
were significantly (p < 0.001) more likely to select movies which again. This may be a result of people not fully trusting the movie
they have already seen in the past more than movies which were recommender system. A different reason might be that people truly
new to them. While only 8.4% of the movies which were new to enjoy watching movies that they have seen in the past, more than
the subjects were chosen - 45.0% of the movies that have already new movies. This might be due to the fact that most people watch
been watched were chosen by the subjects. (In total, 59% of the movies that they expect to enjoy, and therefore people are more
likely to enjoy movies that they have already seen. An interesting
future experiment would be to have subjects watch a set of movies
Table 9: The fraction of subjects who wanted to watch/pay for returned by a recommender system. Upon completion, the subjects
movies they had already seen and movies that were new to them would be asked how much they enjoyed each movie and then to
compare the average enjoyment from already seen movies to new
treatment group seen movies new movies delta
movies. Such an experiment will reveal whether people’s prefer-
Rec-HA 92.2% 55.4% 36.8%
ence for watching movies that they have already seen is not justified
PUMA-HA 94.7% 53.7% 41,0%
and may only be superfluous risk aversion, or a true preference that
Learn-HA 91.1% 47.2% 43.9%
is linked to people’s enjoyment from watching movies that have
Rec-RM 39.1% 36.6% 2.5%
already been seen. Further research is also required here in order
PUMA-RM 39.5% 33.3% 6.2%
to see if there is a difference between movies which were seen re-
Learn-RM 70.1% 42.5% 27.6%
cently and ones which were seen a long time ago, how many times
Cheap 49.8% 28.5% 21.3%
a user is likely to want to watch a movie, whether there is a de-pendency on the genre, culture, etc. It is also very likely that the [6] F. Gönül and K. Srinivasan. Modeling multiple sources of
WATSA phenomenon is a unique property of personalized recom- heterogeneity in multinomial logit models: Methodological
mender systems, which supply good recommendations. We leave and managerial issues. Marketing Science, 12(3):213–229,
all these question for future work. 1993.
An interesting property of the WATSA phenomenon may be im- [7] John R Hauser and Julian Marewski Dzyabura.
plied from Table 9: the cheaper the movies are, the greater the Consideration-set heuristics. Journal of Business
WATSA phenomenon. When the prices are the highest (in the Rec- Research,(forthcoming), 2010.
RM and PUMA-RM groups), the difference between the fraction of [8] J. Heckman. Heterogeneity and state dependence. In Studies
subjects willing to pay for movies that they have seen and the frac- in labor markets, pages 91–140. University of Chicago
tion of subjects willing to pay for new movies is only 2.5%−6.2%. Press, 1981.
When the movies are cheap, this difference leaps to 21.3%, when [9] K. Hosanagar, R. Krishnan, and L. Ma. Recomended for you:
no price is mentioned it reaches 27.6%, and when the subjects are The impact of profit incentives on the relevance of online
just asked whether they would like to watch the movies, this differ- recommendations. 2008.
ence shoots up to 36.8%−43.9%! Such behavior may be explained [10] W. A. Kamakura and G. J. Russell. A probabilistic choice
by the fact that people might be willing to pay large amounts only model for market segmentation and elasticity structure.
for new movies that they are sure that they would enjoy, and they Journal of Marketing Research, pages 379–390, 1989.
are willing to pay small amounts for movies that they have en-
[11] Yehuda Koren, Robert Bell, and Chris Volinsky. Matrix
joyed in the past as they see it as a risk-less investment. How-
factorization techniques for recommender systems.
ever, when testing the prices within the Rec-RM, PUMA-RM and
Computer, 42(8):30–37, 2009.
Cheap groups, the WATSA phenomenon clearly increased as the
prices decreased only in the PUMA-RM group. In the other two [12] James M Lattin. A model of balanced choice behavior.
groups (Rec-RM and Cheap), the WATSA phenomenon remained Marketing Science, 6(1):48–65, 1987.
quite steady among the different price groups. This may imply that [13] Andrew Lewis. If you are not paying for it, you’re not the
the average cost has greater impact on the WATSA phenomenon customer; you’re the product being sold. Metafilter, 2010.
than the specific price of each movie. Therefore this property still [14] Greg Linden, Brent Smith, and Jeremy York. Amazon. com
requires additional study. recommendations: Item-to-item collaborative filtering.
Internet Computing, IEEE, 7(1):76–80, 2003.
[15] Leigh McAlister and Edgar Pessemier. Variety seeking
6. CONCLUSIONS behavior: An interdisciplinary review. Journal of Consumer
In this paper we introduce PUMA, an algorithm which mounts a research, pages 311–322, 1982.
given black-boxed movie recommender system and selects movies [16] N. V. Moshkin and R. Shachar. The asymmetric information
which it expects will maximize the system’s revenue. PUMA builds model of state dependence. Marketing Science,
a human model which tries to predict the probability that a user 21(4):435–454, 2002.
will pay for a movie, given its price (if applicable) and its rank in
[17] Bhavik Pathak, Robert Garfinkel, Ram D Gopal, Rajkumar
the original recommender system. We consider two different en-
Venkatesan, and Fang Yin. Empirical analysis of the impact
vironments, one in which the movies are associates with different
of recommender systems on sales. Journal of Management
prices and the other in which no prices are present. We demon-
Information Systems, 27(2):159–188, 2010.
strate PUMA’s high performance empirically, using an experimen-
tal study. [18] Daniel Read. Monetary incentives, what are they good for?
Another important contribution of the paper is the uncovering Journal of Economic Methodology, 12(2):265–276, 2005.
of a phenomenon in which people prefer watching and even pay- [19] F. Ricci, L. Rokach, B. Shapira, and P.B. Kantor, editors.
ing for movies which they have already seen (when suggested by Recommender Systems Handbook. Springer, 2011.
a recommender system) to movies which are new to them. This [20] Peter E Rossi, Robert E McCulloch, and Greg M Allenby.
phenomenon was tested and found statistically significant in an ex- The value of purchase history data in target marketing.
tensive experimental study as well. Marketing Science, 15(4):321–340, 1996.
[21] C. A. Russell and S. J. Levy. The temporal and focal
7. REFERENCES dynamics of volitional reconsumption: A phenomenological
investigation of repeated hedonic experiences. Journal of
[1] A. Azaria, Z. Rabinovich, S. Kraus, C. V. Goldman, and Consumer Research, 39(2):341–359, 2012.
Y. Gal. Strategic advice provision in repeated human-agent [22] J Ben Schafer, Joseph Konstan, and John Riedi.
interactions. In AAAI, 2012.
Recommender systems in e-commerce. In Proceedings of the
[2] L. Backstrom and J. Leskovec. Supervised random walks: 1st ACM conference on Electronic commerce, pages
predicting and recommending links in social networks. In 158–166. ACM, 1999.
Proceedings of the fourth ACM international conference on
[23] Guy Shani, David Heckerman, and Ronen I. Brafman. An
Web search and data mining, pages 635–644. ACM, 2011. MDP-based recommender system. J. Mach. Learn. Res.,
[3] Robert F Bornstein, Paul R D’Agostino, et al. Stimulus 6:1265–1295, 2005.
recognition and the mere exposure effect. Journal of [24] W. Shih, S. Kaufman, and D. Spinola. Netflix. Harvard
personality and social psychology, 63:545–545, 1992.
Business School Case, 9:607–138, 2007.
[4] LS. Chen, FH. Hsu, MC. Chen, and YC. Hsu. Developing
[25] A. Tversky and D. Kahneman. The framing of decisions and
recommender systems with the consideration of product
the psychology of choice. Science, 211(4481):453–458,
profitability for sellers. Information Sciences,
1981.
178(4):1032–1048, 2008.
[26] Robert B Zajonc. Attitudinal effects of mere exposure. 1.
[5] A. Das, C. Mathieu, and D. Ricketts. Maximizing profit Pers. Soc. Psycho, 9(2 pt 2), 1968.
using recommender systems. ArXiv e-prints, August 2009.You can also read