PROJECTED DEATHS OF DESPAIR - from COVID-19 - Well Being Trust
←
→
Page content transcription
If your browser does not render page correctly, please read the page content below

PROJECTED
DEATHS OF
DESPAIR
from COVID-19

03

AUTHORS                                                                               EXECUTIVE SUMMARY

                                                                                      More Americans could lose their lives to deaths of despair,
                                                                                      deaths due to drug, alcohol, and suicide, if we do not do something
                                                                                      immediately. Deaths of despair have been on the rise for the last
                                                                                      decade, and in the context of COVID-19, deaths of despair should
                                                                                      be seen as the epidemic within the pandemic. The goal of this
                                                                                      report is to predict what deaths of despair we might see based
                                                                                      on three assumptions during COVID-19: economic recovery,
                                                                                      relationship between deaths of despair and unemployment, and
                                                                                      geography. Across nine different scenarios, additional deaths of
                                                                                      despair range from 27,644 (quick recovery, smallest impact of
                                                                                      unemployment on deaths of despair) to 154,037 (slow recovery,
                                                                                      greatest impact of unemployment on deaths of despair), with
                                                                                      somewhere in the middle being around 68,000. However, these
                                                                                      data are predictions. We can prevent these deaths by taking
Stephen Petterson, PhD                                                                meaningful and comprehensive action as a nation.
Robert Graham Center
American Academy of Family Physicians

John M. Westfall, MD, MPH
Robert Graham Center
American Academy of Family Physicians

Benjamin F. Miller, PsyD
Well Being Trust

Suggested Citation: Petterson, Steve et al. “Projected Deaths of Despair During the
Coronavirus Recession,” Well Being Trust. May 8, 2020. WellBeingTrust.org.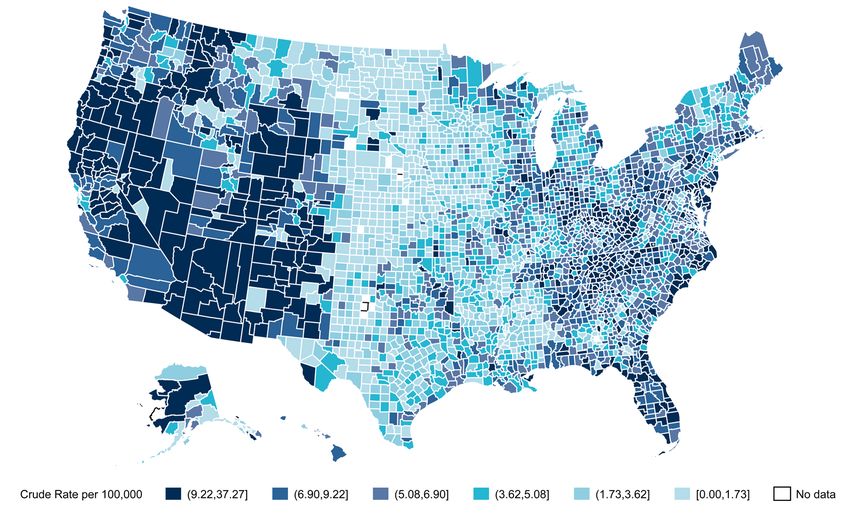
04   Projected Deaths of Despair from COVID-19                                                                                                                         05

          SARS CoV-2 (COVID-19) is having an
          unprecedented impact on the world.
          No one alive can recall any infection         VIRTUAL COMMUNITY MAY NOT BE ENOUGH TO HOLD OFF
                                                        THE IMPACT OF ISOLATION AND LONELINESS.
          or worldwide event of such magnitude
          and scale. Along with the tens of thousands
          of deaths in the United States from the       The collective impact of COVID-19 could be devastating. Three factors, already at work,
                                                        include economic failure with massive unemployment, mandated social isolation for months
                                                        and possible residual isolation for years, and uncertainty caused by the sudden emergence of a
          virus, COVID-19 overlays the growing          novel, previously unknown microbe. The economics of COVID-19 have already caused a massive
                                                        jump in unemployment: job loss leading to personal and professional economic loss across all
                                                        business sectors. Hourly workers as well as salaried professionals have been laid off and furloughed
          epidemic of deaths of despair threatening     indefinitely. Isolation, whether called social isolation or physical distancing is leading to loss of social
                                                        connection and cohesion. No groups over 10, no cinema (a mainstay of the Great Depression), no

          to make an already significant problem        sports, no clubs or social organizations, no church services. Virtual community may not be enough
                                                        to hold off the impact of isolation and loneliness. And finally, uncertainty. The stress of uncertainty
                                                        has a serious impact on the emergence and worsening of mental illness (Wu et al, 2020; Grupe and

          even worse (Case and Deaton, 2017).           Nitschke. 2013). This is a novel virus with new and unanticipated results. Every day scientists sheds
                                                        light on new aspects and retracts initial ideas and hypotheses. These are unprecedented times, and
                                                        uncertainty may lead to fear which may give way to dread.
          A preventable surge of avoidable deaths       We model the economic impact on mental health and deaths of despair based on similar
                                                        situations in the past. Deaths of despair are defined as deaths to drug, alcohol, and suicide,
          from drugs, alcohol, and suicide is ahead     and often associated with socioeconomic factors. Unemployment during the Great Recession
                                                        (December 2007–June 2009) was associated with an increase in suicide deaths and drug
                                                        overdose deaths. Our methods allow us to quantify the impact on suicide and drug overdose
          of us if the country does not begin to        based on historical and scientific research. We can only estimate the impact of social isolation
                                                        based on the impact of social isolation among smaller groups and individuals. The magnitude and

          invest in solutions that can help heal the    scale of social isolation in COVID-19 is unprecedented, so the impact on mental health and illness
                                                        is a prediction. And last, the uncertainty is, as described, uncertain. Scientific literature has reported
                                                        on the negative impact of uncertainty on individuals and small groups. Given the uncertainty
          nation’s isolation, pain, and suffering       inherent in COVID-19 with incomplete science, emerging political ramifications, and no set
                                                        timeline for stabilization, the impact on mental health cannot be fully calculated. We can only try
                                                        and provide as much certainty as possible during uncertain times. We can try and make certain
          (Well Being Trust, 2020).                     our relationships remain true and constant, regardless of the uncertain facts and figures of the day.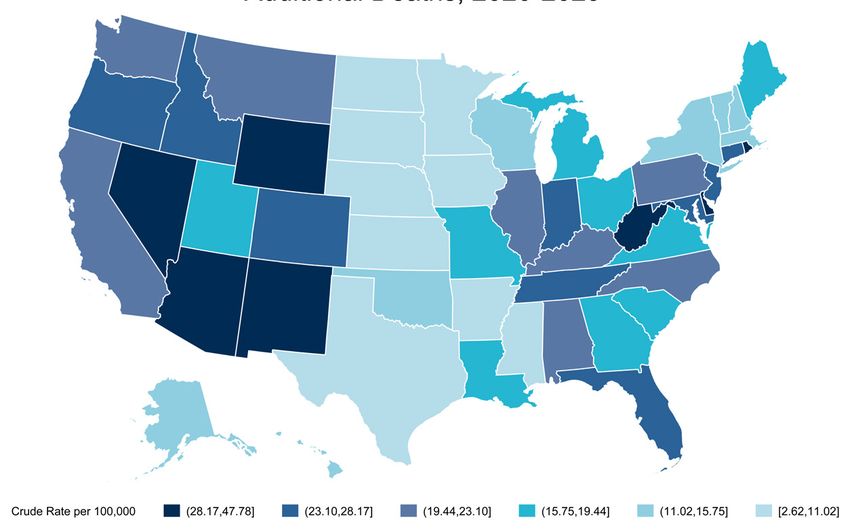
06   Projected Deaths of Despair from COVID-19                                                                                                                                                              07

HOW MUCH IMPACT WILL COVID-19                                                                  To model the possible effects of the recession on deaths of despair, the
                                                                                               experience of the Great Recession was used as a baseline. During this recession,
HAVE ON DEATHS OF DESPAIR?                                                                     unemployment went from 4.6% in 2007 to a peak of 10% in October 2009 and
                                                                                               declined steadily reaching 3.5% in early 2010. This baseline for our analysis relies
                                                                                               on the April 24, 2020 Congressional Budget Office’s (CBO) projection of 15-16%
                                                                                               unemployment in Q3 2020 and an annual rate of 10% in 2021. For this projection
            Given the extraordinary uncertainty surrounding the pandemic and its effect        of the COVID-19 recession, a peak unemployment rate of 15% in Q3 2020 is
                                                                                               assumed and we modeled three possible recoveries either following (1) the same
            on the economy, any projection is imprecise. The goal is to offer a range in the   pattern, b) twice as fast, or c) four times as fast as the Great Recession (see charts
            number of additional deaths of despair over the next decade attributable to the    on page 6). A quicker recovery implies, of course, fewer additional deaths.
            rise in unemployment, isolation, and uncertainty. The analysis builds on three
            sets of assumptions regarding (a) the economy, (b) the relationship between        Unemployment and Deaths of Despair
            deaths of despair and unemployment, and (c) the geographic variation of the
                                                                                               The original concept of deaths of despair (Case and Deaton, 2020) was meant to
            impact. Each will be discussed briefly.                                            understand the rising mortality among less educated middle age non-Hispanic
                                                                                               whites. Their argument was that despair was a product of the long-term social
                                                                                               and economic decline. Rising joblessness and lower incomes were part of the
            The Coronavirus Recession                                                          story. So was the reality, for many whites, their fate may well be worse than that
                                                                                               of their parents. The particulars of the recent rise of deaths of despair do not
            The current spike in job loss is unlike anything
                                                                                               lead to simple predictions of the short-term effects of rising unemployment.
            seen since the Great Depression of the last
                                                                                               The literature suggests that the short-run effect is cause specific and may
            century. From March 15 to April 30, 2020,
                                                                                               vary across different populations. There is a relatively large body of literature
            30 million individuals have applied for jobless
                                                                                               examining the association between unemployment and all-cause mortality,
            benefits; almost one-fifth of the workforce.
                                                                                               as well as specific types of deaths. Work focused on suicides is the most                RECENT STUDIES
            This is comparable to what occurred after
                                                                                               established, showing that a one point increase in unemployment rates                     FOUND
            natural disasters such as in New Orleans after
                                                                                               increases suicide rates by about 1 to 1.3% (Luo et al, 2011). This impact is shown
                                                                                                                                                                                        1 point
            hurricane Katrina. What happened to one city
                                                                                               to vary substantially with lower rates in countries with protective labor market
            is happening to the globe. At present, while

                                                                                                                                                                                        increase
                                                                                               policies (Norström and Grönqvist, 2015; Stuckler, et al, 2011; Reeves et al. 2012).
            there is growing talk about the gradual easing
                                                                                               Another study estimates that in the Great Recession a one point increase in
            of stay-at-home orders, there is also concern
                                                                                               unemployment increased suicides by 1.6% (Phillips and Nugent, 2014).
            about the resurgence of infections in the fall                                                                                                                              in unemployment rates
            2020, the availability of effective testing, and                                   It’s important to note that the underlying causes that drive “deaths of despair” for     increases suicide rates by
            the time necessary to develop of a vaccine.                                        all in America are multifaceted. They include social and individual-level factors        about 1 – 1.6%
                                                                                               such as isolation and loneliness; systemic issues such as a fractured health
            Experts are expressing strong warnings
                                                                                               care system and lack of culturally and linguistically competent care; and finally
            against decisions by some states to reopen
                                                                                               community conditions such as systemic racism and structural inequalities in
            the economy. There is considerable
                                                                                               education, income, transportation and housing. These are further undergirded
            uncertainty about both the short- and long-
                                                                                               by a consistent lack of economic opportunity, stigma, and a combination of
            term impact, reflecting in part the uncertainty
                                                                                               opportunity-limiting cultural and environmental factors in communities. Sadly,
            regarding the spread of COVID-19 across
                                                                                               these factors impact some communities more than others in significant and
            the country over time. Optimistic forecasts
                                                                                               consequential ways, especially racial and ethnic minority populations, people
            anticipate that U.S. unemployment will
                                                                                               who are lower-income, or people who live in rural areas. Without attention to
            peak around 15% and that the economy
                                                                                               these issues, our nation will continue to drive an increase in health disparities.
            will recover quickly. Pessimistic forecasts
            anticipate a far higher peak (25-30%) and a                                        And we are seeing many of these disparities play out in real time during
            slower recovery.                                                                   COVID-19. Communities of color, specifically black America, are already dying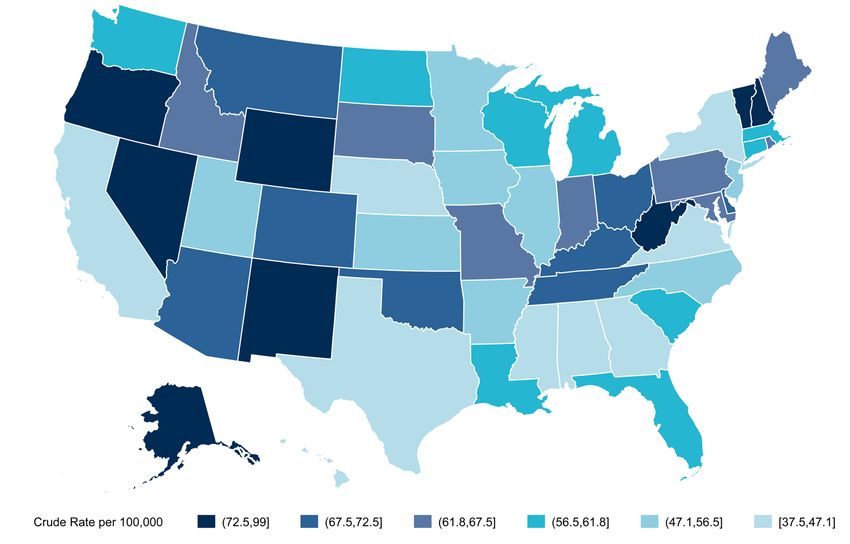
08    Projected Deaths of Despair from COVID-19

at higher rates due to the COVID-19 virus. Many have argued that this
highlights the entrenched structural conditions that drive some communities
to have more disparities than others. Unemployment is both a national and
local community issue. We recognize that communities of color are most
negatively impacted by financial stress and unemployment, and policy
solutions will need to address the inequitable burden of unemployment
across communities with particular attention to communities of color.

There are fewer studies that examine the association between                    2018 NATIONWIDE
unemployment on drug and alcohol deaths. A recent study (Hollingsworth
et al, 2017) found that a 1 point increase in unemployment increased drug-      DEATHS OF DESPAIR
related deaths by 3.3% (and 3.9% for opioid related deaths). Various studies    Data: CDC Wonder
show an association between joblessness and alcohol consumption (Booth
and Feng, 2002; Mustard et al, 2013; Parsons and Barger, 2019; Browning
and Heinesen, 2012), but the results are mixed. While overall alcohol
consumption actually declined during the Great Recession (Cotti et al, 2012),
                                                                                181,686
                                                                                Deaths
binge drinking increased (Bor et al., 2013).

To account for the potential additive impact of isolation and uncertainty on
deaths of despair, we calculate a range of increase using 1.0%, 1.3% or 1.6%    327,167,434
increase in deaths of despair for each point increase in the unemployment       Population
rate. The higher the multiplier the higher the number of deaths of despair.

                                                                                55.5
State and County Variation                                                      Rate per 100,000

In addition to estimates for the nation as a whole, we also present the
state- and county-level estimates. These sub-national results should be
interpreted cautiously given that there will be considerable variation across
states. Early data on jobless claims show, for instance, that states most
reliant on tourism (such as Hawaii) and states with high infection rates
were initally the hardest hit. However, over time, it is almost certain the
recession will be national in scope given the expected drop in consumer
demand across all sectors. Likewise, there is every indication that the
virus will spread widely over time. Another concern with state and
county projections is that the available estimates of the effect of rising
unemployment is the same across the nation. This is probably not the
case given that some states and communities are better able to address
the impact of economic downturns. Policies related to labor markets,
unemployment compensation and mental health treatment vary widely.
Also, there is considerable variation in economic and social factors that
may buffer individuals from adversity. Baseline community connection and
the ability to stay socially connected while physically distant should have
a positive impact leading to fewer deaths of despair. To the extent that our
projections are based on “baseline” levels of deaths of despair, some of this
variation will be reflected in our estimates.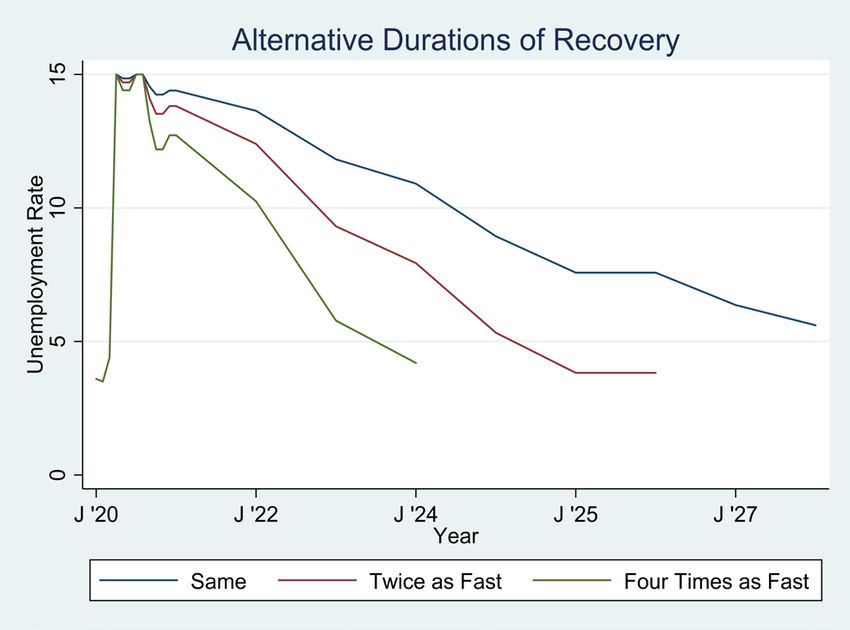
010   Projected Deaths of Despair from COVID-19                                                                                                                                                                                          011

                                                                                                               ESTIMATED RATES OF DEATHS OF DESPAIR ACROSS STATES, 2018

NATIONAL DEATHS OF DESPAIR

            Baseline Rates of Deaths of Despair
            Publicly available cause of death data was obtained from Centers for Disease Control Wonder,
            (https://wonder.cdc.gov/ucd-icd10.html). The classification used by the United States Joint
            Economic Committee (2019) to identify suicides and alcohol- and drug-related deaths. (see
            Appendix). In 2018, there were 181,686 deaths of despair—55 per 100,000—with considerable
            variation between subgroups and type of death. Overall deaths of despair are most common
            among 55-64 year-olds, non-Hispanics, and American Indians or Alaskan Natives. Across ages,
            deaths of despair rise steadily to ages 55-64 (104.7 per 100,000) and then decline. This is due
            mainly to the rise and decline in alcohol-related deaths. Drug-related deaths are most common
            among 35-44 year-olds and suicide rates are relatively constant across ages. The pronounced
            differences in mortality across gender and Hispanic origin holds across the three types of death
            of despair. The high rate of deaths among American Indians or Alaskan Natives are mainly
            attributable to high rates of alcohol-related deaths. Suicide rates of African Americans are
            substantially lower than those of Whites, while Whites and African Americans have comparable
            drug-related death rates.

            There is also considerable variation in deaths of despair across states, ranging from 37.5 per
            100,000 in Mississippi to 99.0 per 100,000 in New Mexico (See below Figure, also Appendix).        National Estimates of Additional Deaths of Despair
                                                                                                               We combined information about a) 2018 baseline deaths of despair (n=181,686) projected levels of unemployment
             Demographic Variation in Rates of Deaths of Despair, 2018                                         from 2020 to 2029 and c) we estimate the annual number of deaths based on the three selected multipliers and
                                                                   RATES PER 100,000                           three recovery rate estimates. Across the nine different scenarios, the additional deaths of despair range from 27,644
                                                          All       Alcohol        Drug             Suicides   (quick recovery, smallest impact of unemployment on deaths of despair) to 154,037 (slow recovery, greatest impact of
             Age                                                                                               unemployment on deaths of despair). If recovery is four times as fast as that of the Great Recession, additional deaths
              15-24 years                               25.9             2.0         10.7               14.5   will accumulate over four years compared to 10 years if recovery is the same as that of the Great Recession. When
              25-34 years                               59.0           10.3         36.4                17.6   considering the negative impact of isolation and uncertainty the 1.6% multiplier may be more accurate.
              35-44 years                                71.5          20.2         40.0                18.2
              45-54 years                               89.6           39.1         38.3                20.1
                                                                                                                Table. Possible Additional Deaths of COVID-19 Recession on Deaths of Despair, Alternative Scenarios
              55-64 years                              104.7           58.9         32.2                20.2
              65-74 years                               70.7           44.7          11.6               16.4                          Percent Change in Mortality with One Point Increase in Unemployment
              75-84 years                               49.8           27.0           4.5               18.8                         1% increase                        1.3% increase                      1.6% increase
              85+ years                                 38.1           14.5           4.6               19.1                   Slow Medium          Fast            Slow Medium          Fast          Slow Medium          Fast
             Gender                                                                                             2020          9,859       9,333   8,343           12,817     12,133 10,846           15,774    14,932    13,349
              Female                                    29.3            11.2         13.7                6.4    2021        18,347       16,103  12,209           23,851 20,934       15,871        29,355     25,765    19,534
              Male                                      82.6           34.3         30.5                23.5    2022         15,879      11,840   5,832          20,642     15,392     7,581        25,406     18,944     9,331
             Hispanic Origin                                                                                    2023         13,410       8,025    1,261          17,434    10,433     1,639        21,457     12,841     2,017
              Hispanic or Latino                        31.2           14.6          11.8                7.2    2024        10,394        3,973        -          13,512      5,164         -       16,630       6,356         -
              Not Hispanic or Latino                    60.6           24.2         24.1                16.4    2025           7,651        870        -           9,947       1,131        -       12,242       1,392         -
             Race                                                                                               2026          7,103         316        -           9,234         411        -        11,365        506         -
              American Indian or Alaska Native          77.5           48.9         19.6                14.1    2027          5,732           -        -           7,451           -        -          9,171         -         -
              Asian or Pacific Islander                 15.2             4.4          4.1                7.2    2028          4,086           -        -           5,312           -        -         6,538          -         -
              Black or African American                 44.6           18.0         24.4                 7.0    2029          3,812           -        -           4,956           -        -        6,099           -         -
              White                                     60.5           24.5          23.1               16.9    Total       96,273 50,460 27,644                125,155 65,598        35,937       154,037 80,735 44,230
                                                                                                                Types of Recovery: Slow—Same as Great Recession; Medium—Twice as Fast; Fast—Four Times as fast.
            Source: CDC Multiple Causes of Death, 1999-2018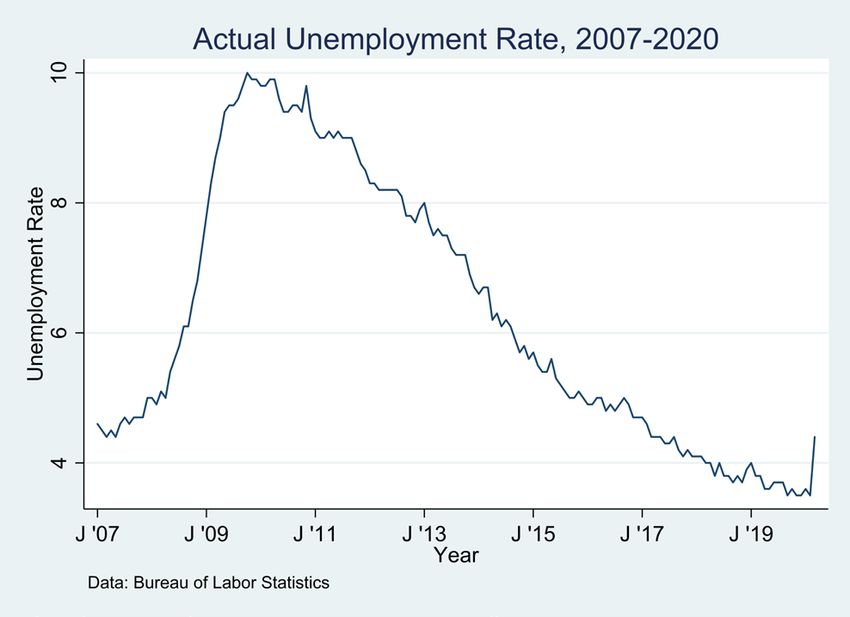
012   Projected Deaths of Despair from COVID-19                                                                                                                                                                                 013

STATE AND COUNTY DEATHS OF DESPAIR                                                                                        COUNTY DEATHS OF DESPAIR
            To obtain state- and county-level estimates, we                                                                   A similar approach was used at the county-level. That is, using U.S. Bureau of Labor Statistics
                                                                     Calculation of Excess Unemployment
            again used the Great Recession as a reference                                                                     county unemployment data from 2007 to 2018, we first calculated the 2008-2018 excess
                                                                     in Alabama, 2008-2018
            point. However, because of the heterogeneity                                                                      unemployment for each county. Then, we determined each county’s share of the national
                                                                                                        Unemployed
            in the experience of states and counties during                           Number                                  excess unemployment. We then calculated unadjusted and adjusted deaths based on the
                                                                     Year                             - Unemployed
            the recession, we first estimated the relative                         Unemployed                                 middle scenario. Because of the suppression of data for counties with fewer than 10 deaths in
                                                                                                              (2007)
            impact of the recession in states and counties by        2007                 86,483                   -          publicly available CDC mortality data, we could not calculate the number of deaths of despair
            determining the annual excess unemployment               2008                123,012             36,529           for about 400 counties. For these counties, mortality rates were imputed using information from
            from 2008 to 2018 relative to unemployment               2009                238,254             151,771          adjacent counties. The map below show rates for the middle scenario.
            in 2007. For example, in Alabama there were              2010                231,492           145,009
            86,483 persons unemployed in 2007, this number           2011                212,258            125,775
            increased by 36,529 to 123,012 in 2008. Summing                                                                   ESTIMATED ADDITIONAL DEATHS OF DESPAIR, COUNTIES 2020-2029
                                                                     2012                173,051             86,568
            across years, the total excess unemployed was            2013                156,961             70,478
            771,970. Across all states, the 2008-2018 excess         2014                146,555             60,072
            unemployed was 39,360,814 (see Appendix).                2015                131,400             44,917
            Alabama’s share of this national total was 2.0%          2016                127,239             40,756
            (=771,970/39,360,814).                                   2017                 96,568             10,085
                                                                     2018                 86,493                  10
            Adjusted by baseline rates of deaths of despair,
                                                                     TOTAL                     -            771,970
            this percentage for each state was used to allocate
                                                                     Data: Bureau of Labor Statistics
            the projected national deaths of despair reported
            above. Specifically, the number of additional deaths is equal to the additional deaths multiplied by
            the state’s share of excess unemployment multiplied by the ratio of the state mortality rate and
            the national rate (and then recalibrated so the adjusted total for all states is equal to the projected
            national total). For instance, in the middle scenario (medium recovery, 1.3% impact, N=65,598) we
            estimated that the unadjusted additional deaths in Alabama would be 1,287 (=65,598*.02) and the
            adjusted rate is 1,066 (=1,287*(45.9/55.5)*(65,598/65,434). Finally, expressed on a per capita basis,
            in this scenario, Alabama would have an additional 21.8 deaths per 100,000. The map below shows
            varying rates of additional deaths across states.

            ESTIMATED ADDITIONAL DEATHS, 2020-2029

                                                                                             Note: The additional death
                                                                                             rates are based on middle
                                                                                             scenario (medium recover,
                                                                                             1.3% impact, N=65,598)
014 Projected Deaths of Despair from COVID-19 015
DISCUSSION
We used the quantifiable factors identified from prior economic downturns to To fully address the issues that surround deaths of despair, our policy solutions must
be comprehensive and attempt to tackle the social, economic, and health related
estimate the number of additional deaths of despair due to COVID-19 impact
factors all at once. This begins with a recognition of the complex interplay between
on unemployment, isolation, and uncertainty. We shifted our interpretation employment status and our overall health and well-being. With the profound
slightly as we predict social isolation will have an additional negative impact uncertainty surrounding our economy from COVID-19, it is not clear the full extent
on the lives of those suffering economic downturn. For the uncertainty, while unemployment may have on our nation as well as other nations. This brief is not
intended to offer up all the solutions to each of these complex problems, but rather
we predict it may have a negative impact, it is not included in our calculations draw attention to them so our government, at every level, can begin to realize the
and is intended to be used to encourage social connection in the face of connections. We offer a few examples of policies that may help stem the tide of
physical distancing, and for policies that mitigate the economic loss and deaths of despair in the time of COVID-19.
unemployment we are witnessing. Ideally, local communities and even states
GET PEOPLE WORKING:
can implement measures to mitigate isolation, creating local solutions for
their neighbors and friends. While high unemployment may be a national fact, Central to many of the problems in our communities will be the need to find
employment. The literature is clear that unemployment is a risk factor for suicide
social connection and the impact of uncertainty may be a local phenomenon, and drug overdose as well as a decrease in overall health status. To this end, policy
amenable to community and local policy solutions. As science sheds light solutions must focus on providing meaningful work to those who are unemployed.
on the novel COVID-19 virus, uncertainty may give rise to confidence and Service can be a powerful antidote to isolation and despair, and COVID-19 offers
new and unique opportunities to employ a new workforce – whether that be
rigorous education.
through contact tracing – helping local public health department track the virus
– or through community health services where a new corps of community
members are employed to provide help to those in the most need. Let us make
Policy solutions sure that we provide additional training to these front-line workers to assure that
This report is not a call to suddenly reopen the country. Some might use this report to argue that they are capable of also addressing issues of mental health and addiction as they
this is why our economy needs to open up fast. But that’s NOT what we are saying. We need to will likely encounter them as well. In fact, this work may be identifying mental
abide by good science, and make sure that testing and contact tracing is occurring at adequate health needs or connecting people to care when appropriate.
levels to assure that it is safe to open up. Even as of today parts of the country are opening, data
suggest that this is premature due to a lack of consistent testing, which allows local public health GET PEOPLE CONNECTED:
authorities to trace, treat, and isolate to prevent further spread. A range of efforts at containing the
The pandemic has created the greatest forced isolation in our modern history. We
COVID-19 pandemic must be rigorously applied to minimize deaths from infection. Policies that
are physically distant but must socially connect (Bergman et al, 2020). Communities
maintain infection control while addressing the mental health and addiction needs of the people
have created innovative solutions for connecting with their neighbors like singing (or
will balance the impact of COVID-19 across all sectors.
howling) from their balconies and porches. Faith communities are reinventing how
Deaths of despair were a problem before COVID-19, just as health disparities were also a problem their members can get together through online and virtual platforms; however, many
prior to COVID-19. What COVID-19 has done, is highlight yet again that the United States has not small organizations, civic clubs, and community groups do not have the resources
addressed underlying structural flaws in our systems. Issues of disparities are perpetuated by not to build robust virtual platforms. Many communities may not have the bandwidth or
addressing structural inequalities like employment, transportation, and income, making those at internet access to support video connections. Policies that support small non-profit
highest risk for losing their job or being exposed to COVID-19 communities who were already at a organizations, faith communities, and community solutions can provide opportunities
higher risk of a death of despair and now at even higher risk of dying to COVID-19. to get people connected to their neighbors (Felzien et al., 2018).016 Projected Deaths of Despair from COVID-19 017
GET MENTAL HEALTH INTEGRATED: The models we have created rely on the way things happened before — when our
communities were faced with rising unemployment, social isolation, and individual
We must immediately engage all COVID-19 response and recovery efforts in mental
uncertainty the people suffered, to increased deaths of despair. But things could
health screening and treatment. It is not just the job of mental health clinicians, or even
be different. By taking stock of the current crisis, predicting potential loss of life,
primary care, to find and treat all those suffering from the mental health impacts of
and creatively deploying local community solutions, it may be possible to prevent
unemployment, social isolation, and the fear of uncertainty. As we create teams to test,
impending deaths of despair. We should not sit idly by, waiting for more deaths of
track and trace COVID-19 infections, we must also test, track, trace, and treat patients
despair to occur but move aggressively towards solutions that bring mental health
suffering from mental health and substance use disorders.
into the center of all our discussions on COVID-19 response and recovery.
GET PEOPLE FACTS: For more information about what to do to address many of
Uncertainty leads to fear and fear may give way to dread. And dread negatively impacts the issues outline in this report, visit paininthenation.org and
our health and well-being. People need science and calm facts. This is not a time
healingthenation.wellbeingtrust.org to get specific policy and
for partisan positioning; it is a time, as President George Bush said recently, to stand
together while apart. Every leader offering a briefing on the topic should provide programmatic recommendations for advancing mental health and
informative leadership on the topic of mental health by describing its impact, ways addiction in this country, as one avenue to help decrease deaths of
people can get help, and what to expect from the pandemic. despair in our country.
OFFER A VISION FOR THE FUTURE:
COVID-19 opens up the door to offer a new vision for the future of health care in this
country. Mental health should be central to that vision. Care that is fragmented only
creates roadblocks for patients and families. Referrals, prior authorizations, and other
administrative barriers have historically led to frustration by all parties, including clinicians.
It is essential to bring mental health and addiction care into the fabric of a redesigned
vision of clinical care, as well as across community settings. This requires vision, alignment
with a framework, and a method for holding key stakeholders accountable for person-
centered outcomes (Well Being Trust, 2020).
Any policy plan brought forward that does not consider ways to better integrate mental
health and addiction services will likely have a much less significant impact.
GET PEOPLE CARE:
Care, especially primary and mental health care, has historically been fragmented.
Individuals have had to work harder to get the care they need, and often that care is not
delivered in a timely or evidence-based fashion. If COVID-19 has highlighted anything
about our current delivery system, it’s that asking people to come to a clinic or a hospital
is not always the best approach. Policies that support creative opportunities for care
delivered at home, virtually or in-person will provide comfort and safety. The idea of
a home visit or a house call is not new, and for professions like primary care, it can
be a major benefit for countless. The artificial walls we have created around who can
be seen where, by whom, and for what, have not been proven to work effectively for
mental health. Its time to consider policies that bring care to people as one avenue for
mitigating despair and providing help to those who need it most.018 Projected Deaths of Despair from COVID-19 019
APPENDIX
State-Level Estimates of Additional Deaths of Despair, 2020-2029
Excess Excess
Deaths of Despair, 2018 Unemployment, Additional Deaths, 2020-2029 Deaths of Despair, 2018 Unemployment, Additional Deaths, 2020-2029
2008-2018 2008-2018
Adjusted Adjusted
Rate per Economy Rate per Rate per Economy Rate per
Deaths Population Excess % for Baseline Deaths Population Excess % for Baseline
100,000 Only 100,000 100,000 Only 100,000
Mortality Mortality
Alabama 2,244 4,887,871 45.9 771,970 2.0 1,287 1,066 21.8 Nebraska 858 1,929,268 44.5 78,991 0.2 132 106 5.5
Alaska 625 737,438 84.8 37,398 0.1 62 95 12.9 Nevada 2,207 3,034,392 72.7 664,194 1.7 1,107 1,453 47.8
Arizona 5,056 7,171,646 70.5 1,217,848 3.1 2,030 2,583 35.9 New Hampshire 1,092 1,356,458 80.5 86,742 0.2 145 210 15.4
Arkansas 1,556 3,013,825 51.6 173,373 0.4 289 269 8.9 New Jersey 4,845 8,908,520 54.4 1,408,125 3.6 2,347 2,304 25.8
California 18,638 39,557,045 47.1 6,305,781 16.0 10,509 8,939 22.5 New Mexico 2,074 2,095,428 99.0 290,357 0.7 484 865 41.2
Colorado 4,128 5,695,564 72.5 659,595 1.7 1,099 1,438 25.2 New York 8,348 19,542,209 42.7 2,188,827 5.6 3,648 2,813 14.4
Connecticut 2,049 3,572,665 57.4 492,380 1.3 821 850 23.7 North Carolina 5,641 10,383,620 54.3 1,460,135 3.7 2,433 2,387 22.9
Delaware 693 967,171 71.7 131,289 0.3 219 283 29.2 North Dakota 449 760,077 59.1 11,242 0.0 19 20 2.6
District of Ohio 8,144 11,689,442 69.7 956,341 2.4 1,594 2,005 17.1
465 702,455 66.2 117,246 0.3 195 234 33.2
Columbia Oklahoma 2,792 3,943,079 70.8 217,250 0.6 362 463 11.7
Florida 12,916 21,299,325 60.6 3,297,058 8.4 5,495 6,015 28.2 Oregon 3,061 4,190,713 73.0 524,417 1.3 874 1,152 27.4
Georgia 4,528 10,519,475 43.0 1,528,193 3.9 2,547 1,979 18.8 Pennsylvania 8,045 12,807,060 62.8 1,469,952 3.7 2,450 2,778 21.6
Hawaii 571 1,420,491 40.2 145,816 0.4 243 176 12.4 Rhode Island 714 1,057,315 67.5 179,484 0.5 299 365 34.4
Idaho 1,125 1,754,208 64.1 237,893 0.6 396 459 26.1 South Carolina 3,038 5,084,127 59.8 544,280 1.4 907 978 19.2
Illinois 6,131 12,741,080 48.1 1,850,665 4.7 3,084 2,679 21.0 South Dakota 556 882,235 63.0 48,080 0.1 80 91 10.3
Indiana 4,211 6,691,878 62.9 824,588 2.1 1,374 1,561 23.3 Tennessee 4,664 6,770,010 68.9 810,319 2.1 1,350 1,680 24.7
Iowa 1,516 3,156,145 48.0 180,008 0.5 300 260 8.2 Texas 11,298 28,701,845 39.4 2,676,961 6.8 4,461 3,170 11.0
Kansas 1,546 2,911,505 53.1 166,672 0.4 278 266 9.1 Utah 1,759 3,161,105 55.6 357,659 0.9 596 599 18.9
Kentucky 3,082 4,468,402 69.0 439,223 1.1 732 911 20.3 Vermont 517 626,299 82.5 29,927 0.1 50 74 11.8
Louisiana 2,696 4,659,978 57.9 521,885 1.3 870 908 19.4 Virginia 3,715 8,517,685 43.6 1,032,174 2.6 1,720 1,354 15.9
Maine 903 1,338,404 67.5 116,348 0.3 194 236 17.6 Washington 4,654 7,535,591 61.8 903,177 2.3 1,505 1,678 22.2
Maryland 3,976 6,042,718 65.8 835,692 2.1 1,393 1,654 27.3 West Virginia 1,769 1,805,832 98.0 175,551 0.4 293 517 28.6
Massachusetts 4,170 6,902,149 60.4 596,109 1.5 993 1,084 15.7 Wisconsin 3,469 5,813,568 59.7 454,044 1.2 757 815 14.0
Michigan 5,978 9,995,915 59.8 882,539 2.2 1,471 1,588 15.8 Wyoming 477 577,737 82.6 73,119 0.2 122 182 31.4
Minnesota 2,908 5,611,179 51.8 311,848 0.8 520 486 8.6 Total 181,686 327,167,434 55.5 39,360,814 100 65,598 65,598 20.0
Mississippi 1,120 2,986,530 37.5 242,097 0.6 403 273 9.1
Note: Based on “middle” scenario (Peak unemployment of 15%, medium length recovery, 1.3% increase in deaths for each point
Missouri 3,926 6,126,452 64.1 535,650 1.4 893 1,033 16.8 increase in unemployment), assuming 65,598 deaths nationally. Excess unemployment is the cumulative sum of persons unemployed
from 2008-2018 in excess of 2017 count.
Montana 743 1,062,305 69.9 100,302 0.3 167 211 19.8020 Projected Deaths of Despair from COVID-19 021
REFERENCES
(IN ALPHABETICAL ORDER)
Bergman, David, Christina Bethell, Narangerel Gombojav, Sandra Hassink, and Kurt C. Stange. 2020. Norström, Thor, and Hans Grönqvist. 2015. “The Great Recession, Unemployment and Suicide.” Journal of
“Physical Distancing with Social Connectedness.” Forthcoming in Annals of Family Medicine. Epidemiology and Community Health 69 (2): 110–16. (https://doi.org/10.1136/jech-2014-204602).
Booth, Brenda M., and Weiwei Feng. 2002. “The Impact of Drinking and Drinking Consequences Parsons, Michelle Anne, and Steven D. Barger. 2019. “The US Mortality Crisis: An Examination of Non-
on Short-Term Employment Outcomes in at-Risk Drinkers in Six Southern States.” The Journal of Hispanic White Mortality and Morbidity in Yavapai County, Arizona.” Journal of Community Health 44 (4):
Behavioral Health Services & Research 29 (2): 157–66. 661–67.
Bor, Jacob, Sanjay Basu, Adam Coutts, Martin McKee, and David Stuckler. 2013. “Alcohol Use during Phillips, Julie A., and Colleen N. Nugent. 2014. “Suicide and the Great Recession of 2007-2009: The Role
the Great Recession of 2008–2009.” Alcohol and Alcoholism 48 (3): 343–348. of Economic Factors in the 50 U.S. States.” Social Science & Medicine (1982) 116 (September): 22–31.
Browning, Martin, and Eskil Heinesen. 2012. “Effect of Job Loss Due to Plant Closure on Mortality and Reeves, Aaron, David Stuckler, Martin McKee, David Gunnell, Shu-Sen Chang, and Sanjay Basu. 2012.
Hospitalization.” Journal of Health Economics 31 (4): 599–616. “Increase in State Suicide Rates in the USA during Economic Recession.” The Lancet 380 (9856): 1813–14.
Case, Anne, and Angus Deaton. 2017. “Mortality and Morbidity in the 21st Century.” Brookings Papers Stuckler, David, Sanjay Basu, Marc Suhrcke, Adam Coutts, and Martin McKee. 2011. “Effects of the 2008
on Economic Activity 2017 (1): 397–476. Recession on Health: A First Look at European Data.” The Lancet 378 (9786): 124–25.
Case, Anne, and Angus Deaton. 2020. Deaths of Despair and the Future of Capitalism. Princeton, NJ: Well Being Trust. 2020. “Healing the Nation.” 2020. (https://healingthenation.wellbeingtrust.org).
Princeton University Press.
Wu, Dan, Lingwei Yu, Tingzhong Yang, Randall Cottrell, Sihui Peng, Wei Guo, and Shuhan Jiang. 2020.
Congressional Budget Office. 2020. “CBO’s Current Projections of Output, Employment, and Interest “The Impacts of Uncertainty Stress on Mental Disorders of Chinese College Students: Evidence From a
Rates and a Preliminary Look at Federal Deficits for 2020 and 2021.” 2020. (https://www.cbo.gov/ Nationwide Study.” Frontiers in Psychology 11.
publication/56335).
https://www.brookings.edu/blog/fixgov/2020/04/09/why-are-blacks-dying-at-higher-rates-from-
Cotti, Chad D., Richard A. Dunn, and Nathan Tefft. 2014. “The Great Recession and Consumer covid-19/
Demand for Alcohol: A Dynamic Panel-Data Analysis of U.S. Households.” SSRN Scholarly Paper ID
2184415. Rochester, NY: Social Science Research Network. https://www.npr.org/sections/health-shots/2020/05/07/851610771/u-s-coronavirus-testing-still-falls-
short-hows-your-state-doing
Felzien, Maret, Jack M. Westfall, and Linda Zittleman. 2018. “Building a Mental, Emotional, and
Behavioral Health ‘Community of Solution’ in Rural Colorado.” Community Development Investment
Review, no. 1: 81–90.
Grupe, Dan W., and Jack B. Nitschke. 2013. “Uncertainty and Anticipation in Anxiety.” Nature Reviews.
Neuroscience 14 (7): 488–501.
Hollingsworth, Alex, Christopher J Ruhm, and Kosali Simon. 2017. “Macroeconomic Conditions and
Opioid Abuse.” Working Paper 23192. Working Paper Series. National Bureau of Economic Research.
United States Joint Economic Committee. 2019. “Long-Term Trends in Deaths of Despair” Accessed
April 7, 2020. (https://www.jec.senate.gov/public/index.cfm/republicans/2019/9/long-term-trends-
in-deaths-of-despair).
Luo, Feijun, Curtis S. Florence, Myriam Quispe-Agnoli, Lijing Ouyang, and Alexander E. Crosby. 2011.
“Impact of Business Cycles on US Suicide Rates, 1928-2007.” American Journal of Public Health 101
(6): 1139–46.
Mustard, Cameron A., Amber Bielecky, Jacob Etches, Russell Wilkins, Michael Tjepkema, Benjamin C.
Amick, Peter M. Smith, and Kristan J. Aronson. 2013. “Mortality Following Unemployment in Canada,
1991-2001.” BMC Public Health 13 (May): 441.
Graphic design by Elizabeth Fowler of Collectively CreativeWell Being Trust is a national foundation dedicated to advancing the mental, social and
spiritual health of the nation. Led by clinical, community, and policy innovators, Well Being
Well Being Trust is an impact philanthropy dedicated to
Trust brings an ecosystem approach to prevention, treatment, and recovery for mental
advancing the misuse
health and substance mental, social,
issues, and spiritual
while prioritizing an upstreamhealth
focus on of the nation.
resilience and
Created to include
well-being in communities. participation from people and organizations
across sectors and perspectives, Well Being Trust is committed
to innovating and addressing the most critical mental health
The Robert Graham Center for Policy Research in Primary Care and Family Medicine is the
challenges facing America, and to transforming individual and
policy development division of the American Academy of Family Physicians. The Robert
community well-being.
Graham Center aims to improve individual and population healthcare delivery by creating
and curating evidence that informs policies supporting integrated primary care, family
medicine, and population Ihealth.
wellbeingtrust.org @WellBeingTrust
wellbeingtrust.org graham-center.orgYou can also read