Camden Business and Employment Bulletin - August 2021
←
→
Page content transcription
If your browser does not render page correctly, please read the page content below
Camden Business and
Employment Bulletin
August 2021
Cover photograph courtesy of Brian O’Donnell.

For a Word or RTF version of the document, email population@camden.gov.uk

Produced by Camden Strategy and Change and Economic Development

© London Borough of Camden, 2021

Camden Business and Employment Bulletin                                August 2021

No 1                                                                                                    January 2012

                                                                         Camden Business
                                                                         and Employment
                                                                         Bulletin
[Link to Databook]

                                                                                                         August 2021

Contents
Contents ..................................................................................................................... 3
Introduction ................................................................................................................ 3
Businesses in Camden............................................................................................... 5
   Business numbers and characteristics ................................................................... 5
   Employment in Camden businesses....................................................................... 7
   Commercial property ............................................................................................ 10
   House prices and rents ......................................................................................... 12
Labour market in Camden ........................................................................................ 14
   Employment .......................................................................................................... 14
   Unemployment ..................................................................................................... 16
   Economic inactivity/worklessness ......................................................................... 19
   Unemployment, economic inactivity/worklessness: key issues ............................ 21
     Making sense of youth unemployment at a local level ...................................... 23
   Skills and Qualifications ........................................................................................ 26

Introduction
The Camden Business and Employment Bulletin has been developed by the
Economic Development and Strategy & Change teams in Camden Council in order to
provide an up to date snapshot of the state of the economy in the borough and
more widely in London. The bulletin can be used by Camden-based services,
partners and businesses to inform their plans, strategies and priorities and to
support the development of business cases and applications for funding.

Central London is defined in the bulletin and the accompanying databook as an
aggregation to the eight Central London Forward (CLF) boroughs1.

The bulletin identifies key issues and areas of need in Camden. Its purpose is not
to propose solutions to the issues highlighted nor does it detail the range of
activities the Council’s Economic Development team is taking forward with our
partners in response to Camden’s needs and opportunities. For further details on
these activities, please visit the business and employment pages of
www.camden.gov.uk.

1
    Central London Forward is composed of the following eight Central London boroughs: Camden, City, Islington, Kensington &
    Chelsea, Lambeth, Southwark, Wandsworth and Westminster.

Camden Business and Employment Bulletin                        3                                                   August 2021
The bulletin contains a mixture of data that predates the COVID-19
pandemic, laying-off and furloughing of workers; and data that is feeding
through that does start to show the economic impact.
The bulletin is normally updated every 3 months. It is supported by the
accompanying Camden Business and Employment Databook which includes a
number of regularly updated indicators and it also draws on data from the 2011
Census – Camden Council has produced 2011 Census summary analysis for Camden
and its wards, while a set of detailed labour market and qualifications tables has
also been made available. Unless otherwise stated, data is available in the Camden
Business and Employment Databook.
If you have any comments or feedback on the bulletin or data that you would like
to see included in future updates, e-mail EconomicDevelopment@camden.gov.uk.
COVID-19 Impacts
The impact of Covid-19 on our economy is still unfolding, but it will be profound and
long lasting. Evidence suggests that the economic impact, like the experience of the
virus itself, will be experienced disproportionally by groups who are already
struggling - with jobs losses and impact on earnings more marked for young people,
women, low paid workers, and individuals from Black, Asian, and other ethnic
backgrounds. Existing groups that the Council is focused on supporting into work,
including care leavers and carers, are likely to be further negatively affected.
Camden’s Good Work Camden programme is the local authority’s new
employment support service. The service includes two Job Hubs in Gospel Oak and
Regent’s Park, with a third in development, and also our long-established Camden
Apprenticeships and King’s Cross Construction Skills Centre services. Over the last
year, the Job Hubs have supported over 100 residents into work, 98 residents into
enterprise training and over 50 residents into education and training. The provisions
are open to all.
The Camden Renewal Commission brings together a range of partners to
develop practical solutions to help achieve an inclusive and sustainable economy that
addresses the inequalities that exist in Camden. The Commission met for the first
time in September and has focused on developing an initial set of missions that rally
partners and citizens and act as calls to action as part of the borough’s broad
response to the pandemic and the economic and social impact it has had and will
continue to have in the future. Work around the Renewal Commission missions will
instigate a range of activity to support longer-term responses and economic
recovery.
The Renewal Commission missions are:
Borough wide diversity in positions of power
Every young person is able to create and access opportunity
Everyone in Camden has nutritious, affordable, sustainable food to eat.
Camden’s neighbourhoods are creative and sustainable
Camden Business and Employment Bulletin 4 August 2021Businesses in Camden
Camden’s geographic position in Central London and the business environment
created has enabled it to become one of the most important business locations in
the country. By nearly all indicators, pre-COVID-19, Camden’s businesses were
doing relatively well. Employment growth has been strong in the borough.
However, it is not possible to ascertain the risks or impacts on businesses posed by
changes in the global economy, the global COVID-19 pandemic, or from the UK’s
withdrawal from the European Union.
There are a large number of businesses in Camden - large employers as well as
micro enterprises and Small to Medium Sized Enterprises (SMEs). Many specialise in
highly skilled and high value employment such as those in the Professional,
Scientific and Technical and Information and Communication sectors.
Business numbers and characteristics
Camden is home to the second highest number of businesses in London
after Westminster and is third highest in the UK.
There were 36,805 businesses in Camden in March 20202, a 2% increase on 2019,
with the number of businesses growing 52% since 2008. Camden has the 3rd
highest number of businesses in the UK after Westminster and Birmingham.
Camden accounts for 6.2% of all London local (business) units.
Camden has some large employers but the majority of firms in Camden
are small with few employees.
Of Camden’s 36,805 businesses, the vast majority (31,495; 86%) employ fewer
than 10 employees and three-quarters (27,490; 75%) employ fewer than 5. By
contrast, there are 185 businesses with 250 or more employees, accounting for
0.5% of businesses in Camden2.
Camden has the second highest number of business start-ups in London
and the third highest number of businesses closures.
There were 6,435 business ‘births’, new enterprises started up in Camden in 20193
(the latest year available), a 3% decrease on revised4 figures for 2018. This is the
2nd highest business births figure in London, after Westminster (9,180). There was
an increase in the number of business ‘deaths’ between 2018 and 2019, up 1,580
2
Source: UK Business: Activity, Size and Location, Local Units, 2020 (ONS). Note that the estimates
predate the COVID-19 related lockdowns and restrictions.
3
Source: Business Demography 2019 (ONS).
4
Due to a change in tax law in 2016, ONS has reviewed recent business demography data (2015-
19) and advises caution for some areas, including Camden, due to large numbers of PAYE & VAT
registrations (500+) at an individual postcode. This affects total numbers and business survival
rates. See notes on the ‘Business Demography’ tab of the databook (see cell A79), including links
to further information.
Camden Business and Employment Bulletin 5 August 2021to 5,470 (+41%) in 2019. Camden ranks 3rd in London by the number of business
‘deaths’, but is lower than Westminster (9,150) and the City (5,750).
Two-fifths of new Camden businesses survive for five years.
Of Camden enterprises that started-up in 2014, 39% were still active five years
later in 2019. This is better than the survival rates for Central London5 and Greater
London (36% and 39% respectively), but is lower than the national average (42%).
Amongst London boroughs, in 2019, Camden ranked 24th by business survival
rates, compared to 6th in 2010.
Camden has a higher proportion of large businesses by turnover than
London or the UK.
13.1% of Camden enterprises had a turnover of £1m or more in 2020, higher than
for businesses in London generally (10.2%) and the UK (9.4%), but lower than
Central London (15.5%). In London, only the City and Westminster have a higher
proportion, while Camden ranks 9th in the UK6.
Camden made a large contribution to the national economy according to
localised estimates of GVA (Gross Value Added) statistics.
Prior to COVID-19, the revised ONS estimates of Gross Value Added (GVA)7 showed
that Camden added £34.4Bn to the national economy in 2018, an increase of 93%
on 2008, growing faster than Central London (54%), Greater London (45%) or UK
(34%). Camden is the 4th largest contributor to GVA in London after the City
(£69.1Bn), Westminster (£68.4Bn), and Tower Hamlets (£34.6Bn). Camden
contributes 7.6% of London’s GVA and 1.8% of national (UK) GVA.
Camden specialises in highly skilled, high value parts of the economy
such as law, management consultancy and advertising.
The largest industrial sector in Camden is Professional, Scientific & Technical
enterprises that make up 29% of enterprises in Camden, compared with 21% in
Greater London. The sector includes legal, management consultancy, architectural
and engineering practices, scientific research and advertising/market research8.
5
Central London Forward boroughs: Camden, City of London, Islington, Kensington & Chelsea,
Lambeth, Southwark, Wandsworth and Westminster.
6
Source: UK Business: Activity, Size and Location Survey 2020 (ONS).
7
GVA measures the contribution to the economy of each individual producer, industry or sector in
the UK. The figures are not deemed ‘National Statistics’ but ONS has provided an ‘Experimental
Statistics’ time-series of GVA estimates from 1998-2018 for English local authorities. Each year the
entire series is recalculated on current prices (ONS, 2019). GVA has not yet been updated.
8
Source: UK Business: Activity, Size and Location 2020 (ONS). See UK SIC 2007 for a full
classification.
Camden Business and Employment Bulletin 6 August 2021Employment in Camden businesses Prior to COVID-19 382,000 jobs were located in Camden, 7.1% of London’s employment. There were 382,000 jobs9 located in Camden, the third highest in London after Westminster and the City. The latest figure relates to 2019 (pre-COVID-19) and shows that - up to that point - employment continued to grow. In 2019, Camden had 91,600 (31.5%) more jobs than in 2009, compared to employment growth experienced in Central London (31.4%), Greater London (25.7%) and GB (11.6%). Despite a longer-term trend of growth in part-time jobs in Camden, there was a fall-off in part-time employment 2017-18 of 8,000 jobs (-8.7%) which has carried through into 2019. Over the long-term, there has still been a large growth in part- time employment, increasing by 23,600 (39%) 2009-2019, while full-time employment rose by 57,100 (31%). Part-time employment has increased more in Camden than Central London (29%), Greater London (27%) or Great Britain (14%). Geographically, 60% of jobs are located in the central London portion of Camden to the south of Euston Road; a quarter of jobs (24%) are concentrated in the central Camden Town/Euston/Regent’s Park/Somers Town areas; while the remainder of Camden's jobs (16%) are scattered across town centres and employment sites in north and west Camden, including Hampstead, Kentish Town and Swiss Cottage. Between 2009 and 2019, most industrial sectors saw moderate to strong employment growth: Strong growth (over 10,000 jobs) was concentrated in 5 sectors: Health (+19,000; 19% of growth) Information & Communication (+19,000, 19% of growth) Business Administration & Support Services (+12,000, 12% of growth) Accommodation & Food Services (+10,000, 10% of growth) Education (+10,000; 10% of growth) Moderate growth (1,000-10,000 jobs) was seen in the following sectors: Professional, Scientific & Technical (+9,000; 9% of growth) Arts, Entertainment, Recreation & Other Services (+7,000; 7% of growth) Construction (+3,000, 3% of growth) Retail (+3,000, 3% of growth) Financial & Insurance (+3,000; 3% of growth) Property (+2,000; 2% of growth Wholesale (+1,000; 1% of growth) Public Administration & Defence (+1,000, 1% of growth) Low/no growth (less than 1,000 jobs) was seen in: Motor Trades (+550;
Agriculture, Forestry & Fishing (+30); Mining, Quarrying & Utilities (no change)
There have been employment losses in the following sectors during 2009-2019:
Manufacturing (-1,000) and Transport & Storage (-6,000)
See Figures 1 and 2 below.
By far the largest sector by employment in Camden is the Professional, Scientific
& Technical sector, providing 75,000 jobs (20% of all jobs), compared with 13%
for London as a whole10; though reduced from a peak in 2016 of 88,000. The sector
includes:
Legal and accounting activities
Activities of head offices; management consultancy activities
Architectural and engineering activities; technical testing and analysis
Scientific research and development
Advertising and market research
Other professional, scientific and technical activities – including design,
photography, translation
Figure 1: Big Industry Groups – Total Employment Change 2009-2019
90,000 13: Professional, Scientific & Technical (M)
10: Information & Communication (J)
80,000 17: Health (Q)
16: Education (P)
70,000
14: Business Administration & Support Services (N)
09: Accommodation & Food Services (I)
60,000
18: Arts, Entertainment, Recreation & Other
Services (R,S,T & U)
50,000 07: Retail (Part G)
15: Public Administration & Defence (O)
40,000 88: Transport & Storage (inc postal) (H)
11: Financial & Insurance (K)
30,000 04: Construction (F)
06: Wholesale (Part G)
20,000
12: Property (L)
03: Manufacturing (C)
10,000
02: Mining, Quarrying & Utilities (B,D & E)
0 05: Motor Trades (Part G)
2010
2011
2012
2013
2014
2015
2016
2017
2018
2019
01: Agriculture, Forestry & Fishing (A)
Source: Business Register and Employment Survey 2019, © ONS Crown Copyright, 2020.
10
Source: Business Register & Employment Survey 2019 (ONS).
Camden Business and Employment Bulletin 8 August 2021Figure 2: Employment by Big Industry Group 2019, Camden & London Industry group (Class), percentage Camden London Source: Business Register and Employment Survey 2019, © ONS Crown Copyright, 2020. Camden Business and Employment Bulletin 9 August 2021
Travel to work [data from the 2011 Census].
The 2011 Census showed that 21% of Camden residents lived and worked in
Camden, while a further 14% worked mainly at or from home. The majority of
Camden–resident workers (58%) travelled outside the borough to work. The most
common destination for Camden-resident workers was other London boroughs
(57%, with 27% working in Westminster and in the City). The most common non-
London destinations are Watford, Hertsmere and Welwyn Hatfield. 8% of Camden-
resident workers have no fixed place of work.

91% of all people who worked in Camden in 2011 lived outside the
borough. The majority (70%) lived in other London boroughs, the highest
proportion from Barnet, Islington, Haringey and Lambeth. For those commuting
from outside London, the top five origins were St Albans, Hertsmere, Epping Forest,
Dacorum and Watford11. Compared to 2001, there has been a 20% growth in
Camden residents in employment (from 91,900 to 110,200) and a 10% growth in
the number of people employed in Camden (from 227,700 to 250,000).

Travel to work data will become available from the 2021 Census by 2023,
but it is expected that patterns will be affected by the COVID-19 restrictions that
were in force at the time of the census. Working arrangements were not typical,
with many workers furloughed, working from home and some from second homes
elsewhere. Others affected were made (temporarily or otherwise) unemployed.

Median gross pay of people working in Camden is higher than London.
The median gross annual pay for full-time employees working in Camden was
£40,772 in 2020. Camden’s median gross annual pay is lower than for Central
London (£42,812), but higher compared to Greater London (£41,017) or UK
(£31,461). Average pay increased in Camden in 2019-2020 by 1.3%, lower than the
increases for Central London (3.1%), Greater London (5.1) or UK (3.6%)12.

Commercial property

Camden has the third most valuable commercial property estate in
London after Westminster and the City.
Business premises in Camden were valued at £1.59bn in aggregate for the
purposes of business rates in September 2020, slightly lower than £1.62bn in
September 2018 and 2019. This is the third highest total of London boroughs after

11
     Source: 2011 Census (ONS). Compares with 2001 Census, when 84% of workers in Camden lived
     outside the borough and 60% of Camden residents worked outside the borough.
12
     Source: ONS Annual Survey of Hours and Earnings (ASHE) 2020, from NOMIS. Based on a sample
     survey of employee earnings paid via PAYE. ASHE 2020 relates to the pay period that includes 22
     April 2020, at which time approximately 8.8 million employees were furloughed under the
     Coronavirus Job Retention Scheme (CJRS); the estimates include furloughed employees and are
     based on actual payments made to the employee from company payrolls and the hours on which
     this pay was calculated, which in the case of furloughed employees are their usual hours.

Camden Business and Employment Bulletin           10                                       August 2021
Westminster and the City13 and sees Camden’s share of London rateable value fall
slightly from 7.98% to 7.83%.
The total amount of commercial property available in the borough is
increasing but the pressure on employment space resulting from high
land values, housing need and permitted development remains
significant.
In 2016, Camden had 2,578,000 sq.m of commercial and industrial floorspace, up
from 2,471,000 sq.m in 201214. In 2019/20 a total of 112,653 sq.m of B1 floorspace
was completed and 76,111 sq.m was lost, resulting in a net gain of 36,542 sq.m.
(The B1 business use class includes offices (B1a), light industrial uses (B1b), and
warehouses (B1c)). Trends in B1 floorspace vary year by year, with recent years
seeing net gains15. Although there is forecast growth in employment floorspace
from large office developments, the Council remains concerned to ensure that a
range of types and sizes of business space is available in the borough, including
space that is suitable and affordable for SMEs.
Much of the loss of B1 business floorspace in recent years has been for
redevelopment or conversion to housing. The government introduced permitted
development rights in May 2013, which meant that offices (including viable and
occupied premises) could be converted into residential use without planning
permission. Councils have very limited powers to resist changes made under the
permitted development right. Almost 50,000 sq.m of office floorspace was lost as a
result of the permitted development right between May 2013 and May 2020.
In response to evidence of the impact of the permitted development rights, the
Council introduced 'Article 4 Directions' to remove these right for the majority of
office premises in the borough and also for light industrial premises. Any changes of
use proposals need a planning application and, therefore, they will be assessed by
the Council against its planning policies.
In September 2020, the government changed planning use classes to introduce a
new 'Commercial, Business and Service' use class (Class E). This incorporates the
former B1 use class as well as a wide range of others uses including shops, financial
services, restaurants and cafes, medical and health services, nurseries, gyms and
other indoor recreation uses. Changes between the uses in Class E is not considered
to be ‘development’ and therefore do not require planning permission or any prior
approval and it is not possible to introduce Article 4 Directions. This reduces the
Council’s ability to protect employment floorspace and manage its supply.
The government also introduced new permitted development rights on 1 August
2021 that allow change of use from Class E uses to housing without planning
permission. Existing Article 4 Directions for office to residential changes of use
13
Source: CIPFA, 2020.
14
Source: Valuation Office Agency (VOA).
15
Source: LB Camden Planning Service unpublished data.
Camden Business and Employment Bulletin 11 August 2021remain in place until 1 August 2022 under transitional arrangements but Directions
relating to light industrial premises no longer apply.
In response, the Council is introducing Article 4 Directions to remove the new
permitted development right to protect office and light industrial premises and town
and neighbourhood centres. The Directions are due to come into force at the end of
July 2022, subject to consideration by the government.
House prices and rents
Average house prices in Camden are amongst the highest in the country.
Average house prices in Camden are the fourth highest in the country after
Westminster, City and Kensington & Chelsea. Camden prices peaked in July 2019 at
£894,89816, but prices have since fluctuated and now stand at £878,870 in June
2021. House prices in Camden are 1.7 times higher than Greater London and 3.1
times that for England & Wales. The average price for a flat/maisonette (the most
common property type in Camden) in June 2021 is £785,703. In tandem with the
overall average price, this property type peaked in July 2019 (at £807,835). All
other house types (detached, semi-detached and terraced) are currently at an
historical high, with average detached houses in Camden priced at £3.2m.
By volume, the number of sales long-term average is 200 per month. In the year to
March 2021, sales were lower, averaging 120 per month. See Fig.3 below.
Figure 3: Average House Prices
Average House Prices; Volume of Sales in Camden
£1,000,000 500
£900,000 450
£800,000 400
£700,000 350
House prices
£600,000 300
Sales
£500,000 250
£400,000 200
£300,000 150
£200,000 100
£100,000 50
£0 0
Mar
Jun
Sep
Dec
Mar
Jun
Sep
Dec
Mar
Jun
Sep
Dec
Mar
Jun
Sep
Dec
Mar
Jun
Sep
Dec
Mar
Jun
Sep
Dec
Mar
Jun
Sep
Dec
Mar
Jun
Sep
Dec
Mar
Jun
Sep
Dec
Mar
Jun
Sep
Dec
Mar
Jun
Sep
Dec
Mar
Jun
Sep
Dec
Mar
Jun
Sep
Dec
Mar
Jun
2008 2009 2010 2011 2012 2013 2014 2015 2016 2017 2018 2019 2020 2021
Greater London England & Wales Camden Sales Volume: Camden
Source: Land Registry. This data covers the transactions received at Land Registry in the period 1 Jan-08 to 30 Jun-21,
© Crown copyright 2021.
16
Source: Land Registry. Note that previous bulletins may have quoted different figures: the Land
Registry continually updates both current and historic registrations to provide the most up-to-date
house prices and trends.
Camden Business and Employment Bulletin 12 August 2021Private sector rents are higher in Camden than London as a whole. In
March 2021, the mean monthly rent was £1,861 and the median rent was
£1,582.
In March 2021 (latest figures17), the mean monthly private sector rent for a two
bedroom property in Camden was £2,106 (£498, 31% higher than the London
average), while a three bedroom property was £2,725 (£741, 37% higher).
In the year to March 2021:
Mean rents for all property sizes decreased:
Room-only rents decreased by £249 per month (-24%);
Studios have decreased by £302 per month (-23%);
1 bed properties have decreased by £299 per month (-17%);
2 bed properties have decreased by £240 per month (-10%);
3 bed properties have decreased by £387 per month (-12%); and
4+bed properties have decreased by £282 per month (-7%).
Overall, mean rents for all properties reduced by £441 per month (-19%).
Median rents provide an average figure not skewed by extremes.
In March 2021 (latest figures), the Median monthly private sector rent for a two
bedroom property in Camden was £1,950 (£500, 34% higher than for London as
a whole), while a three bedroom flat was £2,250 (£525, 30% higher).
In the year to March 2021:
Median rents for all property sizes decreased:
Room-only rents have decreased by £125 per month (-14%);
Studios have decreased by £246 per month (-21%);
1 bed properties have decreased by £383 per month (-22%);
2 bed properties have decreased by £360 per month (-16%);
3 bed properties have decreased by £650 per month (-22%); and
4+bed properties have decreased by £629 per month (-17%).
Overall, median rents for all properties decreased by £468 per month (-22%).
17
Source: Valuations Office Agency, 2021.
Camden Business and Employment Bulletin 13 August 2021Labour market in Camden
The overall employment rate in Camden is relatively low and the economic inactivity
rate relatively high in comparison with London and England & Wales. The main
reason for this is the large number of students living in the borough, but there are
also residents that face significant barriers to accessing employment. Camden
Council is working closely with partners to help address some of these barriers.
Unemployment, by the hybrid JSA/Universal Credit measure the Claimant Count,
had risen over 2019 and into 2020, but increased massively due to COVID-19.
Recent months have shown a gradual fall.
Unemployment is higher for certain groups and the Council is actively seeking to
address particular issues, such as people with mental and other health issues. While
the majority of Camden residents are highly educated, there are still too many
residents with no or low qualifications that are increasingly disadvantaged in a high
skills economy. National research has shown that the pandemic has affected some
sectors more than others, with the hospitality sector taking a particularly hard hit,
suggesting that the large hospitality sector in Camden will have suffered.
Employment
Fewer Camden residents are in work as a proportion of the working age
population than in the country as a whole. Detailed 2011 Census data
showed that Camden’s employment rate was lower than the average for
London or England & Wales, and was among the lowest in London. The
Annual Population Survey provides up-to-date estimates.
According to the Annual Population Survey, the estimated employment rate in
Camden was 69.6% in 2020 Q4, which was 0.3 percentage points lower than the
previous quarter, 3.0 percentage points lower than its peak at 72.6% in 2020 Q1
and 0.6 percentage points lower than the same quarter last year. The Camden rate
appears low when compared to Central London (76.2%), Greater London (75.3%)
and Great Britain (75.4%). See Figure 4 below. However, the wide confidence
intervals experienced by the APS data (Camden has one of the widest in London)
make comparisons between areas and over time difficult18.
Despite the initial observation of the estimates, once the confidence intervals are
taken into account, it can be said with some statistical certainty that in the latest
quarter the Camden employment rate is not significantly different to Central
or Greater London, but is significantly lower than to the Great Britain rate.
18
Margin of error for Camden is +/-5.5% in Annual Population Survey (2020 Q4) compared to +/-
1.9% for Central London, +/-0.9% for Greater London and +/-0.2% for GB. Source: NOMIS. Note
that this is the latest data. APS outputs for March 2021 have been delayed until September 2021.
Camden Business and Employment Bulletin 14 August 2021Camden’s relatively low employment rate can be attributed to a large student
population resident in the borough (27,600 in 2018/1919), people looking after
home and family, as well as other sections of the population that face significant
barriers to accessing employment.
Figure 4: Employment Rate (%)
APS Employment Rate (%)
80
75
70
65
60
55
Mar
Jun
Sep
Dec
Mar
Jun
Sep
Dec
Mar
Jun
Sep
Dec
Mar
Jun
Sep
Dec
Mar
Jun
Sep
Dec
Mar
Jun
Sep
Dec
Mar
Jun
Sep
Dec
Mar
Jun
Sep
Dec
Mar
Jun
Sep
Dec
Mar
Jun
Sep
Dec
Mar
Jun
Sep
Dec
Mar
Jun
Sep
Dec
Mar
Jun
Sep
Dec
2008 2009 2010 2011 2012 2013 2014 2015 2016 2017 2018 2019 2020
Great Britain Greater London Central London Camden
Source: Office for National Statistics (Annual Population Survey) © Crown copyright, © 2021.
Comparison with near and neighbouring boroughs (Westminster, Islington and
Kensington & Chelsea) suggests that a low employment rate is typical for Central
London. Up to 2017 Q3, all four boroughs mainly had employment rates below the
average for the Central London (CLF) boroughs - ranging between 62-75%, with
only Islington rising above that level20. In 2020 Q4, Camden (69.6%) has a lower
rate than Islington (76.2%) and Kensington & Chelsea (72.2%), but is higher than
Westminster (67.2%). However, because all have confidence intervals between +/-
5.4% and +/- 6.4%, it means that the difference between the rates is not
statistically significant. These boroughs exhibit variability more likely to be associated
with small APS sample size than real changes in their employment rate.
The 2011 Census provided evidence that the employment rate in Camden is
relatively low. The 2011 Census employment rate refers to 16-74 year olds rather
than the working age population so cannot directly be compared. However, it does
allow comparisons between areas – in Camden the employment rate for 16-74 year
olds (including self-employed people) was 59.8% compared with 62.4% for London
and 61.9% for England & Wales. It was eighth lowest amongst London boroughs.
19
Higher Education Statistics Agency (HESA) student record by area of term-time residence.
20
Central London First boroughs: Camden, City, Islington, Kensington & Chelsea, Lambeth,
Southwark, Wandsworth and Westminster. In the last 4 quarters, only Islington’s rate (latest
75.0%) has exceeded the Central London rate (latest 76.3%).
Camden Business and Employment Bulletin 15 August 2021Median gross pay of Camden residents is higher than London.
The median gross annual pay for full-time employees residing in Camden was
£42,528 in 2020. Camden’s median gross annual pay is lower than for Central
London (£43,309), but higher compared to Greater London (£38,592) or UK
(£31,461). Average pay increased for Camden residents in 2019-2020 by 0.3%,
lower than the increases for Central London (4.1%), Greater London (4.7%) or UK
(3.6%)21.
Figure 5: Residence-based Median Annual Pay for Full-time Work (ASHE)
ASHE Residence-based Median Annual Pay for Full-time Work (£)
49,000
44,000
39,000
34,000
29,000
24,000
2008r
2009r
2010r
2011r
2012r
2013r
2014r
2015r
2016r
2017r
2018r
2019r
2020p
United Kingdom Greater London Central London Camden
Source: Office for National Statistics (Annual Survey of Hours and Earnings) © Crown copyright, © 2020.
Unemployment
The unemployment statistics are currently undergoing an extended
period of change. There are currently three sets of unemployment
indicators at a local authority level:
APS/ILO model-based estimates (survey improved with Claimant Count)
Jobseekers Allowance (JSA) claimants only
Interim 'Claimant Count' measure Combined JSA and Universal Credit
APS/ILO model-based estimates
The model-based estimates provide a rolling quarterly indicator of average
unemployment in the year to the chosen quarter. The model includes data from the
Claimant Count in order to improve the quality of the survey estimate. It provides a
rate of overall unemployment by local authority, but is not broken down further by
21
Source: ONS Annual Survey of Hours and Earnings (ASHE) 2020, from NOMIS. Based on a sample
survey of employee earnings paid via PAYE. ASHE 2020 relates to the pay period that includes 22
April 2020 - at which time approximately 8.8 million employees were furloughed under the
Coronavirus Job Retention Scheme (CJRS); the estimates include furloughed employees and are
based on actual payments made to the employee from company payrolls and the hours on which
this pay was calculated, which in the case of furloughed employees are their usual hours.
Camden Business and Employment Bulletin 16 August 2021sex, age or area. The APS/ILO model-based estimates continue to provide a
measure of unemployment, albeit, between 3 to 6 months in arrears. The ILO/APS
unemployment rate in Camden has jumped from an all-time-low of 4.1% in 2020
Q3 to 5.3% in 2020 Q4.
The change in direction is apparent for central London, Greater London and Great
Britain rates following almost a decade of falling rates since the last recession – see
Figure 6 below. The most rapid increase is the central London change at +1.7
percentage points, with the Camden change +1.2 points, Greater London change
+1.0 points and Great Britain change at +0.3 points.
Figure 6: Model-based unemployment rate
APS 'Model-based' ILO Unemployment Rate (%)
10
9
8
7
6
5
4
3
Mar
Jun
Sep
Dec
Mar
Jun
Sep
Dec
Mar
Jun
Sep
Dec
Mar
Jun
Sep
Dec
Mar
Jun
Sep
Dec
Mar
Jun
Sep
Dec
Mar
Jun
Sep
Dec
Mar
Jun
Sep
Dec
Mar
Jun
Sep
Dec
Mar
Jun
Sep
Dec
Mar
Jun
Sep
Dec
Mar
Jun
Sep
Dec
Mar
Jun
Sep
Dec
2008 2009 2010 2011 2012 2013 2014 2015 2016 2017 2018 2019 2020
Great Britain Greater London Central London Camden
Source: Office for National Statistics (Annual Population Survey) © Crown copyright, © 2021.
JSA claimant unemployment
JSA unemployment data counts the number of claimants by age, sex, duration and
ethnicity, to small areas. The JSA count will continue to be published despite its
decline as people are moved onto Universal Credit, though there will always be a
rump of JSA claimants. As a result, the JSA indicator alone has become mostly
irrelevant, such that at June 2021, JSA accounted for just 8% of the total
Claimant Count (JSA and UC combined).
For this reason, the analysis of JSA has been removed from this bulletin, though the
data is still recorded in the accompanying databook. Although continuing to report
on the JSA statistics in the databook, extreme caution is advised due to the very
small proportion JSA comprises of the total Claimant Count. Figure 7 below
demonstrates the total Claimant Count and the diminishing JSA element for
Camden and Central London boroughs.
Camden Business and Employment Bulletin 17 August 2021Figure 7: Comparison of JSA claimants with Claimant Count
Claimant Count vs. JSA
14,000 120,000
12,000 100,000
Central London
10,000
80,000
8,000
Camden
60,000
6,000
40,000
4,000
2,000 20,000
0 0
Mar
Jun
Sep
Dec
Mar
Jun
Sep
Dec
Mar
Jun
Sep
Dec
Mar
Jun
Sep
Dec
Mar
Jun
Sep
Dec
Mar
Jun
Sep
Dec
Mar
Jun
Sep
Dec
Mar
Jun
Sep
Dec
Mar
2013 2014 2015 2016 2017 2018 2019 2020 2021
Camden (Claimant Count) Camden (JSA)
Central London (Claimant Count) Central London (JSA)
Source: Office for National Statistics/DWP, © Crown copyright, 2021.
Claimant Count
The interim Claimant Count is intended to make allowance for changes in the
benefits system combines counts of JSA and Universal Credit claimants who
are unemployed but seeking work. Camden claimants started to be moved
onto Universal Credit from March 2016, but its introduction to other London
boroughs and other areas has been piecemeal. As the process continues, there are
fewer and fewer JSA claimants and correspondingly more Universal Credit
claimants. To help overcome the difficulties of counting from two different series
(JSA and Universal Credit), DWP has calculated the interim Claimant Count measure
from January 2013, prior to the introduction of Universal Credit. However, the
Claimant Count has also been affected by changes in Government policy resulting in
a broader span of claimants being required to look for work than under Jobseeker's
Allowance.
Claimant Count is the most reliable measure of claimant unemployment going
forward, but is limited to a breakdown by sex and age – crucially, there is no
breakdown by duration or ethnicity. A further complication to making comparisons
between areas is that GLA no longer (not since 2015) calculate rates for the interim
Claimant Count series as it did for JSA, based on estimates of the economically
active population to ward level22. Therefore, comparison with other areas is very
difficult because the economically active population size is affected by higher
numbers of students (typically not economically active) and others not economically
active, such as those looking after home/family and long-term sick.
22
Excluding economically active students.
Camden Business and Employment Bulletin 18 August 2021The Claimant Count shows that claimant unemployment23 had been rising over the
18 months prior to COVID-19, from 2,705 in September 2018, increasing to 4,315
by March 2020.
Between March 2020 and March 2021, Camden experienced a huge increase in the
Claimant Count of +7,375 (+171%) to 11,690 directly due to the impact of the
COVID-19 pandemic. Similar large increases have been experienced in Central
London (+161%), Greater London (+172%) and England & Wales (+114%). Some
of the increase is likely also to have been driven by the migration of people onto
Universal Credit – this is because under Universal Credit, a broader span of
claimants are required to look for work than under JSA - but most of the increase
March 2021-March 2021 is down to COVID-19.
Since March 2021, Claimant Count has been gently falling-off, reducing to 10,215
by June 20121 (-1,475; -12.6%) as COVID-19 restrictions have started to relax.
Slightly larger falls have been experienced by central London (-13.4%), Greater
London (-13.5% and England & Wales (-14.5%) over the same period. However,
the phasing out and expected end of furlough and other government support could
lead to a further surge in unemployment in Camden and across the country in the
coming months.
The level of sustained and long-term unemployment remains a key concern for the
Council.
Economic inactivity/worklessness
Camden has a higher proportion of economically inactive24 people than
Central/Greater London or nationally.
The Annual Population Survey (APS) estimates that 26.6% of the Camden working
age population were economically inactive in 2020 Q425. In Camden, higher levels
of economic inactivity are contributed to by large numbers of students26 and those
looking after home/family.
The economic inactivity rate since 2015 has mostly been below 30%. As with the
employment rate, small sample size in the APS and wide confidence intervals make
fluctuations more likely, and make firm comparisons with other London boroughs
problematic. Camden’s economic inactivity rate (26.6%) is higher than Central
London (18.3%), Greater London (19.9%) and Great Britain (20.9%). Camden's
inactivity rate is 8.3 percentage points higher than the Central London average. See
Fig.8 below.
23
Source: DWP Claimant Count, from NOMIS.
24
Economically inactive people are those of working age who are not actively looking for a job for a
number of reasons e.g. caring responsibilities, disability, studying or retired. Full-time students
may be classified as economically active but the vast majority are economically inactive.
25
Source: Annual Population Survey (ONS). Margin of error for 2020 Q4 is +/-5.3%, from NOMIS.
26
27,615 higher education students live in Camden, more than in any other London borough. Higher
education students, by residence, 2018-19. Source: Higher Education Statistics Agency (HESA).
Camden Business and Employment Bulletin 19 August 2021Figure 8: Economic Inactivity Rate (%)
APS Economic Inactivity Rate (%)
40
30
20
10
0
Mar
Jun
Sep
Dec
Mar
Jun
Sep
Dec
Mar
Jun
Sep
Dec
Mar
Jun
Sep
Dec
Mar
Jun
Sep
Dec
Mar
Jun
Sep
Dec
Mar
Jun
Sep
Dec
Mar
Jun
Sep
Dec
Mar
Jun
Sep
Dec
Mar
Jun
Sep
Dec
Mar
Jun
Sep
Dec
Mar
Jun
Sep
Dec
Mar
Jun
Sep
Dec
2008 2009 2010 2011 2012 2013 2014 2015 2016 2017 2018 2019 2020
Great Britain Greater London Central London Camden
Source: Office for National Statistics (Annual Population Survey) © Crown copyright, © 2021.
Economic inactivity was also measured in the 2011 Census, based on people aged
16-74: 32% of Camden people were economically inactive compared to 28% in
London and 30% in England & Wales. This supports the findings of the Annual
Population Survey - Camden has relatively higher rates of economic inactivity27.
‘Other - not specified’, Students, Long-term sick and Looking after
home/family are the main reasons for economic inactivity in Camden.
The APS provides reasons given for people’s economic inactivity. In 2020 Q4, the
‘Other (not specified)’ reasons28 were the highest, accounting for over a quarter
(27.7%) of all economic inactivity. The rate has risen sharply in the last four
quarters - timing that coincides with COVID-19. Of the traditional reasons for
economic inactivity, being a student is the most important inactivity factor in
Camden, covering 24.6% of inactivity – though now lower than Central London
(30%), London (32%) and GB (27%). Other factors are Long-term sick (20.7%);
Looking after home/family (14.3%); Temporary sick (9.2%) and being Retired
(3.5%)29. Camden has a higher proportion of economically inactive people who
stated they would like to have a job (28%) than Central London (27%), but higher
than Greater London (23%) or Great Britain (22%)30. See Fig. 9 below.
27
Source: 2011 Census labour market tables (ONS) available on the Open Data Camden website.
28
Source: Annual Population Survey, 2020 Q4 (ONS). Camden margins of error for the ‘Other (not
specified)’ category is +/- 10.9%.
29
Source: Annual Population Survey, 2020 Q4 (ONS). Camden margins of error:
Student (+/- 10.5%); Long-term sick (+/- 9.8%); Looking after home/family (+/- 8.5%).
30
Source: Annual Population Survey, 2020 Q4 (ONS). Camden margin of error is +/- 11.7%.
Camden Business and Employment Bulletin 20 August 2021Figure 9: Reasons for Economic Inactivity
Reason for Economic Inactivity (%): December 2020
13.0
Other 16.2
21.0
27.7
13.6
Retired 6.9
5.0
3.5
0.7
Discouraged 0.7
1.4
0.0
23.6
Long-term sick 17.4
17.4
20.7
2.0
Temporary sick 2.7
5.6
9.2
20.1
Looking after family/home 24.3
19.6
14.3
27.0
Student 31.9
30.1
24.6
0 10 20 30 40
Great Britain Greater London Central London (CLF) boroughs Camden
Source: Office for National Statistics (Annual Population Survey) © Crown copyright, © 2021.
The economic inactivity rate is slightly higher for Camden women than
for men, with a gap of 2 percentage points.
In 2020 Q4 the APS inactivity rate for women in Camden was higher for women
than for men, with 27.6% of women inactive compared with 25.6% of men31.
Unemployment, economic inactivity/worklessness: key issues
The Claimant Count is a hybrid of JSA and Universal Credit claimants.
The nature of measuring local unemployment has changed
The Government’s phased transfer of people to Universal Credit (UC) from Jobseekers Allowance (JSA) has had
an impact on counts of ‘unemployment’ at the local level. For JSA it was inevitable that claimant numbers would
fall as people were moved to Universal Credit, though it will never reach zero - there will always be a handful of
JSA claimants. Universal Credit was introduced in in Camden in March 2016. Under Universal Credit, a broader
span of claimants are required to look for work than under Jobseeker's Allowance. As Universal Credit Full
Service is rolled out, the number of people recorded as being on the Claimant Count is therefore likely to rise.
Though JSA numbers are still being released, the official (but interim) measure of ‘Claimant Count’ is
released monthly by DWP, which is a combination of JSA claimants and people on Universal Credit who are not
working. Claimant Count (numbers of claimants, but not rates*) are published in the linked databook.
* GLA no longer produce estimates of the economically active population, therefore, it is no longer possible to
have the claimant count expressed as a rate, i.e. unemployment as a percentage of the economically active
population (less students). For more information, see Annex on page 28.
31
Source: Annual Population Survey, 2020 Q4 (ONS). Margins of error are +/- 7.6% and 7.5%
respectively.
Camden Business and Employment Bulletin 21 August 2021The Claimant Count measure of unemployment fell considerably between
March 2013 and December 2015. Stabilising during 2016-2018, it started
to rise again in 2019 and early 2020. The impact of COVID-19 saw it rise
substantially into 2021, though numbers for the present have peaked.
The Claimant Count fell in Camden between March 2013 (5,010) and December
2015 (2,595). The number fluctuated over 2016-2018, but had increased to 4,315
by March 2020.
Between March 2020 and March 2021, Camden experienced a huge increase in the
Claimant Count of +7,375 (+171%) to 11,690 directly due to the impact of the
COVID-19 pandemic. Similar large increases have been experienced in Central
London (+161%), Greater London (+172%) and England & Wales (+114%). Some
of the increase is likely also to have been driven by the migration of people onto
Universal Credit – this is because under Universal Credit, a broader span of
claimants are required to look for work than under JSA - but most of the increase
March 2021-March 2021 is down to COVID-19.
Since March 2021, Claimant Count has been gently falling-off, reducing to 10,215
by June 20121 (-1,475; -12.6%). Slightly larger falls have been experienced by
central London (-13.4%), Greater London (-13.5% and England & Wales (-14.5%)
over the same period.
Figure 10: Claimant Count
Claimant Count: Camden
14,000
12,000
11,690
11,220
10,000
10,875
10,305
10,215
8,000
Camden
6,000
5,010
4,000
4,530
4,315
4,255
4,140
4,030
3,855
3,840
3,730
3,395
3,375
3,200
2,000
2,960
2,875
2,865
2,805
2,775
2,770
2,755
2,745
2,710
2,705
2,705
2,700
2,700
2,690
2,655
2,645
2,595
0
Mar
Jun
Sep
Dec
Mar
Jun
Sep
Dec
Mar
Jun
Sep
Dec
Mar
Jun
Sep
Dec
Mar
Jun
Sep
Dec
Mar
Jun
Sep
Dec
Mar
Jun
Sep
Dec
Mar
Jun
Sep
Dec
Mar
Jun
2013 2014 2015 2016 2017 2018 2019 2020 2021
Source: Office for National Statistics (DWP Claimant Count) © Crown copyright 2021.
Camden Business and Employment Bulletin 22 August 2021Making sense of youth unemployment at a local level
The Claimant Count is currently the most reliable measure of youth unemployment at a local level
When politicians and the media talk about large numbers of young people out of work nationally, they are using
the APS model-based unemployment estimate figures. However, the model-based unemployment is not
available by age at a local level, e.g. London boroughs. The Annual Population Survey sample is too small to
provide a reliable figure for youth unemployment. The APS model-based estimates are much higher than the
Claimant Count numbers in large part because they include students who are looking for work (and therefore
meet the ILO definition mentioned above). While these students are competing in the labour market in the same
way as everyone else, they are not “unemployed” in the same way as those who are not in full-time education.
This is particularly an issue in Camden, where there is a large number of full-time students.
Many labour market analysts believe that excluding students in full-time education looking for work gives a
better indication of the scale of the problem of youth unemployment. The Claimant Count excludes full-time
students, as they are not eligible to claim JSA or Universal Credit.
The long-term trend of falling numbers and proportions of young
unemployed has seen claimants aged 16-24 bottom out by the end of
2017 and increase steadily over 2018, 2019 and into 2020. The impact of
COVID-19 saw an immediate and large increase that reached a peak in
February 2021.
In March 2013 the Claimant Count of young people aged 16-24 was 845 (17% of all
claimants) and decreased to 320 (11.6% of claimants) by June 2018. The number
and proportion of young claimants then increased steadily over 2018, 2019 and into
2020 – by March 2020, reaching 670 (15.5% of claimants).
The impact of COVID-19 was immediate. Between March and April 2020, the
number of young claimants jumped by 380 to 1,050 (up 57%) and continued to rise
until peaking at 1,940 in February 2021. It has slowly decreased to 1,670 in June
2021.
The proportion of claimants aged 16-24 has been rising too, reaching 16.7% in
December 2020, though in the latest quarter to June 2021 has fallen back slightly
to 16.0%. This compares with lower rates for Central London (14.7%) and Greater
London (15.7%), but lower than England & Wales (18.5%). See Fig.10 below.
Compared to the pre-COVID-19 period (March 2020), the number of unemployed
young people in June 2021 is now 965 (+144%) in Camden, compared with similar
increases for Central London (146%) and Greater London (144%) – these rates of
increase are much higher compared to those for England & Wales generally
(78%)32.
32
Source: DWP Claimant Count, from NOMIS.
Camden Business and Employment Bulletin 23 August 2021Figure 11: Claimant Count: Proportion of Younger Claimants (%)
Claimant Count Aged 16-24 (%)
30%
25%
20%
15%
10%
5%
0%
Mar
Jun
Sep
Dec
Mar
Jun
Sep
Dec
Mar
Jun
Sep
Dec
Mar
Jun
Sep
Dec
Mar
Jun
Sep
Dec
Mar
Jun
Sep
Dec
Mar
Jun
Sep
Dec
Mar
Jun
Sep
Dec
Mar
Jun
2013 2014 2015 2016 2017 2018 2019 2020 2021
England & Wales Greater London Central London Camden
Source: Office for National Statistics (DWP Claimant Count) © Crown copyright 2021.
There are concentrations of unemployment in particular parts of Camden:
the highest Claimant Count numbers are in St Pancras & Somers Town,
Kilburn and Regent’s Park wards.
Wards with the highest Claimant Count in June 2021 were St Pancras & Somers
Town (990), Kilburn (825) and Regent’s Park (725). Wards with the fewest
claimants were Hampstead Town (205), and Frognal and Fitzjohns (255)33. All
wards have seen decreases in the last quarter (to June 2021).
Over the COVID-19 period, since March 2020, the change in Claimant Count in
Camden to June 2021 is +5,900 (+137%) – over that period, all wards have seen
large increases, but have peaked in the spring of 2021 and are now lower. The
majority of the change is a direct result of COVID-19. Wards with the largest
increases over the period were St Pancras and Somers Town (+560), Kilburn
(+450), and Regent’s Park (+450). The smallest increases were seen in Hampstead
Town (+130) and Frognal and Fitzjohns (+160).
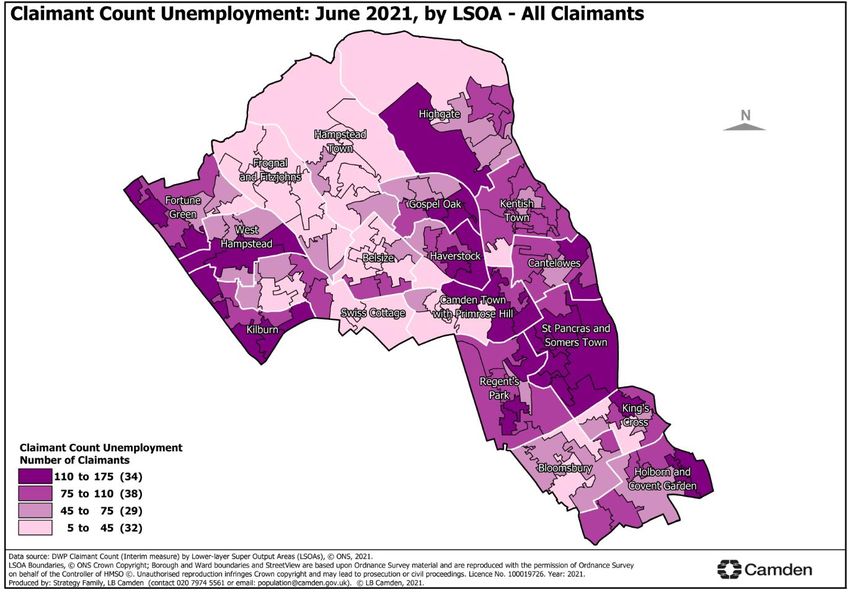
The Claimant Count is further broken down geographically to Lower-layer Super
Output Area (LSOA). This data is best expressed as a map. Fig.12 below shows the
Claimant Count number by Camden LSOA, which shows the concentration of
unemployment-related claimants in particular parts of Camden, including Somers
Town/Regent’s Park; Camden Town/Haverstock/Gospel Oak; Kentish Town/
Cantelowes; Kilburn/West Hampstead; Highgate; and King’s Cross/Holborn.
33
Source: Camden analysis of DWP data from NOMIS.
Camden Business and Employment Bulletin 24 August 2021Figure 12: Map of Claimant Count by LSOA Source: Office for National Statistics (DWP Claimant Count) © Crown copyright 2021. The number of older claimants (aged 50+) has been increasing since early 2015, but the increase has grown substantially between March 2020 and June 2021, mostly a direct result of COVID-19. Proportionally, people aged 50+ comprise over a quarter of the Claimant Count in Camden. The number of older claimants aged 50+ has been increasing since bottoming out in mid-2015 (at 665 claimants). In March 2020 the number of claimants aged 50+ had risen to 1,270. However, by June 2021, with the effects of COVID-19, this has further increased to 2,720 – an increase of 1,450 (+114%). This increase compares to a 98% rise for Central London, a 112% rise for London and an 80% rise in England & Wales. By proportion, the number of claimants aged 50+ peaked at 35% in September 2018, but has fallen over subsequent quarters and accounted for 27% of claimants in June 2021. In March 2021, in Camden, there were more male claimants aged 50+ (1,660) than female claimants (1,360), 55% and 45% respectively. Over the year to March 2021, the number of male and female claimants has grown by 925 and 820 respectively, but the change is a higher percentage increase for women (152%) than for men (126%). Camden Business and Employment Bulletin 25 August 2021
Employment and Support Allowance (ESA) claimant numbers in Camden
peaked at 10,000 in May 2015 since when they have been declining.
Employment and Support Allowance (ESA) replaced Incapacity Benefit and Income
Support paid on the grounds of incapacity for new claims from 27 October 2008.
In February 2021 (latest figures) there were 8,177 ESA claimants34 resident in
Camden, a decrease of 124 (-1.5%) from the previous quarter and a decrease of
409 (-4.8%) over the year.

By ESA phase, in February 2021, 88% of claims were assessed as support group
(people with the severest conditions); and 8% for the work group (people deemed
suitable for work in the short- to medium-term), with the remainder still being
assessed within the system. The proportions are similar for comparator geographies:
Central London (87% and 8%); Greater London (86% and 8%); and England &
Wales (81% and 11%) respectively. The proportion within the support group has
grown over time, for Camden from 67% in February 2016 to 88% in February 2021
– with similar changes in London and nationally. There has been a corresponding,
diminishing, effect found with the proportion in the work group over time.

Skills and Qualifications

Camden residents in work are much more likely to be in high skilled jobs
than elsewhere in London.
A similar proportion of Camden residents work in Professional Occupations (34%)
than do in Central London (34%); but more than in Greater London (30%) or in
England & Wales (23%) according to the latest data available (Q4 2020) 35. For
Associate Professional & Technical Occupations there is a similar proportion in
Camden (21%) and Central London (22%), with Greater London (19%) and
England & Wales (16%)36. For Managers, Directors and Senior Officials, Camden
(18%), compares with Central London 15%, Greater London 13% and England &
Wales 12%)37.

Fewer Camden people work in Administrative/ Secretarial Occupations (3%), Skilled
Trades (8%) and Elementary Occupations (5%), reflecting that Camden and
London’s economies have moved towards higher skilled occupations.

The Annual Population Survey analysis continues to echo information from the 2011
Census, both in terms of the actual percentages for each group (32% for
Professional Occupations, 22% for Associate Professional & Technical occupations
and 14% for Managers, Directors and Senior Officials) and in comparison with

34
     Source: DWP, from Stat-Xplore.
35
     Source: Annual Population Survey, Q4 2020 (ONS). Margin of error for Camden is +/- 6.4%, from
     NOMIS.
36
     Margin of error for Camden in Q4 2020 is +/- 5.5%.
37
     Margin of error for Camden in Q4 2020 is +/- 5.1%.

Camden Business and Employment Bulletin          26                                      August 2021
You can also read