2021 Surrey Roads Survey - News 1130
←
→
Page content transcription
If your browser does not render page correctly, please read the page content below
2021 Surrey Roads Survey
2021 Surrey Roads Survey

                                                                                                           Table of Contents

SURREY BOARD OF TRADE .................................................................................................4
    WHO WE ARE......................................................................................................................... 4
    OUR MEMBERSHIP ................................................................................................................ 4
    WHAT WE DO ........................................................................................................................ 4
    ADVOCACY ............................................................................................................................ 4
    PURPOSE OF SURVEYS ........................................................................................................... 4
INTRODUCTION .................................................................................................................5
EXECUTIVE SUMMARY .......................................................................................................7
    RECOMMENDATIONS ............................................................................................................ 8
SURVEY HIGHLIGHTS..........................................................................................................9
OVERVIEW OF RESULTS ................................................................................................... 11
    COMMUTING IN SURREY ..................................................................................................... 11
    RESPONDENTS WORK RELATED TRAVEL.............................................................................. 12
    EMPLOYEES TRAVEL FOR BUSINESS..................................................................................... 14
    BARRIERS TO CHOOSING ALTERNATIVE MODES OF TRANSPORTATION .............................. 15
    TRAFFIC CONGESTION AND ITS IMPACTS ON BUSINESS OPERATIONS ................................ 16
      MANAGING INCREASING VEHICLE TRAFFIC CONGESTION ............................................... 16
    CITY ROADS AND PROJECTS ................................................................................................. 17
      ROAD CORRIDORS ............................................................................................................ 17
      CONNECTIONS ................................................................................................................. 18
      INTERSECTIONS ................................................................................................................ 18
    BIKE SHARING IN SURREY .................................................................................................... 19
    TRANSIT ............................................................................................................................... 20
    CURBSIDE PULL-OUTS ......................................................................................................... 21
    ROAD SAFETY ...................................................................................................................... 23
    RIDESHARING SERVICES ...................................................................................................... 25
    MAJOR INFRASTRUCTURE ................................................................................................... 26
      PATTULLO BRIDGE ........................................................................................................... 26
      MASSEY TUNNEL .............................................................................................................. 27
APPENDIX 1 – RESPONDENTS IN DETAIL .......................................................................... 29
APPENDIX 2 – RESPONSES IN DETAIL ............................................................................... 32
    RESPONDENTS..................................................................................................................... 32
    SIZE OF ORGANIZATION BY NUMBER OF EMPLOYEES ......................................................... 32
    RESPONDENTS BY INDUSTRY – TOP 10 ................................................................................ 33

2                                                     businessinsurrey.com
COMMUTING IN SURREY ..................................................................................................... 33
RESPONDENTS WORK RELATED TRAVEL.............................................................................. 34
EMPLOYEES TRAVEL FOR BUSINESS..................................................................................... 36
STRATEGIES TO MANAGE TRAFFIC DEMAND ....................................................................... 37
CITY ROADS AND PROJECTS ................................................................................................. 38
BIKE SHARING IN SURREY .................................................................................................... 42
RAPID TRANSIT .................................................................................................................... 43
CURBSIDE PULL-OUTS FOR BUSES ....................................................................................... 44
ROAD SAFETY....................................................................................................................... 45
RIDESHARING SERVICES ...................................................................................................... 47
MAJOR INFRASTRUCTURE ................................................................................................... 47
PATTULLO BRIDGE ............................................................................................................ 47
GEORGE MASSEY TUNNEL ................................................................................................ 48
inclusive | innovative | independent 32021 Surrey Roads Survey
Surrey Board of Trade
WHO WE ARE
The Surrey Board of Trade is a city-building business organization that supports, promotes,
and advocates for commercial and industrial interests for Surrey businesses — the city’s
economic drivers. With Surrey’s rapidly growing significance in the Lower Mainland, the role
of the Surrey Board of Trade has never been more important than now to champion a
strong, vibrant business community for needed economic and infrastructure assets.
OUR MEMBERSHIP
The Surrey Board of Trade is a powerful link between business, government, and
community with a membership representing over 6,000 member contacts and 60,000
employees.
WHAT WE DO
The Surrey Board of Trade provides businesses and organizations with:
• Economic opportunity
• Workplace development and education
• International trade
• Government advocacy
• Business connections
ADVOCACY
As a city-building business organization, the Surrey Board of Trade is an independent voice
of business that develops positions on relevant economic topics of concern to our
members.
PURPOSE OF SURVEYS
The Surrey Board of Trade implements surveys on a range of topics to obtain input from our
membership. Member participation is voluntary and anonymous; however, the data is an
invaluable tool for the Surrey Board of Trade’s advocacy and policy development.
4 businessinsurrey.comIntroduction
The Surrey Board of Trade believes that transportation is one of the key economic
foundations of building our city. Representing the interests of our members, we advocate in
support of transportation infrastructure improvements for the safe and efficient movement
of people and commercial traffic throughout Surrey. To do this, we need to continually
assess areas in Surrey that may be impediments for our businesses and industry. Results of
this survey will be shared with the City of Surrey for their consideration.
CITY OF SURREY ROAD IMPROVEMENT PLANNING PROCESS
The City's network of over 4,500 lane kilometres of road is seeing increasing commuter and
commercial usage. The 10-Year Servicing Plan (YSP) establishes the Engineering
Department's capital expenditure program including road improvement projects. While the
10-YSP is not a commitment to construct all the identified projects, it identifies projects that
will be constructed on a year-to-year basis as funding becomes available. Priorities are
evaluated annually. Major projects take approximately three or more years to complete.
SURREY BOARD OF TRADE INPUT
Since last year's survey, the City of Surrey has completed four of the road corridor projects
SBOT members identified as top priorities. These include 140 Street widening between 88
Avenue and 92 Avenue, 64 Avenue widening between 184 Street and Fraser Highway, 32
Avenue widening between 154 Street to 160 Street, 32 Avenue widening from 176 Street to
188 Street. Eleven more are planned to be completed in the next 1-5 years. These include
160 Street between 26 Avenue and 32 Avenue, 140 Street between 100 Avenue and 105A
Avenue, 64 Avenue between 188 Street and Fraser Highway, 32 Avenue between 152 Street
and Hwy 99 Interchange, 140 Street between 88 Avenue and 92 Avenue, Fraser Highway
between 140 Street and 148 Street – a project highlighted by the Surrey Board of Trade in
the previous two surveys – Fraser Highway between 138 Street and 140 Street, 32 Avenue
between 154 Street and 160 Street, 160 Street between Fraser Highway and 88 Avenue,
152 Street between 40 Avenue and 500 Block, 90 Avenue between 132 Street and King
George Boulevard, and 64 Avenue between 184 Street and 188 Street.
The City has added seven of the intersection projects SBOT members identified as top
priorities. These include: 24 Avenue and 156 Street; 32 Avenue and 140 Street; 60 Avenue
and 148 Street; 82 Avenue and 128 Street; 88 Avenue and Harvie Road; 108 Avenue and
144 Street, and; 108 Avenue and Oriole Drive.
The fifth annual road survey includes the results from 2016 to 2020. The 2020 snapshot is
the baseline from which the Surrey Board of Trade and the City of Surrey can measure
inclusive | innovative | independent 52021 Surrey Roads Survey
improvement over time. Survey responses were obtained between October and December
2020.
The Surrey Board of Trade will continue to implement the Surrey Roads Survey to track
improvements where they occur and identify concerns as they arise for our members in
order to:
• Gain a deep understanding of our members’ commute and business travel trends.
• Determine any actions, recommendations, or policies that may be required.
• Add to our body of knowledge that will lead to better movement of people and goods
through Surrey and the South Fraser Economic Region.
6 businessinsurrey.comExecutive Summary
The first Surrey Roads Survey, completed in 2016, is the baseline from which we measure
change. Other than the list of City of Surrey projects, the addition of questions from the City
of Surrey, and questions on COVID-19 impacts, all of the questions remain the same.
Business travellers are tracked with this annual survey. It was found that 57.4% of
Respondents live and work in Surrey, which is a slight increase from 2019. 80% of
Respondents work in Surrey. There is a slight decrease of those working in Surrey and living
in the South Fraser Economic Region. The number of Respondents is substantially higher
than the previous iterations of the survey.
Patterns are beginning to emerge with five years of comparable data. There was a slight
downward trend of those travelling for business in 2018, which increased in 2019. In 2020,
we observe a significant decrease in those travelling during the workday, likely due to
COVID-19 restrictions. There is a downward trend of travel with an increase in people
spending zero hours travelling to work, likely attributed to COVID-19. In 2018, we saw the
first respondents reporting that they cycle to work. That number was reduced to zero in
2019 and this year.
Transit users have increased, highlighting the need for transit throughout Surrey with many
roads and routes suggested, along with more benches and covering at transit stops to
support transit users.
The top 3 choices for corridors to be improved are:
• Fraser Highway: Widen to 4 lanes between Whalley Boulevard and 148
Street, including through Green Timbers Park
• 152 Street: Widen to 4 lanes from 40 Avenue to 50 Avenue
• 64 Avenue: Widen to 5 lanes between 176 Street and Fraser Highway
The majority of Respondents indicated that traffic has some impact on business operations.
The most popular option chosen by Respondents to manage congestion and delays was to
improve efficiencies.
The City of Surrey is working to implement a Safe Mobility Plan and asked for input on their
“Vision Zero” principles. Safety on the roads is a top priority and concern for almost every
Respondent. Over 90% of Respondents agreed that safety is a shared responsibility
between users and designers/maintenance. However, 50% of Respondents indicated that
lower speed limits will not help reduce collisions in Surrey.
inclusive | innovative | independent 72021 Surrey Roads Survey
Ridesharing is a service that all major cities and regions across the world have had for many
years. Our survey Respondents have noted that there should be no pickup restrictions for
ridesharing.
Surrey is so spread out geographically, and the ability for commuters to use bicycling as a
transportation option is not efficient to get to and from work.
Support for a new Pattullo Bridge with an expanded 6 lanes has strong support, as is
replacing the Massey Tunnel with a bridge. Respondents did comment that the
infrastructure north of these crossings will have to be altered or expanded to accommodate
travellers, especially during peak hours.
RECOMMENDATIONS
As a result of survey responses and voluntary additional comments, the Surrey Board of
Trade recommends:
1. Widening on-and-off ramps of bridges.
2. Planning all major infrastructure projects to anticipate growing population needs.
3. All levels of government working together to develop a comprehensive and
sustainable inter-regional transit/transportation plan for the South Fraser Economic
Region, that would not change with election cycles.
8 businessinsurrey.comSurvey Highlights
The daily commute 57.4% Respondents live and work in Surrey – this has increased compared with
previous years
21.8% work in Surrey but live South of the Fraser or Metro Vancouver, down
from 2016
83.5% drove their own vehicle to work – down from 2019 (92.9%) and 2017
(92.6%) 2016 (87.1%), but up from 2018 (81.3%)
4.4% walked to work, up from 1.8% in 2019, 0.9% in 2017, and 2% in 2016 but
down from 6.6% in 2018
Traveling for business 20% drive 4 or more days a week for work, down from all previous years
25.2% drive 2-3 days per week, higher than 2019 but lower than 2016, 2017, and
2018
20% rarely drive, a significant increase from previous surveys
Travel destinations 22.6% travel within Surrey, an increasing trend since 2018
51.3% travel throughout South Fraser (Surrey plus options combined),
comparable to 2019
83.5% travel throughout Metro Vancouver (combining multiple options)
Employee travel 45.7% Respondents estimate that 0-20% of their colleagues travel for business,
up by 5% from previous years
52.2% of colleagues travel 1 to 2 hours per day on average, up from 49% in 2016
but down from 60% in 2018
Barriers to choosing alternative 36.5% indicated that there are no barriers to choosing different options
modes of transportation 50.4% indicated that there is a barrier
Traffic congestion impact on 25.7% indicated there was a limited impact to business operations
business operations 50.5% indicated traffic congestion somewhat impacted business operations
23.8% indicated traffic congestion had a significant impact business operations
Three key strategies for Improving Efficiency ranked highest as a method to managing traffic congestion
managing traffic congestion Increasing Capacity came in second
Managing Traffic Demand was the least popular selection
Top 3 corridors 63.2% chose arterial widening to 4 lanes on Fraser Highway between Whalley
requiring attention Boulevard and 148 Street, including through Green Timbers Park
52.9% want 152 Street widened to 4 lanes between 40 Avenue to 50 Avenue
51.7% want to widen 64 Avenue to 5 lanes between 176 Street and Fraser
Highway
inclusive | innovative | independent 92021 Surrey Roads Survey
Top choice for road connections 68.2% prioritized a new construction on Whalley Boulevard connecting Fraser
Highway to 96 Avenue
Top 3 intersections requiring 74.7% indicated 64 Avenue and 168 Street
improvement 73.5% indicated 104 Avenue and 156 Street
71.1% indicated Fraser Highway and 184 Street
Transit needed 79.3% of Respondents stated that we should have and definitely need rapid
transit on Fraser Highway (City Centre to Langley)
67.8% of Respondents determined that we should have and definitely need rapid
transit between Guildford, City Centre and Newton on King George
Boulevard and 104 Avenue
66.7% believe that we should have and definitely need a new B-Line bus service
to South Surrey/White Rock
Curbside bus pull-outs 66.7% believe that curbside pull-outs for buses are very important and
extremely important
83.9% believe that curbside pull-outs for buses would be effective in reducing
congestion along major arterial roadways
Safety first 96.6% planners should use data and best practice to determine the areas where
road improvements should be made
96.6% stated that they either agree or strongly agree that we all need to do our
part to keep our most vulnerable road users safe
96.6% stated that they either agree or strongly agree that it is a shared
responsibility between users and designers/maintenance
50.6% stated that reducing speed would not reduce collisions in Surrey
Ridesharing 63.5% want ridesharing services without pickup location restrictions
Bike sharing 46.5% of Respondents would be very unlikely to cycle to work if Surrey had bike
sharing, down from 2019 (59.7%)
14.9% of Respondents would be very likely to somewhat likely to use bike
sharing, up from 2019 (12.3%)
Bridges wanted 74.7% want the Pattullo Bridge to have 6 lanes available on opening day
56.3% want a bridge (whether as originally planned or with fewer lanes) to
replace Massey Tunnel; only 18.4% would support expanding the tunnel with
another tube and upgrades
10 businessinsurrey.comOverview of Results
Please note: Details and tables of results are in Appendix 2 on page 32. All data are in
percentages unless otherwise indicated. Numerical data, where given, have been rounded
to the first decimal, therefore results may not add up to 100%.
COMMUTING IN SURREY
One of the more important metrics to measure is how many Respondents work in Surrey.
Over 50% live and work in Surrey, and this is consistent over the past 4 years. Also
consistent is that
nearly 70% of Live and Work Locations
Respondents stay 70
South of the Fraser 60
50
as part of their 40
30
commute. Most of 20
10
those who chose 0
other pointed out Live and Live in Live in Live in Work in Work in Work in Live and
work in Surrey, Surrey, Surrey, Surrey and Surrey and Surrey and work
that they work Surrey work South work in work live South live in live outside outside
from home. of Fraser Metro outside of Fraser Metro Metro Surrey
Vancouver Metro Vancouver Vancouver
Transit usage is Vancouver
consistently below 2016 2017 2018 2019 2020
7%. As later
responses demonstrate, the low ridership numbers are more indicative of a lack of
reasonable transit options for potential riders in Surrey. ‘Reasonable’ is variously defined by
municipal or transit planners as being within 5 to 10 minutes walking distance to a transit
stop.
92.6 92.9 The Daily Commute
100
87.1 81.3 83.5
2016 2017 2018 2019 2020
80
60
40
6.6 3.7
20 4.4 4.4 1.9 2.7 1.8
6.1 1.1 2.4 6.1
4.7 0.9 0.9 0.9 1.8 1.2 2.2 0 4.7 4.4
0 0 0 0
0
Drive own vehicle Use transit Cycle Walk Carpool Other
inclusive | innovative | independent 112021 Surrey Roads Survey
Cycling was not chosen by any Respondent, similar to 2016, 2017, and 2019. Those that
chose other indicated that they have a home office but travel to clients, indicative of the
state of travel as a result of COVID-19. Overall, Responders mostly live and work South of
the Fraser and will drive as part of their commute.
RESPONDENTS WORK RELATED TRAVEL
Travelling to and from
Driving for Business
work, as well as heading
Yes
45
Often
out to sales calls,
40
Sometimes meetings, and other
35 Rarely
No
errands, can consume a
30
good portion of a
25
workday. With five years
20
of data, we can speculate
15
10
that there is a trend
5
developing in daily
0
business travel. There
2016 2017 2018 2019 2020
was a downward trend of
those who responded
yes, they travelled daily
for business during the day concurrent with more people not driving at all from 2016 to
2020. Those who do not drive at all for business during the day were in an upward swing.
Those who drive sometimes, defined as driving 2 to 5 times a month, has decreased and
returned to 2017 levels. These results should not be surprising as COVID-19 shut down
much of the economy and has led to reduced road users, however, many returned to work
(office workers and essential jobs) when this survey was released between October and
December 2020.
When Respondents were asked
How long is your average commute one- how long their average commute
way?
was one-way, the majority spend
50.0% 45.2%
between 0-45 minutes in traffic.
40.0%
You can fit Vancouver,
30.0%
20.0% 20.0% Richmond, Burnaby and New
20.0%
Westminster within the
10.0% 7.0% 4.4%
1.7% boundaries of Surrey.
0.0%
15 15-30 30-45 45-60 over one N/A
minutes minutes minutes minutes hour
or less
12 businessinsurrey.comThe following information is related to travel during the day to meetings, sales calls, etc.
Overall, the pattern for number of hours travelled per day has been declining since 2017.
The pandemic has made a large impact on the increase in Respondents that do not drive for
the purpose of their work.
Hours per Day
70
60
50
40
30
20
10
0
2016 2017 2018 2019 2020
0 hours 1 to 2 3 to 5 6 to 8 More than 8 N/A
We asked Respondents that if they did drive for business purposes, where did they do most
of their driving? Respondents in 2020 travelled mostly within the Metro Vancouver Region,
including within Surrey, although less so than the previous four years. We saw an increase
in Respondents travelling within Surrey compared to the previous 4 years, and many more
that did not travel (N/A) as part of their business.
Business Destinations
60
50
40
30
20
10
0
2016 2017 2018 2019 2020
Within Surrey Mostly Surrey, and some travel to other munici palities South of the Fraser
Through most municipalities South of the Fraser Mostly within the Metro Vancouver Region, North and South of Fraser
Travel beyond Metro Vancouver Other (please specify)
N/A
inclusive | innovative | independent 132021 Surrey Roads Survey
EMPLOYEES TRAVEL FOR BUSINESS
Respondents were asked to assess the work-related travel by other employees in their
company or business. In 2020, employees and employers saw that others were travelling
less for business, except for the 21-40% range.
In 2019, we saw
Workforce Travel that more of the
40 workforce was
Percentage of Respondents
35 travelling for work.
30
The 2019
25
2016 percentage of
20
2017 respondents
15
2018 travelling for 91-
10
2019 100% of the
5
0 2020 workday have not
reached 2016
A
0%
0%
0%
0%
0%
0%
0%
91 %
%
%
N/
0
10
00
baseline levels but
-2
-3
-4
-5
-6
-7
-8
-9
0-
-1
11
21
31
41
51
61
71
81
Percentage of Travel as Part of a Workday is substantially
higher than that of
2017 and 2018. The percentages chosen are “guestimates” made by respondents and are
not likely to be an accurate reflection on the travel patterns of a company, particularly a
larger business. However, with sufficient data accumulated over the years, a pattern was
beginning to emerge. COVID-19 and the economic shutdowns associated had created a
skewed result, but it is interesting for comparison and impact purposes.
Despite relying on
Average Employee Travel Time the guestimations
70 of Respondents,
60 2017 to 2020
50 results for the
2016 2017 2018 2019 2020
40 estimated travel
30 time of employees
20
are very similar. In
10
2017, 2018 and
0
0 1-2 3-4 5-6 7-8 More than 8
2019, an increase
of over 10% (13%,
11%, and 10%
respectively) from the 2016 baseline for 1-2 hours is observable. In 2020, we observe a
modest increase of 4.2% when compared to 2016.
14 businessinsurrey.comInterestingly, more individuals spent no time in traffic for business purposes, excluding
commuting to and from work. In 2020, 29.6% of respondents estimated that employees
spent 0 hours in traffic. That is higher than the baseline of 28.6% in 2016. This may be
attributed to people driving less for work due to the pandemic.
BARRIERS TO CHOOSING ALTERNATIVE MODES OF TRANSPORTATION
This year, we asked whether employees/staff have barriers to choosing an alternative to
driving to their place of employment.
Do your employees/staff have barriers to choosing an alternative to driving
to their place of employment?
40.0%
35.0%
30.0%
25.0%
20.0%
15.0%
10.0%
5.0%
0.0%
There are no barriers, No transit service Infrequent or limited Lack of sidewalk No safe cycling No cycle parking or end Other (please specify)
staff have multi modal coverage hours of transit service facilities to job place infrastructure of trip facilities
options to access the
job place
36.5% of Respondents indicated that there is no barrier, while a significant portion indicated
that there is a barrier. Some Respondents that chose other indicated details such as lack of
transit running north and south through Surrey, that all of the noted barriers were
applicable to them, that they work from home or have no employees. Some also indicated
that due to their work and the need to make trips often and at random times, alternatives
to driving were not feasible.
inclusive | innovative | independent 152021 Surrey Roads Survey
TRAFFIC CONGESTION AND ITS IMPACTS ON BUSINESS OPERATIONS
This year, a question on congestion’s impact on business was added. Impact could be
characterized as customers experiencing longer delivery times, employees/employers
experiencing unpredictable travel times between job sites, uncertain times to ship or
receive goods/service, etc. The majority of Respondents indicated that traffic has some
impact on business operations.
Traffic Congestion and its Impacts on Business Operations
60.0%
40.0%
20.0%
0.0%
Traffic congestion has limited to My business is somewhat My business is significantly
no impact on my business impacted by increasing traffic impacted by increasing traffic
operations congestion congestion
MANAGING INCREASING VEHICLE TRAFFIC CONGESTION
There are three key strategies to respond to increasing vehicle traffic congestion and delays:
managing traffic demand through the provision of mobility options (transit, walking, and
cycling) and pricing to limit growth in vehicle trips and increase trips through all other
modes; improving efficiency through safety and operational improvements that reduce
collisions, improve reliability, and increase network performance, which will accommodate
and encourage a modest increase in vehicle trips; and increasing capacity through
expanding the road network on selected corridors and connections to provide for, and
encourage, a large increase in vehicle trips.
We asked respondents to rank managing traffic demand, improving efficiency, and
increasing capacity1. It is clear that improving efficiency is the most important method for
managing traffic.
Most Important for Managing Traffic Demand
3.4
3.2
3
2.8
2.6
Managing traffic demand Improving efficiency Increasing capacity
1
The graph is a weighted average. For full details refer to appendix 2 on page 37.
16 businessinsurrey.comCITY ROADS AND PROJECTS
Each survey features several questions designed by the City of Surrey staff as part of their
information gathering. The City of Surrey has a 10-year plan for road improvement projects.
Priorities are evaluated annually with major projects taking approximately 3 years, from
planning to completion. As these differ annually, there are no comparatives. Respondents
were also given an opportunity to recommend projects to the city staff, and many were
suggested.
Of the identified projects, respondents were asked to select their top three choices. These
are included here in order of preference. 2 For the full table, please go to Appendix 2, page
38 and 39.
ROAD CORRIDORS
1. Fraser Highway: Widen to 4 lanes between Whalley Boulevard 63.2%
and 148 Street, including through Green Timbers Park
2. 152 Street: Widen to 4 lanes from 40 Avenue to 50 Avenue 52.9%
3. 64 Avenue: Widen to 5 lanes between 176 Street and Fraser 51.7%
Highway
The corridor chosen by most respondents was likewise, and with a very similar result,
chosen by respondents in 2019. This is a priority for businesses.
About 21% of the Respondents had suggestions in addition to those provided by the city.
There were requests for additional lanes, repaving of roads, and instructions regarding
traffic lights. See appendix 2, page 39 for the entire list.
2
Totals will not add up to 100 since respondents were asked to choose their top 3.
inclusive | innovative | independent 172021 Surrey Roads Survey
CONNECTIONS
The City of Surrey has been considering closing several network gaps in order to improve
connectivity. Respondents were asked to pick their top three priorities. Of the choices
given, new construction along Whalley Boulevard connecting Fraser Highway to 96 Avenue
was preferred, with a 20 Avenue Overpass as second.
Connection Improvement Priorities
84 Avenue: New construction from 124
St to 128 St
61.2% 42.4% Whalley Boulevard: New construction
from Fraser Highway to 96 Avenue
68.2% 128 Street: New construction from 108
54.1% Ave to King George Blvd
43.5% 192 Street Diversion: New construction
from Fraser Hwy to 68 Ave
20 Avenue Overpass: A new Hwy 99
overpass and improvements to 152 St
Over 17% of Respondents provided alternative choices. See appendix 2, page 40 for the full
list of responses.
“Add on/off ramps at 152 Street, 24 Avenue and 20 Avenue to stop the congestion on the
few access ramps existing.”
INTERSECTIONS
Of the 4 choices provided, the following were the top three priorities for Respondents.3
1. 64 Avenue and 168 Street 74.7%
2. 104 Avenue and 156 Street 73.5%
3. Fraser Highway and 184 Street 71.1%
Various intersections on Fraser Highway, and King George Boulevard dominated the
recommendations by the 20.5% of Respondents who provided additional suggestions. For a
full list of alternative recommendations, see appendix 2, page 41.
3
Totals will not add up to 100 since respondents were asked to choose their top 3.
18 businessinsurrey.comBIKE SHARING IN SURREY
Innovation is a necessary part of a city’s growth. As a result of many Surrey Board of Trade
led initiatives and policies, we added a question to the yearly survey asking respondents
whether they would be more likely to bike to work if Surrey had bike sharing. The responses
were heavily against with close to 46.5% of respondents indicated that it is very unlikely.
How likely would you be to cycle to work if Surrey
had bike sharing?
50.0%
45.0%
40.0%
35.0%
30.0%
25.0%
20.0%
15.0%
10.0%
5.0%
0.0%
Very likely Likely Somewhat Neither Somewhat Unlikely Very
likely likely nor unlikely unlikely
unlikely
While there is little interest in biking within Surrey to work, there are some that would very
likely or somewhat likely consider it (14.9%). With this indication in mind, it is important to
understand why these respondents would or would not cycle to work with bike sharing.
The Surrey Board of Trade released a survey mid-2019 asking about input into TransLink’s
Transport 2050 plan. The questions also included one on taking multiple modes to and from
work. The main issue that was heard was that the city is not connected enough to allow
people to get to work, and that there are not enough jobs within Surrey itself. Additionally,
the fact that transit is so unreliable, and the city is geographically large, cycling is not an
option for many.
inclusive | innovative | independent 192021 Surrey Roads Survey
TRANSIT
Respondents rated a number of proposed transit projects that the City of Surrey is
considering or has already started to work on. The top three transit improvement projects
that respondents indicated we should have and definitely need include4:
1. Rapid transit on Fraser Highway between City Centre and
Langley 79.3%
2. Rapid transit between Guildford, City Centre and Newton on
King George Boulevard and 104 Avenue 67.8%
3. New B-Line bus service to South Surrey/White Rock/ New bus
service to neighbourhoods not served by transit 66.7%
There may be debate around the technology, but there is no denying a strong need for
improved transit and improved connection within Surrey.
Required Transit Improvement
Enhanced bus stops, shelters, benches, and sidewalk access
improvements
Later bus service on select routes
New bus service to neighbourhoods not served by transit
More frequent service on existing bus routes
New B-Line bus service to South Surrey/White Rock
New B-Line bus service on Scott Road and 72 Avenue
Rapid Transit on Fraser Highway between City Centre and
Langley
Rapid Transit between Guildford, City Centre and Newton on
King George Boulevard & 104 Avenue
0.0% 10.0% 20.0% 30.0% 40.0% 50.0% 60.0% 70.0% 80.0% 90.0%100.0%
Not really necessary Somewhat necessary Would be good to have Should have Definitely need it N/A
Least favoured, again, is a B-Line bus service along Scott Road, which was reflected in 2017,
2018 and 2019. This year, only 43.7% of Respondents felt that this mode is something we
should have and definitely need.
Respondents were given a final opportunity to comment, and many were flagged for future
consideration in both the annual survey and the City of Surrey’s planning. Respondents
recommended rapid transit along north-south routes; improved transit to Campbell
4
Totals will not add up to 100 since respondents were asked to choose their top 3.
20 businessinsurrey.comHeights; transit between Guildford Town Centre and Coquitlam Mall; and increased access
to small buses providing access to B-Line collector points.
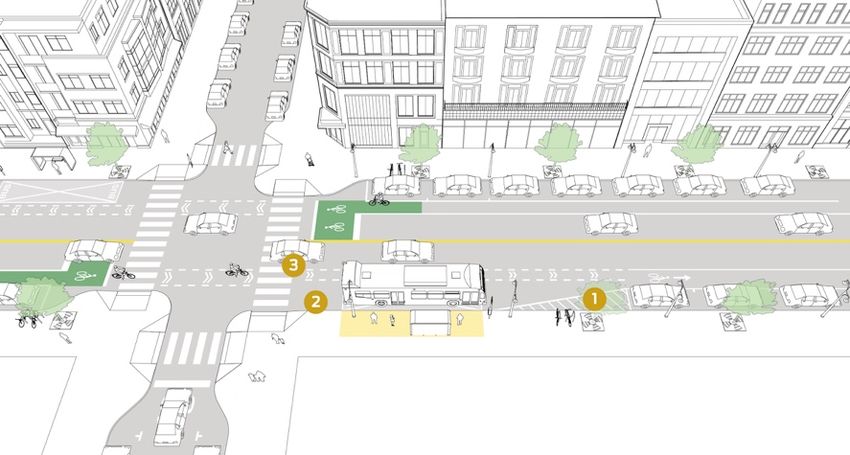
CURBSIDE PULL-OUTS
Innovation in road layout is a key aspect of reducing congestion. Curbside pull-outs allow
buses to move out of the way of traffic. This allows for limited congestion as cars are not
stopping behind the buses when they pick up or drop off passengers.
We asked respondents this year to rank curbside pull-outs and their effectiveness on
reducing traffic and congestion. Respondents indicated that pull-outs are important for
reducing congestion.
40.0%
35.0%
30.0%
25.0%
20.0%
15.0%
10.0%
5.0%
0.0%
Extremely Very important Somewhat Not so important Not at all
important important important
inclusive | innovative | independent 212021 Surrey Roads Survey
We also asked respondents how effective curbside pull-outs along arterial roadways such as
104 Avenue, Fraser Highway, King George Boulevard, 128 Street, 72 Avenue, 88 Avenue,
and others would be at reducing congestion. The vast majority (83.9%) indicated that it
would be effective in reducing congestion.
90.0%
80.0%
70.0%
60.0%
50.0%
40.0%
30.0%
20.0%
10.0%
0.0%
Effective Not effective No opinion Other (please specify)
22 businessinsurrey.comROAD SAFETY
The City of Surrey has launched a Surrey Vision Zero: Safe Mobility Plan. Respondents were
asked to contribute their thoughts on how to make Surrey roads safer for all users.
Rank of Vision Zero Principles
Speeding in my community is a high concern.
We all need to do our part to keep our most
vulnerable road users safe.
Use data and best practice to determine the
areas where road improvements should be
made.
Safety work should focus on systems-level
changes more than influencing individual
behaviour.
It's a shared responsibility between users and
designers/maintenance.
Traffic fatalities and serious injuries are
preventable.
No loss of life is acceptable on Surrey roads.
0.0% 20.0% 40.0% 60.0% 80.0% 100.0%
Strongly Agree Agree Neutral Disagree Strongly Disagree
In a three-way-tie, 96.6% of respondents indicated that they either agree or strongly agree
that use of data and best practice to determine the areas where road improvements should
be made, that we all need to do our part to keep our most vulnerable road users safe and
that it is a shared responsibility between users and designers/maintenance.
For further information on this initiative, go to City of Surrey’s Safe Mobility Plan:
https://www.surrey.ca/city-services/12174.aspx.
inclusive | innovative | independent 232021 Surrey Roads Survey
When asked whether reducing speed limits on some roads would help reduce collision
rates in Surrey, 50.6% of the Respondents said no. Only 31% said yes and 18.4% did not
know.
Do you think lower speed will reduce
collisions in Surrey?
60.0%
50.0%
40.0%
30.0%
20.0%
10.0%
0.0%
Yes No Don't know
However, if the City of Surrey were
Decrease speeds... In residential areas
to decrease speeds as a safety
measure, respondents were asked to
choose their top three priorities. The 11.5% Near elementary schools (on
12.6% local and collector roads)
results were not surprising.
Near secondary schools (on
11.5% of respondents gave further 75.9% local and collector roads)
11.5% 36.8%
suggestions. Improving roadways and
In commercial areas
networks, reduce speeds around
hospitals and busy cross walks, traffic
Near facilities for seniors
light efficiencies, reduce speeds near 54.0%
parks, and increased speed 82.8%
On arterials, the main roads
monitoring and enforcement
through the city
measures were all listed.
Other suggestions?
“Around hospitals and busy crosswalks, and near parks.”
“Improve arterial roadways and side street issues will inherently reduce. Frustration drives
excess speed in many cases.”
24 businessinsurrey.comRIDESHARING SERVICES
Ridesharing was facing significant restrictions in Surrey. Only recently did Surrey’s Mayor
and Council issue Uber with a business license. Ridesharing companies such as Uber have
cited concerns about restrictions for pick up and drop off locations, variable business
licensing requirements, and the inability to offer discounts to riders.
We asked in this survey how important it is to have ridesharing without pickup location
restrictions. Nearly 51.7% of Respondents indicated that it is very important and extremely
important to them. Respondents that answered other indicated that they did not use the
service and that the rules should be the same for taxis.
Ridesharing services without pickup location restrictions
are...
27.6% 24.1%
30.0%
17.2% 17.2%
20.0%
8.1% 5.8%
10.0%
0.0%
Extremely Very Somewhat Not so Not at all Other (please
important important important important important specify)
inclusive | innovative | independent 252021 Surrey Roads Survey
MAJOR INFRASTRUCTURE
Bridges, tunnels and highways impact daily travel whether a commuter is taking those
routes or not. Congestion negatively impacts business. We asked our members whether
they traveled across the Fraser River and to give their opinion on how the crossings could
be improved.
PATTULLO BRIDGE
Do you use the Pattullo Bridge while travelling for Respondents were unequivocal on
business? what they want available on the
1.2%
Yes, daily opening day of a new bridge.
8.1%
The project is currently planning to
Yes, 2 or 3 times a week
29.9%
21.8% have four lanes, along with wide
Sometimes, a few times a
month sidewalks and cycling lanes. The
Sometimes, a few times a
year
new bridge as planned will have the
39.1%
No, not for business capability of being converted to six
travel
lanes if required in the future. The
Surrey Board of Trade has
advocated for six lanes to be available on opening day and this is strongly supported by
members.
Respondents were given an option to provide other thoughts on the Pattullo crossing. Three
themes dominated:
Should the Pattullo Bridge have 6 lanes on • Build it wider now to serve
opening day? future population growth as it is
13.8% cheaper to open it at six lanes today
than it will be in the future
Yes • Increase capacity in New
11.5%
No Westminster to allow for six lanes
74.7% Don't know on the off/on ramp now
• Safe access and crossing for
bicycles and pedestrians are
paramount
“The new bridge will likely stand for around 50 years. Plan for the next 50 years.”
“For future growth of Surrey, it must be wide to accommodate the increased traffic coming
to Surrey from Vancouver, Burnaby, etc.”
26 businessinsurrey.comMASSEY TUNNEL
The George Massey Tunnel is 61 years old and connects Delta with Richmond under the
Fraser River. It is also the major crossing for those using Highway 99 through the City of
Vancouver to the Peace Arch Border and Interstate 5 in the USA. Interstate 5 runs
uninterrupted from the Canadian border down to the Mexican border and is arguably West
Coast USA’s “backbone.” All of this is to point out the importance of a 10-lane bridge
Do you use the Massey Tunnel while travelling for
crossing.
business?
1.2%
No one argues that traffic, especially
6.9% Yes, daily
during peak hours, has far exceeded
Yes, 2 or 3 times a week
the tunnel’s capacity. However, there
39.1%
26.4%
Sometimes, a few times a
is ongoing debate regarding the
month
Sometimes, a few times a year
Massey Tunnel replacement. Only
No, not for business travel
1.2% use the tunnel daily, and a total
26.4%
of 34.5% use it frequently (daily to a
few times a month).
Although there has been a decrease in traffic along the Massey Tunnel due to the
pandemic, they had strong opinions on what should be done to improve the crossing.
The former Liberal Provincial Government administration started work on a 10-lane bridge
to replace the tunnel. The Surrey Board of Trade supported this proposal as many Surrey
business members would use the crossing.
Massey Tunnel Replacement
No bridge and no more tunnels, upgrade the
existing ones
No bridge, add another tube to the Massey tunnel
and upgrade existing ones
I would like to see the results of the provincial
report before deciding
I would like a bridge to replace the tunnel, but
with fewer lanes
I would like to see the Massey Tunnel replaced
with a bridge
0.0% 10.0% 20.0% 30.0% 40.0% 50.0% 60.0%
Unfortunately, the bridge construction was put on hold by the current Provincial
Government. The new Metro Vancouver Mayors’ Council has opted to recommend an 8-
lane tunnel to the Provincial Government.
52.9% of Respondents preferred wanting the originally planned 10-lane bridge. Adding
another tube was selected by 18.4% of respondents. Upgrading the existing tube was
inclusive | innovative | independent 272021 Surrey Roads Survey
selected by 3.5% of Respondents. A bridge with fewer lanes was selected by 3.5% of
Respondents.
“Include 2 lanes for future LRT tracks. Make Transit the #1 priority for the crossing, ahead of
the car traffic priority.”
Very few respondents thought that all crossings, including the Alex Fraser Bridge, the
Golden Ears Bridge, and the Port Mann Bridge, were fine as is. The comments for both
transit routes (27.1% Respondents commented) and final comments (24% Respondents
commented) are summarized as follows:
• Improve the connections and arteries before and after bridges.
• Lighting on the bridges need to be enhanced.
• Decisions on infrastructure enhancements must be expedited.
• There needs to be less interference in previously set plans such as LRT and the
Massey Tunnel replacement.
• Utilize pressurized traffic lights.
• South Fraser Perimeter Road needs more interchanges.
• Optimize rail and transit on Fraser River crossings.
• Increase speed on Highway 17 to 100 km/h.
• Variable speed zones should be investigated on Highway 17.
• Add more crossings, not just widen existing ones, e.g., connect the Highway 91 East-
West Connector to the bottom of Boundary Road.
• A cohesive regional plan for transit / traffic flow is needed.
• LRT in Surrey needs to be reconsidered.
• Sidewalks must be built when new schools are built.
• When underground piping enhancements/replacements are made, supervision and
quality of work must be priority. Roads that are repaired need replacement very
quickly and compromises safety.
28 businessinsurrey.comAPPENDIX 1 – Respondents in Detail
Responding to the survey is voluntary. Who chooses to respond, their industry or sector,
and their particular concerns influences the data collected. Three questions are consistently
asked for each survey implemented by the Surrey Board of Trade: whether they are
employers or employees; how large is the organization for which they work; and what
industry they work within. All response data is presented in percentages.
Measured against our baseline from 2016 (implemented early September), there was a 30%
increase in respondents for 2017 (implemented mid- to late October), a 7% increase for
2018 (implemented late November to early December), and a 35% increase in responses in
2019. In 2020, there was an increase of 51.8% when compared to 2016, the largest
increase.
RESPONDENT CATEGORY
45
40
35
30
25
20
15
10
5
0
An Employer? An Employee? Self-Empl oyed Other (please specify)
2016 2017 2018 2019 2020
From 2016-2018, there is the beginning of a trend with more employees responding while
employers slightly increasing, contrasted by 2019. In 2020, employers reported at the
lowest level, while employees, self-employed individuals, and others rose.
inclusive | innovative | independent 292021 Surrey Roads Survey
The majority of
Organization Size organizations in 2020 fall
35 within the range of sole
30 contractor to 10
25
20
employees (51.9%).
15 48.1% of Respondent’s
10 organizations have 11 to
5
0
100+ employees. Surrey
Sole 1 to 5 6 to 10 11 to 50 51 to 100 Over 100 and the Surrey Board of
contractor employees employees employees employees employees
or
Trade are primarily
consultant comprised of small to
2016 2017 2018 2019 2020 medium-sized
enterprises5 and that is
reflected in this survey. There has been a 2% increase in home-based business licenses
issued when looking at 2019 compared to 2018, and an increase of 4.1% in
commercial/industrial business licenses.6
Top 10 Industry Respondents in 2020
20 2016 2017 2018 2019 2020
15
10
5
0
e
es
ce
es
h
g
n
n
g
e
in
nc
rin
ad
tio
io
ec
vic
vic
an
as
ct
ra
c,T
Tr
tu
ea
ist
er
er
tru
Le
su
ac
le
cr
ifi
rS
lS
ss
In
ns
nd
sa
uf
nt
Re
lA
na
he
Co
le
an
d
cie
a
nd
cia
an
io
Ot
ho
al
M
l, S
at
ta
nt
So
W
ce
uc
na
e
en
an
d
R
Ed
sio
an
m
d
Fin
an
in
es
re
ta
of
te
Ca
er
Pr
ta
h
nt
Es
alt
,E
al
He
ts
Re
Ar
5
According to the Organization for Economic Cooperation and Development, small firms are comprised of less
than 50 employees, while medium enterprises have an upward limit of 250
6
https://www.surrey.ca/business-economic-development/1498.aspx
30 businessinsurrey.comAlso tracked are the different industries that are represented by Respondents. To be
consistent, the Surrey Board of Trade uses the North American Industry Classification
System (NAICS). NAICS is used by business and government to classify business
establishments according to type of economic activity (process of production) in Canada,
Mexico, and the United States of America.
Respondents have consistently fallen into the same top ten industry or business type from
2016-2018. Five new industries emerged in the 2019 survey that had not been accounted
for in previous iterations including: Transportation and Warehousing; Information and
Cultural Industries; Wholesale Trade; Accommodation and Food Services; and Public
Administration. In 2020, we see some industries drop and others gain. This survey saw the
addition of Wholesale Trade to the top 10 industries represented.
There was a large increase in Respondents from the Arts, Entertainment and Recreation
category compared to 2019. Construction, Real Estate and Rental and Leasing, and Health
Care and Social Assistance all saw remarkable increases this year. These businesses have
thrived during the COVID-19 pandemic, especially in Metro Vancouver. Surrey has seen
rapid construction permit approvals for large scale development projects.
inclusive | innovative | independent 312021 Surrey Roads Survey
APPENDIX 2 – Responses in Detail
The following are the questions and responses that are asked annually. There are some new
questions that were added. All answers are in percentages unless otherwise indicated. The
numbers are rounded to the first decimal and therefore the total may not add up to 100%.
RESPONDENTS
Are you: 2016 2017 2018 2019 2020
An Employer? 39.8 40.7 37.4 39.5 30.2
An Employee? 33.7 38.9 41.8 36 38
Self-Employed, Contractor, 26.5 16.7 13.2 21.2 25.6
Consultant?
Other (please specify) 0 3.7 7.7 3.5 6.2
For 2020, Other comments included retired.
SIZE OF ORGANIZATION BY NUMBER OF EMPLOYEES
How many individuals (including FT,
PT, casual, temporary/term, and
regular contractors) are employed by 2016 2017 2018 2019 2020
your company?
Sole contractor or consultant 15.3 9.2 9.9 11.4 21.7
1 to 5 employees 16.5 15.6 15.4 23.6 22.5
6 to 10 employees 14.1 16.5 11.0 12.3 7.8
11 to 50 employees 25.9 19.3 23.1 21.9 20.2
51 to 100 employees 4.7 13.8 9.9 7 7
Over 100 employees 23.5 25.7 30.8 22.8 20.9
32 businessinsurrey.comRESPONDENTS BY INDUSTRY – TOP 10
Which category would best describe
your company? (NAICS based choices) 2016 2017 2018 2019 2020
Construction 6 4.6 9.9 7 13.2
Manufacturing 13.1 10.2 7.7 7 7
Finance and Insurance 16.7 15.7 18.7 13 12.4
Arts, Entertainment, and Recreation 1.2 4.6 5.5 1.7 6.2
Other Services (except Public
Administration) 11.9 17.6 7.7 13 11.6
Wholesale Trade 3.6 1.9 3.3 2.6 4.7
Professional, Scientific, Tech 15.5 11.1 9.9 18 14
Real Estate and Leasing 8.3 5.6 3.3 2.6 6.2
Educational Services 3.6 4.6 7.7 7.8 5.4
Health Care and Social Assistance 7.1 5.6 7.7 6 10.1
COMMUTING IN SURREY
How you get to and from work is as much a part of your workday as your business needs.
The choices below focus on Surrey. Do you: 2016 2017 2018 2019 2020
Live and work in Surrey 51.8 51.9 51.6 53 57.4
Live in Surrey, work South of Fraser 4.7 6.5 4.4 3.5 5.2
Live in Surrey, work in Metro Vancouver 7.1 7.4 8.8 8.7 9.6
Live in Surrey, work outside Metro Vancouver 1.2 2.8 1.1 0.9 0
Work in Surrey, live South of Fraser 14.2 10.2 9.9 17.4 12.2
Work in Surrey, live in Metro Vancouver 10.6 10.2 12.1 6.1 9.6
Work in Surrey, live outside Metro Vancouver 0.0 3.7 0.0 2.6 0.9
Live and work outside Surrey 2.4 3.7 3.3 7 1.7
Other 8.2 3.7 9.9 1 3.5
inclusive | innovative | independent 332021 Surrey Roads Survey
How do you usually get to work? 2016 2017 2018 2019 2020
Drive own vehicle 87.1 92.6 81.3 92.9 83.5
Use transit 4.7 0.9 4.4 0.9 6.1
Cycle 0.0 0.0 1.1 0 0
Walk 2.4 0.9 6.6 1.8 4.4
Carpool 1.2 1.9 2.2 2.7 0
Other 4.7 3.7 4.4 1.8 6.1
The other Respondents in 2020 indicated that they work from home.
RESPONDENTS WORK RELATED TRAVEL
Do you usually travel during your workday
as part of your job? E.g., sales calls, goods 2016 2017 2018 2019 2020
deliveries, customer services, etc.
4 or more days per week 29.4 28.7 24.4 31.3 20
Often, at least 2–3 days per week 40.0 27.8 26.7 23.5 25.2
Sometimes, at least 2 to 5 days per month 20.0 25.0 28.9 28.7 25.2
Rarely, once a month or less 8.2 14.8 11.1 10.4 20
None 2.4 3.7 8.9 6.1 9.6
How long is your average commute one-way? 2020
15 minutes or less 20.0
15-30 minutes 45.2
30-45 minutes 20.0
45-60 minutes 7.0
Over one hour 1.7
N/A7 4.4
Other (please specify) 1.7
7
We added an option for not applicable on this year’s survey due to the pandemic.
34 businessinsurrey.comNot including your commute to work,
roughly how many hours do you travel 2016 2017 2018 2019 2020
a day as part of your business?
0 hours 16.5 25.2 22.5 25.2 34
1 to 2 56.5 61.7 56.2 52.2 56
3 to 5 22.4 10.3 15.7 20 12
6 to 8 3.5 2.8 5.6 1.7 1
More than 8 hours a day 1.2 0 0 0.9 0
N/A8 12
If you drive for business purposes where
2016 2017 2018 2019 2020
do you do most of your driving?
Within Surrey 18.1 16.0 15.9 20.4 22.6
Mostly Surrey, and some travel South of 22.9 22.0 14.8
Fraser 25.7 20
Through most municipalities South of 4.8 11.0 9.1
Fraser 5.3 8.7
Mostly within Metro Vancouver, north 45.8 46.0 55.7
and south 46 32.2
Travel beyond Metro Vancouver 1.2 3.0 1.1 2.7 1.7
N/A9 13.9
Other 7.2 2.0 3.4 0 0
8
We added an option for not applicable on this year’s survey due to the pandemic.
9
We added an option for not applicable on this year’s survey due to the pandemic.
inclusive | innovative | independent 352021 Surrey Roads Survey
EMPLOYEES TRAVEL FOR BUSINESS
Roughly what percentage of your
company’s workforce travel as part of 2016 2017 2018 2019 2020
their workday?
1-10% 35.7 35.8 25.6 29 29.6
11-20% 8.3 14.7 14.4 16.7 14.8
21-30% 9.5 9.2 18.9 6.1 12.2
31-40% 3.6 5.5 2.2 4.4 6.1
41-50% 7.1 4.6 6.7 8.8 1.7
51-60% 7.1 7.3 11.1 4.4 4.4
61-70% 2.4 1.8 3.3 1.8 3.5
71-80% 2.4 6.4 4.4 6.1 3.5
80-90% 3.6 4.6 4.4 9.7 1.7
91-100% 20.2 10.1 8.9 13.2 7
N/A10 15.7
Not including commuting time, roughly
how many hours per day does the 2019 2020
2016 2017 2018
average employee in your company
spend travelling for business?
0 hours 28.6 20.2 21.6 25.2 29.6
1 to 2 hours 48.8 62.4 60.2 52.2 53
3 to 4 hours 20.2 11.0 11.4 20 8.7
5 to 6 hours 1.2 3.7 3.4 1.7 5.2
7 to 8 hours 1.2 0.0 1.1 0.9 2.6
More than 8 hours 0.0 2.6 2.3 25.2 .9
10
We added an option for not applicable on this year’s survey due to the pandemic.
36 businessinsurrey.comDo your employees/staff/co-workers
have barriers to choosing an alternative
2020
to driving to their place of
employment?
There are no barriers, staff have multi
modal operations to access the job 36.5
place
No transit service coverage 15.7
Infrequent or limited hours of transit
27.8
service
Lack of sidewalk facilities to job place 4.4
No safe cycling infrastructure 2.6
No cycle parking or end of trip facilities 0.0
Other (please specify) 13.0
Due to type of work and business needs, alternatives are not applicable.
Limited transit and flexibility for banking, picking up parts, lunches etc.
Place of work is home in terms of daily office, no barriers
Have no staff, just sub-contractors
Always going to different places
Transit service is poor, with limited hours of service, lack of sidewalks, multiple answers
to this question
Lack of TransLink/LRT running north/south in Surrey
Downtown area is very unsafe to walk, all the homeless and drug dealers hang out there
hence can’t walk to work.
STRATEGIES TO MANAGE TRAFFIC DEMAND
To what degree are your business operations impacted by traffic
congestion? E.g. through longer delivery times, unpredictable travel
times between job sites, uncertain times to ship or receive
goods/service, etc.
Traffic congestion has limited to no impact on my business operations 25.7
My business is somewhat impacted by increasing traffic congestion 50.5
My business is significantly impacted by increasing traffic congestion 23.8
inclusive | innovative | independent 372021 Surrey Roads Survey
To what degree are each of these Not Somewhat Very
strategies important to you? important important Important important
Managing traffic demand 7.9 26.7 28.7 36.6
Improving efficiency 3.0 11.0 34.0 52.0
Increasing capacity 8.0 18.0 26.0 48.0
CITY ROADS AND PROJECTS
City roads, intersections, and projects change annually. All data are in percentages unless
otherwise indicated. Results have been rounded to the first decimal and may not add up to
100%. Further, the options have been re-ordered to reflect order of choices.
Indicate which of the following Road Corridors would be your top 3
priorities for improvement – please choose only 3
Fraser Highway: Widen to 4 lanes between Whalley Boulevard and 148
Street, including through Green Timbers Park 63.2
32 Avenue: Widen to 4 lanes from Croydon Diver to 188 Street 40.2
64 Avenue: Widen to 5 lanes between 176 Street and Fraser Highway 51.7
132 Street: Widen to 4 lanes between 71 Avenue and 96 Avenue 32.2
152 Street: Widen to 4 lanes from 40 Avenue to 50 Avenue 52.9
South Surrey/Highway 99 Interchanges: Capacity improvements at key
interchanges including 24 Avenue, 32 Avenue, and 152 Street (overpass 48.3
and widening)
Didn’t see your priority? List it below: 20.7
184 Street - double lane starting from 64th Avenue to 92 Avenue
More on/off ramps for Highway 99
Port Kells and 96 Avenue needs two more traffic lights to slow down traffic speed
and allow transit riders to cross the road safely
Widen 148 Street to 4 lanes between 88 Avenue and 108 Avenue
140 Street: Widen to 4 lanes from 88 Avenue to 92 Avenue.
Fraser Highway / 176 Street intersection overpass
Repaving on existing roads
38 businessinsurrey.comYou can also read