CapitaLand Limited Creating Asia's Leading Diversified Real Estate Company - March/April 2019
←
→
Page content transcription
If your browser does not render page correctly, please read the page content below
CapitaLand Limited
    Creating Asia’s Leading Diversified Real Estate Company

                          March/April 2019

1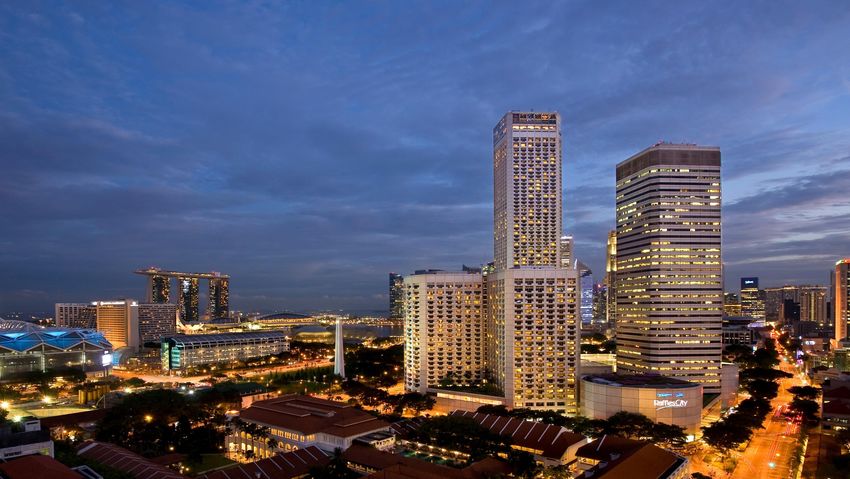
Disclaimer

    This presentation may contain forward-looking statements that involve risks and uncertainties.
    Any actual future performance, outcomes and results may differ materially from those
    expressed in forward-looking statements as a result of a number of risks, uncertainties and
    assumptions. Under no circumstances should the inclusion of such information herein be
    regarded as a representation, warranty or prediction with respect to the accuracy of the
    underlying assumptions by CapitaLand or any other person or that these results will be
    achieved or are likely to be achieved. You are cautioned not to place undue reliance on these
    forward-looking statements, which are based on CapitaLand’s current view of future events.
    CapitaLand neither guarantees any future performance or event nor assumes any obligation to
    update publicly or revise any forward-looking statement.

    Unless otherwise stated or the context otherwise requires, definitions set out in the Glossary of
    the Circular to shareholders dated 22 March 2019 (the "Circular") shall apply throughout this
    presentation. Figures provided throughout this presentation (e.g. market capitalisation, AUM
    and GFA) are provided on the same bases as in the Circular.

2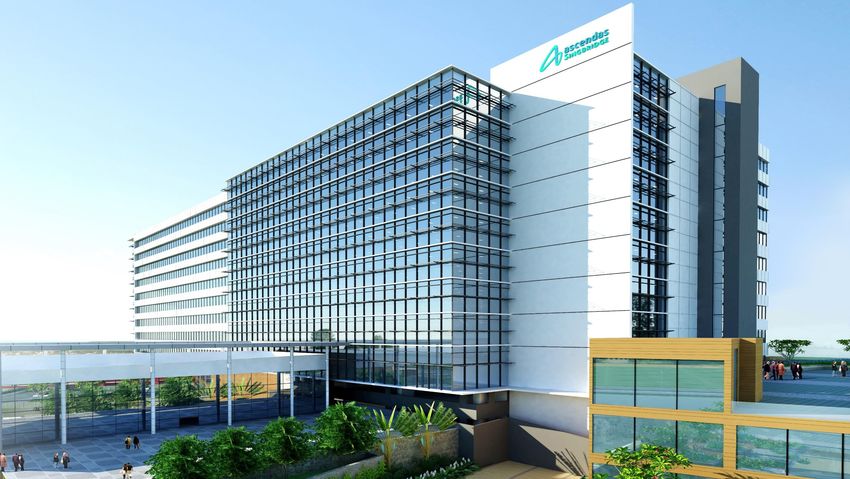
Contents

    •   CapitaLand 3.0 And What It Means

    •   Strategic Rationale For Ascendas-Singbridge Combination

    •   Creating Shareholder Value From The Combination

3
I. CapitaLand 3.0 And What It Means

                                          Raffles City Chongqing, China
4
“Creating Long-Term
    Shareholder Value By Targeting
    Sustainable Return On Equity
    Above The Cost Of Equity”

                                            Capital Tower, Singapore
5        CapitaLand Presentation May 2013
CapitaLand 3.0

    What It Means
                                     Scaling Up
                                         Responsibly
                             Singapore                            China
                                30%                                35%

                                            Capital
                                           Allocation
    Enhanced                                 Priority                       Developing
    Competitiveness                      Developed
                                           Markets
                                                     Emerging
                                                     Markets
                                                                            New Capabilities
                                             (50%)   (50%)
                             Other
                       Developed Markets                        India
                              20%                                10%
                                                 Vietnam
                                                    5%

         Harnessing An                                                              Asset     Fund
                                 Developer           Owner              Operator
    Integrated Value Chain                                                         Manager   Manager

6
CapitaLand 3.0

              Business Structure To Take CapitaLand Forward
                Organised To Optimise Integration & Drive Synergies

                                                         Singapore &                                                                           CapitaLand               Centres Of
                  China                                                                              India                Lodging
                                                        International1                                                                          Financial               Excellence

        Residential & Urban                                                                      Business Parks/
                                                            Residential                                               The Ascott Limited                                Urban Strategy
          Development2                                                                         Logistics/Industrial                             Managers of
                                                                                                                                           8 REITs/Business Trusts
                                                                                                                                           and 23 private funds      Business Communities
        Retail & Commercial                         Retail & Commercial
                                                                                                                                                                         Development

           Business Parks/                             Business Parks/                                                                                                 Retail Innovation
         Logistics/Industrial                        Logistics/Industrial

                                                                                                                                                                     Customer Services &
                                                                                                                                                                          Solutions

                                                                                                                                                                         Sustainability

                1 REIT and                                  4 REITs and                        1 Business Trust and      2 REITs and                                       Digital &
             12 Private Funds                             6 Private Funds                        3 Private Funds       2 Private Funds                                   Technology

         Fully integrated real estate platforms in                                              High growth,               Global           Highly scalable           Holistic approach
                       core markets                                                            new economy              standalone            standalone                to key Group
                                                                                                 exposure                platform3           management                    priorities
    Recurring income, balanced exposure in
                                                                                                                                                platform
               developed markets
    1   Includes Vietnam, Malaysia, Indonesia, Europe, USA, Australia, Japan and South Korea
    2   Urban Development refers to the Sustainable Urban Development (SUD) business
7   3   Present in more than 30 countries
CapitaLand 3.0

    Core Drivers

                                                               Efficient Capital Allocation Into
                       Employer Of Choice
                                            8            1     Core And Growth Markets

          Sustainable Growth For                                       Investing Into Growth Sectors
              Future Generations     7                           2     And Platforms
                                              Sustainable
                                            Return On Equity
                                                 Above
                                             Cost Of Equity            Maintain Balance Between Emerging
              Future Proofing Our
             Real Estate Platforms   6                          3      And Developed Markets

         Disciplined Capital Management
                                            5            4     Maintain High Quality Income

8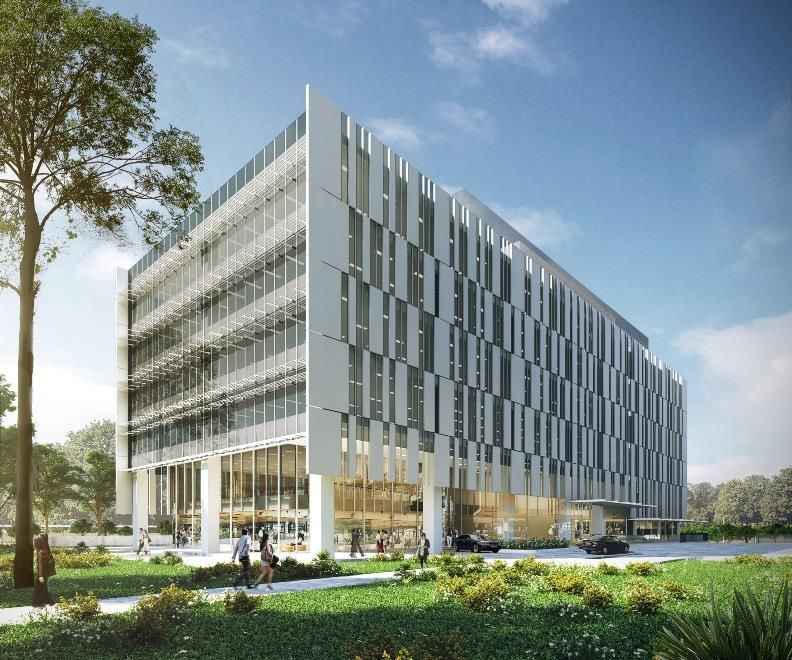
II. Strategic Rationale For Ascendas-Singbridge
    Transaction

9                                                     Ascent, Singapore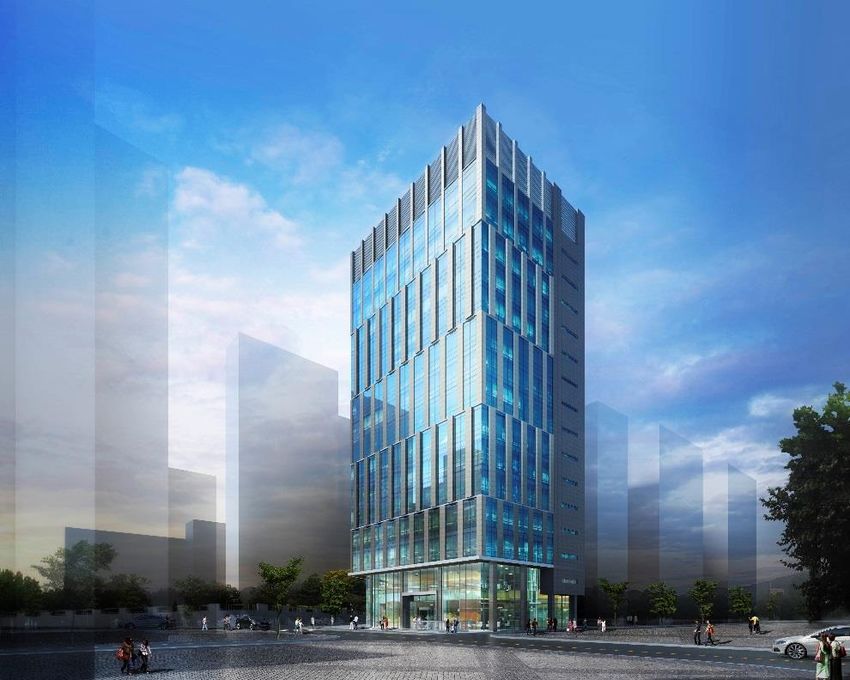
1      Efficient Capital Allocation Into Core And Growth Markets                                                                                                                                                      Singapore AUM
                                                                                                                                                                                                                              + China AUM
         Deepening Presence In Core Markets                                                                                                                                                                                       = S$93bn

       Scalable Presence Enhances Value Creation Potential Across Cycles                                                                                                                                                               75%
                                                                                                                                                                                                                                   of Total
               Complementary Footprint In Singapore                                                                                             Focused Within China’s 5 City Clusters                                               AUM1
                Numbers in circles indicate
                                                                                                                                                        CapitaLand’s presence
                GFA2 (mm sqft)
                                                            North                                                                                       ASB’s presence
                    CapitaLand GFA
                    ASB GFA                                                                                                                                                                                 Shenyang
                                                                        100%
                                                                                                                                                                                              Beijing
                                                                 4                                                                                                                                           Dalian

                                                                                                                                                                                                Tianjin
                           West                                                                  East
                                                           Central                                        5%
                                      16%
                                                                          92%
                                                                                                                                                                            Xian
                            20                                   7                                18                                                                                                    Nanjing
                                                                                                                                                                                                              Suzhou
                                                                                                                                                                  Chengdu            Wuhan                      Shanghai
                                                                                                                                                                                                            Hangzhou
                  84%                                                                                                                                                                                         Ningbo
                                                                         8%                                                                                       Chongqing
                                                              CBD                         95%

                                                                                                                                                                                   Guangzhou
                                                                 4        100%
                                                                                                                                                                                   Shenzhen

                                                            AUM                                                                                                                    AUM
Enlarged
Group                                                S$42bn                                                                                                                     S$51bn
What ASB Adds                                              +41%                                                                                                                    +6%
     Note: AUM and GFA as at 31 Dec 18
     1 Based on Enlarged Group total AUM of S$123.4bn; total Enlarged Group’s AUM adjusted for CapitaLand and ASB’s joint development of Raffles City Chongqing
     2 GFA based on completed and operating properties (excluding hospitality assets) on a 100% basis
10
1 Efficient Capital Allocation Into Core And Growth Markets India AUM
India: Key Contributor Of Growth Market Strategy = S$3bn
2%
Early Mover Advantage In Localised Market With High Barriers Of Entry of Total
AUM1
Strong and proven track record established over 25 years
Significant development / re-development potential
― Developable GFA2 spans ~5 mm sqm, with historical yield-on-cost at mid- to high- teens
Underpenetrated market in the growing logistics sector
― Establishment of JV with FirstSpace to enhance AUM growth
Full value chain with development and fund management capabilities backed by deep localised expertise
― Private funds and capital partnerships for strategic developments (AUM: S$0.8bn)
― Investment properties platform (a-iTrust) supports capital recycling activities (AUM: S$1.7bn)
ASB India Track Record
AUM3 (S$bn) EBIT4 (S$mm)
95.5
2.6 2.6 82.2
2.2
36.7
Mar 2017 Mar 2018 Dec 2018 FY 2017 FY 2018 LTM Sep 18
1 Based on Enlarged Group total AUM of S$123.4bn as at 31 Dec 2018
2 Developable GFA as at 31 Dec 2018; Includes actual or planned GFA and/or land area of landbanks and properties under development, but excludes hospitality assets
11
3 Includes value of a-iTrust assets on a 100% basis
4 Includes share of results from a-iTrust, which is equity accounted as an associate; growth in EBIT from FY 2017 to FY 2018 due largely to revaluation gains and writeback of provision in FY 20181 Efficient Capital Allocation Into Core And Growth Markets Vietnam
Australia AUM
/ USA /
Europe AUM
+ AU/USA/EU
Building Scale And Capabilities In Our Growth Markets = S$15bn
13%
Strong Development Potential And Recurring Income Generation of Total
AUM1
Vietnam Australia / USA / Europe
Bolt-on Capabilities To Our Established Platform Achieves Immediate Economies Of Scale
Balances global portfolio
Recurring, stable income
Residential Commercial Commercial
Logistics / Deep, mature real estate Lodging
Business Parks
markets
Retail Lodging USA has two monetisable Logistics /
Business Parks
portfolios at >S$2bn
CapitaLand ASB
AUM AUM
Enlarged
Group S$2bn S$13bn
Note: AUM as at 31 Dec 2018
1 Based on Enlarged Group's AUM of S$123.4bn
121 Efficient Capital Allocation Into Core And Growth Markets Potential to
Accelerate
Significant And Diversified Development Pipeline Future
Profitability And
104% Increase In Enlarged Group’s Developable GFA1 That Is Diversified Across The Portfolio Monetisation
Developable GFA1
Breakdown by geography Breakdown by sector Breakdown by type
Singapore Retail
6% 9% Projects under
SEA Commercial Residential development
11% 8% 83% 50%
Landbank
50%
6.8mm sqm 6.8mm sqm 6.8mm sqm
China
83%
Singapore
Retail Others³
Others² 4% 3%
4% Projects under
10% Commercial development
5% Residential 44%
104% China 43%
51% Business parks / Landbank
Enlarged logistics 56%
13.9mm sqm 13.9mm sqm 13.9mm sqm
Group4 17%
India
35%
Industrial
28%
Note: GFA as at 31 Dec 2018; “SEA” stands for Southeast Asia (excluding Singapore)
1 Developable GFA includes actual or planned GFA and/or land area of landbank and projects under development, but excludes hospitality assets
2 Others include Southeast Asia (excluding Singapore) and South Korea
3 Others include land for sale and data centres
13 4 The Enlarged Group’s total estimated developable GFA is based on the aggregate estimated developable GFA for CapitaLand and ASB (on a 100% basis), adjusted for joint development of Raffles City Chongqing by
CapitaLand and ASB1 Efficient Capital Allocation Into Core And Growth Markets
Significant Development Pipeline
Contributions From ASB’s Investment and Trading Projects In The Coming Years
Clear timeframe to Phase 1
income contribution ~434,0001 sqm ~57,000 sqm
Developable GFA Developable GFA
~S$109mm
Quality portfolio with FY 2018 PATMI
Expected
Completion
visible monetisation
in 1H 2020
Phase 2
potential China-Singapore Guangzhou Knowledge 79 Robinson Road,
MOU Signed2
City, China Singapore
ITPG-SEZ1 (Phase 2)
~210,000 sqm Phase 4
Developable GFA
~19,000 sqm
Expected Completion Developable GFA
in 1H 2021
Expected
ITPG-SEZ2 Completion
~96,200 sqm in 1H 2020
International Tech
International Tech Park Gurgaon, India
Developable GFA Park Pune, India
Note: All images of development projects featured are artist impressions
1 Includes land plots of CSGKC Phase 1 that are owned by ASB, excludes assets that have been contracted for sale but pending completion in 1H 2019
14 2 Based on ASB press release dated 12 Nov 20182 Investing Into Growth Sectors And Platforms Business Parks AUM
Achieving Immediate Scale In New Economy Sectors + Logistics AUM
= S$13bn1
10%
Sizeable Platforms And Proven Track Record
of Total
AUM1,2
Business Park S$9bn Logistics S$4bn
AUM AUM
AUM (S$bn) AUM (S$bn)
Increasing demand from Strong growth in e-commerce
knowledge economy and driving demand for space
tech-driven industries
2 REITs³, 1 private fund
9.2 2 REITs³, 2 private funds
Singapore: ~15 years of track
8.5 3.5 record through Ascendas Reit
Singapore: Deep presence as 2.6
one of the largest landlords,
Australia, UK: Established
Mar 2016 Dec 2018 and embedded rejuvenation Mar 2016 Dec 2018 logistics platform through
potential in Science Park 1 & 2
acquisitions by Ascendas Reit
Geographic Breakdown Geographic Breakdown
India: Pioneer in IT and business over the past 4 years
Singapore 63% Australia 35%
parks with >20 years of track
India 24% Singapore 35% India: Full-service development
record
China 13% UK 23% and ownership platform
Others2 Investing Into Growth Sectors And Platforms
Enhancing Fund Management Capabilities
Top 10 Global And Asia’s Leading Real Estate Investment Manager
Top 15 Global Real Estate Investment Managers – By Real Estate AUM1 (S$bn)
#9
228 #13
178
163 157 151 147
128 127 123 114 113 111 100 96 94 89
Brookfield PGIM Blackstone Hines MetLife TH Real CBRE Global UBS AM Enlarged Principal AXA IM - JPM AM CapitaLand Allianz AEW Invesco
AM Estate/Nuveen Investors Group Real Estate Real Assets Real Estate Real Estate
Investors
REIT and Fund Management Fees Largest S-REITS In 3rd party funds
S$326mm2 4 Key Sectors3 available for deployment:
>40%
~S$1.5bn4
From 8 Listed Trusts And 23 Private Funds
Source: IPE Real Estate Top 100 Investment Management Survey 2018 (as at 30 Jun 2018)
1 Figures as at 30 Jun 2018; assumed EUR to SGD of 1.00:1.59 except for CapitaLand and ASB which are based on 31 Dec 2018
2 Based on CapitaLand’s financials for the financial year ended 31 Dec 2018 and ASB’s fund management and trustee income for LTM ended 30 Sep 2018
16 3 Based on market capitalisation as at the Latest Practicable Date; CMT (S$8.7bn), Ascendas Reit (S$8.7bn), CCT (S$7.3bn), ART (S$2.5bn)
4 Represents undrawn committed capital by 3rd parties in Ascott Serviced Residence (Global) Fund, Raffles City China Investment Partners III, CREDO I China, Ascendas India Growth Programme, Ascendas India Logistics Programme2 Investing Into Growth Sectors And Platforms
Enhancing Fund Management Capabilities (Continued)
Top 10 Global And Asia’s Leading Real Estate Investment Manager
Listed Trusts And Funds AUM (S$bn)1 Listed Trusts and Fund Management Fees2 (S$mm)
73 326
16
+28% 99
+43%
57
228
41 167
0.0 0.0 0.0 0.0
FY 2014 FY 2018 FY 2014 FY 2018
(Enlarged Group) (Enlarged Group)
CapitaLand ASB
1 FY
2014 based on AUM as at 31 Dec 2014, FY 2018 based on AUM as at 31 Dec 2018
2 FY
2014 based on CapitaLand’s financials for the financial year ended 31 Dec 2014, FY 2018 based on CapitaLand’s financials for the financial year ended 31 Dec 2018 and ASB’s fund management and trustee income for
LTM ended 30 Sep 2018
173 Maintain Balance Between Emerging And Developed Markets
A Balanced Portfolio Driving Resilient Earnings
Developed Markets Emerging Markets
Total Assets1 Total EBITDA2
51%
58% 49%
CapitaLand
42% S$64.6bn S$4.2bn
53% 47%
Enlarged 60% Emerging Markets Developed Markets
Group
40% S$77.6bn China 48% S$5.1bn Singapore 37%
India 2% Australia /
Southeast USA / 6%
Asia Europe
(excluding 3%
Singapore)
Others 4%
and others
1Total assets as at 31 Dec 2018 for CapitaLand and 30 Sep 2018 for ASB
2Total EBITDA based on CapitaLand’s financials for the financial year ended 31 Dec 2018 and ASB’s financials for LTM ended 30 Sep 2018, adjusted for transaction costs and EBITDA attributable to Sydney office properties (100
18 Arthur Street and 66 Goulburn Street), which are not part of the Proposed Transaction4 Maintain High Quality Income
Reinforces High Quality, Recurring Income
Efficient Operating And Disciplined Capital Recycling Business Model
CapitaLand Enlarged Group
Unrealised S$1.0bn
Unrealised revaluation Operating
revaluation S$0.9bn gains / PATMI
gains / Operating impairments 46%
47%
impairments PATMI 33%
32%
31% 49%
Total PATMI: Total PATMI:
S$1.8bn1 S$2.2bn1
Realised
revaluation
gains Realised
10% revaluation
Portfolio gains Cash PATMI2 gains Cash PATMI2
10% ~69% 8%
Portfolio gains
~68%
13%
1 Based on CapitaLand’s financials for the financial year ended 31 Dec 2018 and ASB’s financials for LTM ended 30 Sep 2018, adjusted for financing costs and PATMI attributable to Sydney office properties (100 Arthur Street and
66 Goulburn Street) which are not part of the Proposed Transaction; excludes transaction costs. Including transaction costs, cash PATMI would be 67%
19
2 Cash PATMI consists of operating PATMI, portfolio gains as well as realised revaluation gains5 Disciplined Capital Management
Enhanced Potential For Active Portfolio Reconstitution
Across All Sectors
Potential For Portfolio Gains In Enlarged Group’s Investment Properties
Gross Divestments In Portfolio Gains In Enlarged Group’s Investment Properties
FY 2018 (S$4.8bn1) FY 20182 (S$mm) Book Value: S$54.4bn4
Others5 Business Park Others6
0.8 10% 4%6 Future Proofing Our Real Estate Platforms
Strengthening Digital Capabilities To Drive Business Innovation
Provision Of Integrated Services To Meet Different And Evolving Real Estate Requirements
Leveraging In-house Smart
“Office Of The Future” Ecosystem Technologies To Enhance Tenant
Connectivity And Experience
C3 at Innov Center, CapitaStar CapitaStar ASAP ASB Operations
Shanghai app @Work app Centre
Total # of users:
>7.6mm1
• Offering space-as-a-service to foster tenant loyalty and build and monetise communities
• Enhance B2B2C engagements to reach out to and engage tenant communities, customers
and employees
• Best-in-class technologies including data analytics, facial recognition, mobile application and
digital signages
1 Combined number of users for CapitaStar app and ASAP app as at 31 Dec 2018, assuming no overlap of users
216 Future Proofing Our Real Estate Platforms Commercial AUM +
Expansion Of Commercial Platform To Complementary Business Park AUM =
S$35bn
Subsectors And Business Parks 28%
of Total
AUM1,2
CBD FWP /
Office OOTF3
+58%
AUM
• 7 countries • 12 countries Centres Of
• CBD • CBD, Excellence
suburban offices,
business parks
• AUM: S$22.2bn • AUM: S$35.1bn Suburban Business
• Total area: 22.9mm sqft² • Total area: 70.6mm sqft2 Office Parks
• Integration of leasing network across sub-sectors and markets: creates cross-selling synergies
• Better positioned to anticipate critical shifts in market dynamics and space requirements across
multiple markets
Note: AUM and commercial space as at 31 Dec 2018
1 Based on Enlarged Group's AUM of S$123.4bn
22 2 Includes both GFA or NLA of commercial properties and business parks
3 Refers to Flexible Work Place and Office Of The Future6 Future Proofing Our Real Estate Platforms
Bringing Together Complementary Development And Planning
Capabilities To Create Additional Value
Artist’s impression of the proposed
business park in Ningbo
Brings CapitaLand’s integrated Brings ASB’s strong industrial
development core competencies in development and promotion
residential, commercial and retail to capabilities to attract investments to
strengthen ASB’s business park CapitaLand’s China township
development offerings
projects
China-Singapore Guangzhou
Knowledge City Phase 2, China
237 Sustainable Growth For Future Generations
Reinforces Proactive Sustainability Leadership
Green Buildings Green building ratings Green building ratings
>160¹ ~79¹
Females in total workforce: Females in total workforce
Human Capital
53%¹ 47%³
Training hours per staff annually Total # of training hours for all staff
>50¹ 30,506³
Reduction in carbon emissions intensity since 2008 Decrease in energy intensity
Environmental
28%² 19%⁴
Utilities cost avoidance since 2009 Decrease in water intensity
S$165mm² 11%⁴
Global Sustainability In Mar 2018, ASB successfully switched to utilising
& Others • Secured the first and largest S$300mm sustainability- •
link bilateral loan in Asia’s Real Estate Sector. 5-year 100% renewable energy for landlord’s energy
term loan and revolving facility linked to consumption in International Tech Park, Bangalore.
CapitaLand’s listing on the Dow Jones Sustainability This transition to solar energy has helped avoid 50,235
World Index (DSI) tonnes of carbon dioxide emissions
1 As at 31 Dec 2018
2 For the 9-month period ended 30 Sep 2018
3 For the financial year ended 31 Mar 2018
24 4 For the financial year ended 31 Mar 2018 vs. the financial year ended 31 Mar 20177 Sustainable Growth For Future Generations
Continuous Corporate Social Responsibility Stewardship
• The philanthropic arm of CapitaLand was established in 2005 to • A charitable foundation of Ascendas-Singbridge committed to
further CapitaLand’s community development commitment to transforming lives of less privileged through improving living
‘Building People. Building Communities.’ conditions, enhancing educational endeavours and nurturing
• CHF has donated over S$33mm to support programmes for talents
underprivileged children and vulnerable elderly since its inception • Invested a total of ~S$2mm in FY 2018
• Launched S$2mm CapitaLand Silver Empowerment Fund In ― Donated >S$280K to support the arts and nurture young talents
Singapore in July 2018 ― Invested ~S$1.25mm to care for community through
• In 2018, over 1,100 staff in CapitaLand properties tapped on this sponsorships and other initiatives
Volunteer Service Leave policy to volunteer more than 10,700 ― Sponsored >S$410K to create awareness and cultivate love for
hours in volunteer activities in Asia and beyond the environment through various initiatives
258 Employer Of Choice
9
Attracting And Leveraging Talent That Will Strengthen Real
Estate Expertise and Capabilities
Compelling Employer Value Proposition With Increased Competitiveness And Employer Branding
3.0
Continuous aligning
of management’s
Strategic talent and shareholders’
development and interests: share-based
mobility: role-based compensation
competency training continues to be an
Synergy in important element
roadmaps and
Best-in-class branding as
broader job rotation
management employer of
opportunities
team from a choice to attract
complementary and retain talent
business across a
variety of markets
and sectors Randstad SEA Employer Brand Award as
the most attractive employer in Singapore’s
property and real estate sector
Most popular graduate employer in the
property and real estate sector by
gradsingapore for 3 consecutive years
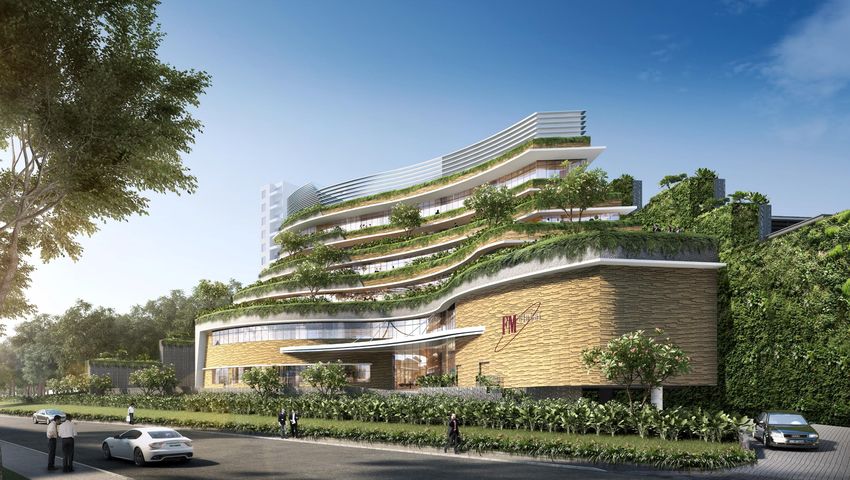
26III. Creating Shareholder Value From The Combination 27 Artist’s impression of FM Global’s Built To Suit (BTS) Facility In Science Park 2, Singapore
What We Said, We Delivered
            Maintaining Trajectory And Momentum
                                           Targets                   S$3 BILLION ASSET RECYCLING                                  S$100 BILLION GROUP AUM
                                                                               ANNUALLY                                                 BY YEAR 2020

                                                                                S$4 billion
                                                                                                1
                                                                                                                                  S$100.1bn2
                                                                                    DIVESTED VALUE                                        GROUP AUM
                                                                                      FOR FY 2018                                      AS AT 31 DEC 2018

                                           PATMI (S$mm)                                                                                                      ROE (%)
                                                                                                               Operating PATMI3      Portfolio gains4
                                                                                                               Revaluations and Impairments

                                                                                                      1,763                                                                       9.3
                                                                                                                                                                  8.6
                                                            1,570
                                                                                                      542                                                         1.8             2.9
                                                             324                                                                            6.6
                   1,190
                   219                                       319                                                                            1.2                   1.7
                                                                                                      349                                   0.5                                   1.8
                   106

                    865                                      927                                      872                                   4.9                   5.1             4.6

                                                                                5                                                                                           5
                FY 2016                         FY 2017 (Restated)                                  FY 2018                              FY 2016           FY 2017 (Restated)   FY 2018
     1 Figure relates to 100% of assets divested to unrelated parties and CapitaLand REITs/Funds
     2 Refers to the total value of all real estate managed by CapitaLand entities stated at 100% of property carrying value
     3 Includes corporate and unallocated costs
     4 Includes realised revaluation gain / (loss) of investment properties

28   5 Restated due to adoption of SFRS (I) 15 Revenue from Contracts with Customers
Immediately Accretive To EPS and ROE¹
•Earnings Per Share (EPS) •Return On Equity (ROE) (%)
(Singapore Cents) Accretion¹ Accretion¹
+2.4% 43.1
+4.6% 9.78%
42.1
9.35%
CapitaLand Enlarged Group CapitaLand Enlarged Group
Note: Including transaction costs, EPS accretion would be 0.5% Note: Including transaction costs, ROE accretion would be 2.7%
Note: Based on financials for the financial year ended 31 Dec 2018 for CapitaLand and LTM ended 30 Sep 2018 for ASB
1 Excluding one-off transaction costs and does not include impact of potential synergies
29Balance Sheet Remains Strong
Proven Track Record Of Recycling And Growth In Earnings
7.9 2.2
Ample
5.7 ✓ Proven track record of successful
Financing (S$bn) 3.0 Cash
Consideration
portfolio reconstitution strategy
Headroom1
Remaining
(S$3bn annual target)
2.7
Liquidity
Total Group Planned Headroom of ― CapitaLand: S$4.0bn (FY 2018)
Cash Balances And Debt Repayment / S$5.7bn vs S$3.0bn
Available Financing² Cash Consideration
Undrawn Facilities ― ASB: S$0.8bn (LTM ended Sep 2018)
0.72x ✓ Cash PATMI and interest coverage ratio
≤ 0.64x
0.56x remain strong
Net
Debt/Equity
✓ High proportion of recurring fee income
✓ Natural deleveraging from retained
CapitaLand Enlarged Group Target Net D/E earnings
31 Dec 2018 31 Dec 2018 ≤ 0.64x
By Dec 2020
1 As at 31 Dec 2018 for CapitaLand, does not include ASB’s cash balances and available undrawn facilities
2 Excludes REIT level debt from ART, CCT, CMT, CMMT, CRCT and RCS Trust (Raffles City Singapore – directly held by CCT and CMT)
30Sustainable Returns For Shareholders
In Line With CapitaLand’s Objective To Ensure Sustainable Returns For Our Shareholders
Dividends Paid To Shareholders Total Capital Returned To Shareholders (S$mm)
Cumulative Dividends as % of Cash PATMI Over 5 Years1: ~43% Cumulative Capital Returned Over 5 Years: ~S$2.7bn
Dividends Share Buybacks
14
843
2
12 12
12
10 342
10 9 9
482 504
Dividend 8 438
Per Share 384 57
(Cents) 55
6
4 504 5013
384 383 425
2
0
FY 2014 FY 2015 FY 2016 FY 2017 FY 2018 FY 2014 FY 2015 FY 2016 FY 2017 FY 2018
1 Based on aggregate sum of dividends paid by CapitaLand for FY 2014 to FY 2018 divided by aggregate sum of CapitaLand’s cash PATMI from FY 2014 to FY 2018
2 Proposed dividends per share of 12 cents for FY 2018, subject to final shareholders’ approval at the Annual General Meeting to be held at 12 Apr 2019
3 Based on 4,175,057,129 shares in issue (excluding treasury shares) as at the Latest Practicable Date
31Delivering NAV And ROE Growth
Confident Of Overcoming Slight NAV Dilution
NAV Per Share (S$) Multi-pronged Strategy To Deliver NAV And ROE Growth
4.55
4.36
3.94
▪ Revenue and cost synergies
Harness Synergies
▪ Historical fee income CAGR of 8%2 on enlarged
S$73.0bn AUM base (AUM historical CAGR of 9%2)
Enhanced Fund Management Platform
▪ Diversified pipeline of 13.9mm sqm of
developable GFA3
Sizeable Development Pipeline ▪ 3.0mm sqm4 to be completed by Dec 2020
▪ Historical contribution of ~20% of ROE from
Disciplined Portfolio Reconstitution portfolio gains
▪ Enlarged investment properties base of S$54bn5
▪ S$1bn of recurring income:
Scalable Recurring Income Portfolio 47% of 2018 enlarged PATMI of S$2.2bn
FY 2014 FY 2018 FY 2018
(Enlarged
Group)¹
1 Based on financials for the financial year ended 31 Dec 2018 for CapitaLand and LTM ended 30 Sep 2018 for ASB
2 FY 2014-FY 2018 CAGR; Based on CapitaLand Listed Trusts and Funds AUM and fee income
3 Includes actual or planned GFA and/or land area of landbank and projects under development, but excludes hospitality assets
4 Excludes Singbridge developments and sustainable urban development projects
32 5 As at 31 Dec 2018 for CapitaLand and 30 Sep 2018 for ASB; based on completed investment properties on balance sheet and held via investments in joint ventures and associated companies, including CapitaLand Listed
Trusts and excluding Ascendas Listed TrustsThank You 33
3
4

    EGM Information

                      Raffles City Singapore
Resolutions To Be Approved At EGM
Ordinary The proposed acquisition of Ascendas Pte Ltd and Singbridge Pte. Ltd.
Resolution 1 for a total consideration of S$6,035.9mm
Ordinary The proposed allotment and issuance of 862,264,714 new
Resolution 2 Consideration Shares to Vendor as part of the Consideration
The proposed Whitewash Resolution for the waiver of rights by
Ordinary
Independent Shareholders (Whitewash) to receive a general offer for
Resolution 3
all their Shares from Vendor
Each Resolution Is Subject To And Contingent Upon The Other Two Resolutions Being Passed
Temasek And Their Associates, Concert Parties And Parties Not Independent Of Them Will
Abstain From Voting On The Resolutions
35Next Steps And Timeline
Key Milestones Details
Last date and time for
9 April 2019, Tuesday at 11.30am
lodgment of Proxy Form
12 April 2019, Friday at 11.30am
(or as soon thereafter as the AGM of CapitaLand to be held at 10.00am on the
same day and at the same place is concluded or adjourned)
EGM
Venue: The Star Theatre, Level 5, The Star Performing Arts Centre,
1 Vista Exchange Green, Singapore 138617
Target completion 3Q 2019
36Opinion and Recommendations
Opinion Of Recommendations Of The
Independent Financial Adviser Independent Directors
An extract of the Independent Financial Adviser (IFA) Opinion is The Independent Directors have considered the opinion and
reproduced below. Based on the considerations set out in the IFA advice given by the IFA set out in the IFA Opinion, and
Opinion, the IFA is of the opinion that: recommend:
• The Proposed Transaction and the Proposed • The IPT Independent Shareholders VOTE IN
Allotment and Issuance of the Consideration
FAVOUR of the ordinary resolutions relating to
Shares are on NORMAL commercial terms and
the Proposed Transaction and the Proposed
are NOT PREJUDICIAL to the interests of
Allotment and Issuance of the Consideration
CapitaLand and the IPT Independent Shares; and
Shareholders (as defined herein); and
• The Whitewash Independent Shareholders VOTE
• The Whitewash Resolution is FAIR and IN FAVOUR of the Whitewash Resolution.
REASONABLE
Independent Financial Adviser Independent Directors
Disclaimer: It is important that you read this extract together with and in the context of the IFA letter and recommendations of
the independent directors in full, which can be found in paragraph 16 of the Circular
37What Do Shareholders Need To Do In Relation To The Proposed
Transaction?
YOUR VOTE COUNTS
Please vote in person or by proxy
Circular You now have the
Circular
Extraordinary General Meeting:
12 April 2019 (Friday) at 11.30 a.m1
The Star Theatre, Level 5, The Star
Performing Arts Centre, 1 Vista Exchange
Green, Singapore 138617
Appoint a proxy
Attend the EGM in
OR to vote at the
person
EGM
CapitaLand
Vote shareholders vote
during the EGM
1 Or as soon thereafter as the AGM of CapitaLand to be held at 10.00am on the same day and at the same place is concluded or adjourned
38What If Shareholders Are Unable To Attend The EGM?
If You Are Unable To Attend The EGM In Person, You May Appoint Someone You Know, Or The
Chairman Of The EGM, To Vote On Your Behalf By Completing The Proxy Form.
STEP 1: Locate The Proxy Form
The Proxy Form is enclosed with the Circular or can be obtained from CapitaLand’s Share Registrar:
M & C Services Private Limited
112 Robinson Road
#05-01
Singapore 068902
STEP 2: Complete The Proxy Form
A Fill in your name and particulars
A B You may fill in the details of the appointee(s) or leave this section blank. The Chairman
of the EGM will be the appointee if this section is left blank
B
C
C Indicate your vote in the box labeled FOR or AGAINST for each of the Resolutions.
39What If Shareholders Are Unable To Attend The EGM? (Continued)
D If you are an individual, you or your attorney MUST SIGN and indicate the date. For a
corporation, the Proxy Form must be executed under its common seal or signed by a
duly authorised officer or attorney. Where the Proxy Form is signed by an attorney, the
letter or power of attorney or a duly certified copy thereof must be lodged with the
Proxy Form.
E Indicate the number of CapitaLand shares you hold.
D E
STEP 3: Return The Completed Proxy Form
Return the completed and signed Proxy Form in the enclosed pre-addressed envelope to CapitaLand’s Share Registrar, M & C
Services Private Limited, 112 Robinson Road, #05-01, Singapore 068902, NO LATER THAN 9 April 2019 (Tuesday) at 11.30am. The
envelope is prepaid for posting in Singapore only. Please affix sufficient postage if posting from outside of Singapore.
40Appendix 41
Glossary
 Abbreviation    Definition                              Abbreviation            Definition                         Abbreviation   Definition
 A-HTRUST        Ascendas Hospitality Trust              EBITDA                  Earnings before interest, taxes,   PATMI          Profit after tax and minority interests
                                                                                 depreciation and amortization
 a-iTrust        Ascendas India Trust                                                                               P/E            Price to equity
                                                         EGM                     Extraordinary general meeting
 APAC            Asia Pacific                                                                                       REIT           Real estate investment trust
                                                         EPS                     Earnings per share
 Ascendas Reit   Ascendas Real Estate Investment Trust                                                              ROE            Return on equity
                                                         EU                      Europe
 ART             Ascott Residence Trust                                                                             SEA            Southeast Asia
                                                         FWP                     Flexible work place
 ASB             Ascendas-Singbridge Group                                                                          SFRS           Singapore Financial Reporting Standard
                                                         FY                      Financial year
 AU              Australia                                                                                          Sqft           Square feet
                                                         GFA                     Gross floor area
 AUM             Assets under management                                                                            Sqm            Square metre
                                                         IFA                     Independent financial advisor
 B2B2C           Business to business to consumer                                                                   S-REITs        Singapore REITs
                                                         JV                      Joint venture
 CAGR            Compound annual growth rate                                                                        UK             United Kingdom
                                                         Last Practicable Date   8 March 2019
 CBD             Core business district                                                                             USA            United States of America
                                                         Leverage                Net debt / total equity
 CCT             CapitaLand Commercial Trust                                                                        VWAP           Volume weighted average price
                                                         LTM                     Last twelve months
 CMMT            CapitaLand Malaysia Mall Trust
                                                         Market cap              Market capitalisation
 CMT             CapitaLand Mall Trust
                                                         MOU                     Memorandum of Understanding
 CRCT            CapitaLand Retail China Trust
                                                         NAV                     Net asset value
 CSGKC           China-Singapore Guangzhou
                 Knowledge City                          NLA                     Net lettable area

 D/E             Debt to equity                          OOTF                    Office Of The Future

42
Breaking Down The IFA’s Sum-Of-The-Parts Valuation
Net other liabilities2 688
Net debt and MI1 3,737
7,423
(S$mm)
1,180 –
6,617 – 267 1,267
Equity value
6,704
2,172
SOTP Investment Properties Development Properties Fund Management Listed Funds
(as of 30 Sep 2018) (as of 30 Sep 2018) (as of 30 Sep 2018) (as of 8 Mar 8 2019)
◼ Includes consolidated “investment properties” and “investment ◼ Based on LTM ended 30 Sep ◼ Based on the Target Companies’
properties under development”3 30 2018 PATMI of S$71.6mm pro-rata equity interest in these listed
◼ Includes S$150mm valuation uplift from independent appraisal ◼ Revenue of S$159.1mm entities computed based on
Key relevant ◼ Excludes Australian Assets ◼ PATMI margin of 45% 1 month VWAP, for:
statistics ◼ Adjusted for the deconsolidation of A-HTRUST from the ◼ 16.5–17.7x P/E multiple ◼ Ascendas Reit
investment properties derived from selected
◼ a-iTrust
◼ Includes consolidated “development properties” and “properties trading comparable
companies and selected ◼ A-HTRUST
under development”4
precedent transactions
Note: More information on the valuation of each segment can be found in the IFA Opinion (which is subject to the assumptions and qualifications set out therein) as appended to the Circular
1 As of 30 Sep 2018 and excludes S$326mm of debt attributable to the Australian Assets which are not part of the Proposed Transaction
2 As of 30 Sep 2018 and adjusted for the provision for the payout of the estimated permitted dividend to the Vendor for the period between 1 Apr 2018 to 30 Sep 2018
3 Includes interests in JV and minority investments in unlisted funds
4 Includes properties held for sale held by the Target Companies’ JV investments and investments in associate companies
43Enlarged Group’s Trading Performance Since Proposed
Transaction Announcement
Share Price Chart (Rebased to CapitaLand) - Last Trading Day To Latest Practicable Date
CapitaLand CapitaLand Listed Trusts¹ Ascendas Listed Trusts² STI
S$ 3.80
CapitaLand CapitaLand Listed Trusts1 Ascendas Listed Trusts2 Straits Times Index (STI) Value increase in
Ascendas Listed Trusts:
Change (%) 4.9% 4.3% 8.0% (0.1%)
S$160mm3
3.60
Share issue price of
S$3.50
CapitaLand’s last
traded price on the
3.40 Latest Practicable
Date:
CapitaLand’s last
S$3.43
traded price on
the Last Trading
Day: S$3.27
3.20
3.00
11-Jan 18-Jan 25-Jan 1-Feb 8-Feb 15-Feb 22-Feb 1-Mar 8-Mar
Note: Factset as of 8 Mar 2019 (Last Practicable Date)
1 Based on average of CCT, CMT, CRCT, CMMT and ART share price movements
2 Based on average of Ascendas Reit, a-iTrust and A-HTRUST share price movements
44 3 Based on CapitaLand’s and ASB’s effective stake in REITs as at the Latest Practicable Date; based on 1M VWAPAUM Breakdown Of The Enlarged Group
Breakdown By Geography Breakdown By Sector
Others²
Industrial 1%
Residential
3%
8%
Rest of World
21%
Singapore Commercial
34% 21%
Vietnam
2%
Total AUM: Total AUM:
Retail
India
S$123.4bn1 S$123.4bn1 32%
2%
Business Parks
/ Logistics
10%
China
41%
Lodging
25%
Note: AUM as at 31 Dec 2018
1 Enlarged Group’s AUM as at 31 Dec 2018 adjusted for CapitaLand and ASB’s joint-development of Raffles City Chongqing
2 Others include data centres and land for sale
45Gross Divestments In FY 2018 (S$4.8bn1)
Potential For Portfolio Gains From Enlarged Group’s Investment Properties
Others² Others3 By parent to
South 3rd parties
4% Lodging 5% By private funds
Korea Retail 14%
8% 7% 61% to 3rd parties
China 48%
Vietnam 44% By parent
9% to REITs4
16%
By By By
Geography Sector Entity
Commercial
27%
Singapore
35% By REITs to
3rd parties
22%
Note: FY 2018 based on the financial year ended 31 Dec 2018 for CapitaLand and LTM ended 30 Sep 2018 for ASB
1 Excludes Singbridge divestments and residential land sales; comprises c.S$4.0bn of divestments by CapitaLand and c.S$0.8bn of divestments by ASB
2 Includes Hong Kong and India
3 Includes industrial, logistics and land for sale
4 From Parent (CapitaLand or ASB) to REITs
46Potential Benefits To ASB from CapitaLand’s Established Integrated
Development Capabilities
Case study: CSGKC
▪ Iconic project jointly initiated by leaders of Guangdong and Singapore
Overview ▪ Phase 1 consists of 6.27 sqkm, and includes OneHub developed by ASB
▪ OneHub Phase 1 is completed
▪ OneHub Phase 2 (business parks and residential) has
commenced
▪ Phase 2 MOU for 2km2 signed
Established domain capabilities in residential planning, design and
branding, and directly adding value to OneHub Phase 2
What
Enhanced credentials for Phase 2 GKC pitch through CapitaLand’s
expertise in office, retail, hospitality and residential
Potential to introduce medical and education players to the project China-Singapore Guangzhou Knowledge City, China
Offers
given CapitaLand’s scale and network
47Potential Benefits To CapitaLand from ASB’s Strong Industrial
Promotion Capabilities
Case study: Master-planning projects in Ningbo and Jiaxing, China
▪ CapitaLand is set to broaden its master planning and urban design An artist’s impression of the proposed business park in Ningbo, comprising
capabilities in China through new strategic partnerships in Ningbo and research & development facilities, offices, residences and civic &
community facilities
Overview
Jiaxing, two fast-growing cities in Zhejiang Province China
▪ Signed 2 MOUs in April 2018 to explore developing and managing large-
scale business park and township projects in line with a new direction in
China’s urbanisation drive emphasising integration between industrial and
urban development
Strong industrial promotion capabilities, complementary to the
development of CapitaLand’s master planning and urban design
What
abilities
Attract investments from industrial participants for CapitaLand’s
current master-planning townships in China
Offers Enhance the efficiency and effectiveness of CapitaLand’s industrial
masterplans for Ningbo and Jiaxing
Help build CapitaLand’s landbank in industrial townships
48ASB Portfolio
International Tech Park Pune, Hinjawadi, India
49AUM = S$9bn
Ascendas-Singbridge | Business Park 38%
of Total
AUM1
International Tech Park Bangalore,
38mm sqft
India Total GFA2
OneHub Saigon, Vietnam Ascendas OneHub GKC, Guangzhou, China
Galaxis, Singapore
Ascendas Innovation Tower, Xi’an, ONE@Changi City, Changi Business Park,
International Tech Park Pune, India
China Singapore
1 Based on AUM for ASB as at 31 Dec 2018
2 Based on GFA of completed investment properties in ASB’s business park portfolio as at 31 Dec 2018
50AUM = S$4bn
Ascendas-Singbridge | Logistics 14%
of Total
AUM1
25mm sqft
Logistic properties in key UK distribution centres,
Total GFA2
United Kingdom
Vinplex, India
Victory Park, Upwell Street,
Grade-A warehouses, Arshiya Free
52 Fox Drive, Australia Trade Warehousing Zone, India
Lower Don Valley, United Changi Logistics Centre, Singapore
Kingdom
1 Based on AUM for ASB as at 31 Dec 2018
2 Based on GFA of completed investment properties in ASB’s logistics portfolio as at 31 Dec 20180
51AUM = S$3bn
Ascendas-Singbridge | Industrial 14%
of Total
AUM1
Ascendas-Xinsu Portfolio, China
18mm sqft
Total GFA2
Nusajaya Tech Park, Johor, Malaysia
Infineon, Singapore TechPlace II, Singapore FoodAxis @ Senoko, Singapore
1 Based on AUM for ASB as at 31 Dec 2018
2 Based on GFA of completed investment properties in ASB’s industrial portfolio as at 31 Dec 2018
52AUM = S$4bn
Ascendas-Singbridge | Office 15%
of Total
AUM1
6mm sqft
Total GFA2
Ascendas Innovation Place,
Artist’s Impression ICON Yeoksam, South Korea Shanghai, China
Artist’s Impression of 79
Robinson Road, Singapore
Citibank Center, South
100 Wickham Street, Australia The Campus at Sorrento Gateway, San Diego, USA
Korea
1 Based on AUM for ASB as at 31 Dec 2018
2 Based on GFA of completed investment properties in ASB’s office portfolio as at 31 Dec 2018
53AUM = S$2bn
Ascendas-Singbridge | Lodging 7%
of Total
AUM1
5,325
Total Units
Ibis Ambassador Seoul Insadong, South Korea Novotel Sydney Central, Australia
Hotel Sunroute Ariake, Tokyo, Japan Novotel Sydney Parramatta,
Park Hotel Clarke Quay, Singapore
Australia
1 Based on AUM for ASB as at 31 Dec 2018
54 2 Based on total no. of units of ASB’s lodging assets as at 31 Dec 2018AUM = S$3bn
Ascendas-Singbridge | Others
1
12%
of Total
AUM1
4mm sqft
Total GFA3
China-Singapore Guangzhou Knowledge City, China Raffles City Chongqing, China
1 Includes data centres, retail, residential and land for sale
2 Based on AUM for ASB as at 31 Dec 2018
2 Based on GFA of completed investment properties in ASB’s data centres, retail, residential and land for sale portfolio as at 31 Dec 2018
55List Of Properties In Singapore (Excluding Listed Trusts)
Properties Asset class % stake GFA (sqm)
Investment properties
9 Tai Seng Drive Data Centre 100.0% 218,905
Galaxis Business Park 75.0% 68,835
Ascent Business Park 100.0% 51,564
Nucleos Business Park 100.0% 46,182
Icon@IBP Business Park 100.0% 41,979
5 Science Park Drive Business Park 100.0% 25,655
Chadwick/Curie/Cavendish Business Park 100.0% 24,582
Infinite Studios Business Park 70.0% 24,078
Teletech Park Business Park 100.0% 23,977
BTS for Pratt & Whitney Industrial 100.0% 14,864
BTS for FM Global Business Park 100.0% 11,613
Development properties / Land leases
79 Robinson Road (former CPF Building) Office 65.0% 57,0051
Rochester Park Business Park 100.0% 36,8271
The Aquarius Business Park 100.0% 34,8241
The Franklin Business Park 100.0% 8,8992
Ang Mo Kio Land Leases Business Park 100.0% -
Science Park I Land Leases Business Park 100.0% -
Science Park II Land Leases Business Park 100.0% -
Note: 1Indicates proposed GFA; 2 Indicates land area
56List Of Properties In China (Excluding Listed Trusts)
Properties Asset class % stake GFA (sqm)
Investment properties
Ascendas-Xinsu Portfolio Industrial 23.0% 393,279
Singapore-Hangzhou Science & Technology Park (Phase 1 & 2) Business Park 80.0% 297,166
Dalian Ascendas IT Park Business Park 50.0% 231,710
Ascendas iHub Suzhou Business Park 100.0% 229,258
Ascendas Innovation Tower Business Park 23.0% 122,362
Ascendas OneHub GKC Business Park 76.0% 73,436
Ascendas Plaza Office 100.0% 59,716
Ascendas Innovation Hub Business Park 18.4% 40,547
Ascendas i-Link Business Park 100.0% 31,685
Ascendas Innovation Place Office 100.0% 27,850
BTS projects at Beijing Economic Technological Development Area Logistics 99.7% 26,345
Development properties1 / Landbank
Raffles City Chongqing Mixed-Use 37.5% 727,962
China-Singapore Guangzhou Knowledge City Tier 1 Development 50.0% 434,461
Tianjiao Residential Project Residential 40.0% 392,582
Ascendas OneHub GKC Business Park 76.0% 321,036
Singapore-Hangzhou Science & Technology Park (Phase 3) Business Park 70.0% 183,530
Dalian Ascendas IT Park Business Park 50.0% 112,036
Note: 1Indicates proposed GFA
57List Of Properties In India (Excluding Listed Trusts)
Properties Asset class % stake GFA (sqm)
Investment properties
ITPP Phase 1 - 3 Business Park 78.5% 176,739
Vinplex Logistics 50.7% 120,394
ITPG-SEZ 1 Phase 1 Business Park 30.0% 88,070
Logistics Portfolio in Oragadam, Chennai Logistics 40.7% 11,240
Development properties / Landbank
OneHub Chennai Industrial 40.0% 3,863,1801
ITPG-SEZ 1 Phase 2 Business Park 30.0% 210,0322
ITPG-SEZ 2 Business Park 100.0% 96,2741
Kohinoor Business Park 30.0% 66,8942
International Tech Park Chennai, Radial Road Business Park 100.0% 49,3712
ITPP Phase 4 Business Park 78.5% 18,6162
Note: 1 Indicates land area; 2 Indicates proposed GFA
58You can also read