Risk and Readiness: The Impact of Automation on Provincial Labour Markets - Le Devoir
←
→
Page content transcription
If your browser does not render page correctly, please read the page content below

Institut            C.D. HOWE                              I n sti tute

                          commentary
                                         NO. 499

          Risk and Readiness:
             The Impact of
            Automation on
           Provincial Labour
                Markets

Canada’s provinces vary significantly in industrial and labour market structure. These differences
highlight priority areas that provincial governments should consider in developing education and
       employment policy responses to adapt to current and future technological change.

                                 Rosalie Wyonch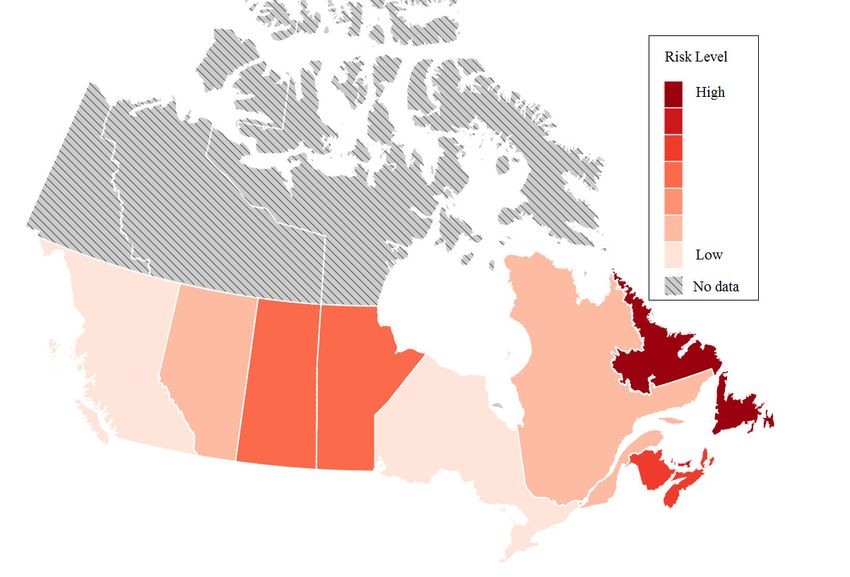
The C.D. Howe Institute’s Commitment
                              to Quality, Independence and
                              Nonpartisanship

A bout The                    The C.D. Howe Institute’s reputation for quality, integrity and
Author                        nonpartisanship is its chief asset.

Rosalie Wyonch                Its books, Commentaries and E-Briefs undergo a rigorous two-stage
is a Policy Analyst at the    review by internal staff, and by outside academics and independent
C.D. Howe Institute.          experts. The Institute publishes only studies that meet its standards for
                              analytical soundness, factual accuracy and policy relevance. It subjects its
                              review and publication process to an annual audit by external experts.

                              As a registered Canadian charity, the C.D. Howe Institute accepts
                              donations to further its mission from individuals, private and public
                              organizations, and charitable foundations. It accepts no donation
                              that stipulates a predetermined result or otherwise inhibits the
                              independence of its staff and authors. The Institute requires that its
                              authors publicly disclose any actual or potential conflicts of interest
                              of which they are aware. Institute staff members are subject to a strict
                              conflict of interest policy.

                              C.D. Howe Institute staff and authors provide policy research and
                              commentary on a non-exclusive basis. No Institute publication or
                              statement will endorse any political party, elected official or candidate
                              for elected office. The Institute does not take corporate positions on
                              policy matters.

Commentary No. 499
                                              D. HOWE
January 2018                                 .
                             C

Education, Skills and
                                                                                                                  IN
                                    T

Labour Market
                             INSTITU

                                                                                                                     S
                                                                                                                   T IT
                                                                                                                    uesUT E
                             E sse

                                                                                                                              Daniel Schwanen
                                                                                                                   iti q
                              n ti

                                                                                                                  pol
                                al

                                                                                                                              Vice President, Research
                                                                                                              les
                                  Po

$ 12.00                                 yI                                                                    s
                                     lic

                                                                                                        ur

                                             nt
                                                  elli                                                  les
                                                         ge n                                     sab
                                                                                         s pe n
isbn 978-1-987983-49-4                                          ce | C
                                                                       o n seils i n d i

issn 0824-8001 (print);
issn 1703-0765 (online)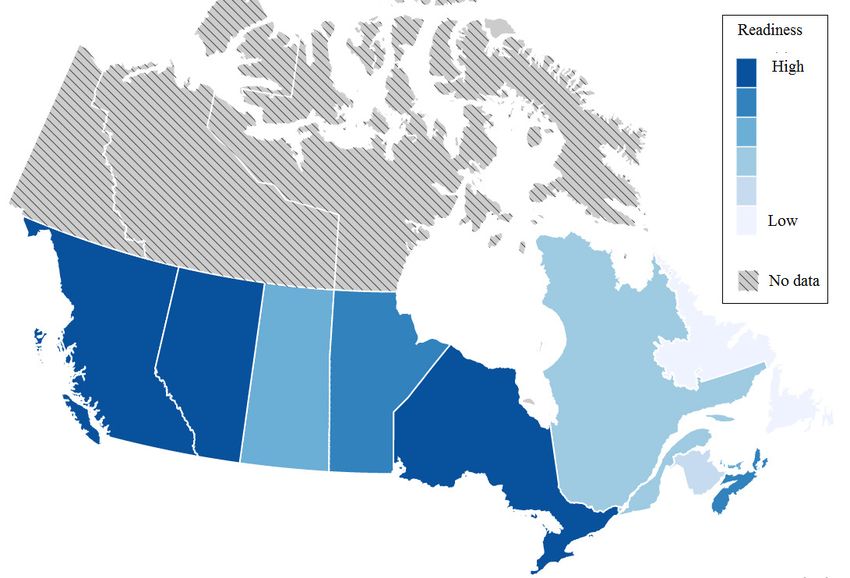
The Study In Brief

The process of technological progress is one of creative destruction, where some occupations, skills, products
and firms become obsolete and are replaced by technologically superior alternatives. This process, facilitated
by trade, improves overall economic growth and raises living standards in the long run. In the short run,
however, it risks igniting economic and political tensions as some businesses fail and some people lose
their jobs. At the same time, new jobs are created and the skills required to perform others might change
dramatically. Given historical trends of employment, it seems unlikely that all occupations that are highly
susceptible to automation will be replaced by smart machines over the next few years. As the demand for
skills in the labour market continues to grow, however, there is room for public policy to moderate the
effect of technological change on the labour market in a number of ways.
   Each province faces slightly different challenges when developing policy to confront a technologically
advanced and uncertain future. Some provinces, with more economic diversification or a concentration of
workers in areas that are not very susceptible to automation, appear to be better situated for technological
change than others. In developing policies to facilitate the transition to a high-tech future, provinces that
face a higher risk of labour market disruption might require a broad-based approach, while those facing a
lower risk of disruption might be able leverage existing policies and expand educational or unemployment
support where necessary.
   Differences in the composition of employment and skills levels across the country highlight priority
areas that provincial governments should consider in developing education and employment policy
responses to adapt to current and future technological change. Disruption as a result of technological
change is not a uniform process, so the policies to tackle it similarly should be not be uniform, but should
take into account each region’s strengths and weaknesses.

C.D. Howe Institute Commentary© is a periodic analysis of, and commentary on, current public policy issues. Barry Norris and
James Fleming edited the manuscript; Yang Zhao prepared it for publication. As with all Institute publications, the views
expressed here are those of the author and do not necessarily reflect the opinions of the Institute’s members or Board of
Directors. Quotation with appropriate credit is permissible.

To order this publication please contact: the C.D. Howe Institute, 67 Yonge St., Suite 300, Toronto, Ontario M5E 1J8. The full
text of this publication is also available on the Institute’s website at www.cdhowe.org.

4

Throughout history, technological change has helped lift
people out of squalor and poverty, raised standards of living
and improved well-being. Technological change, however, can
also be disruptive, rendering specific occupations and skills
obsolete, unsettling economic structures and contributing to
unemployment and economic uncertainty.

Innovation drives productivity and economic                change, while those in Ontario, British Columbia
growth, leading to rising incomes over time but            and Alberta face the least risk of labour market
often with short-run challenges from a shifting            disruption due to technological change.
mix of workers and capital. The increasing pace of
technological change has led some to speculate that,       Technologic a l Ch a nge a nd
in the digital era, technology might destroy old jobs      the Economy
faster than new ones are created (Brynjolfsson and
McAfee 2014; Krugman 2013; Levy and Murnane                The process of technological progress is one of
2004). In the aggregate, however, job losses can           “creative destruction”: some occupations, skills,
occur only if those lost to innovation outstrip            products and firms become obsolete, and are replaced
those created by the demand for new products               by a technologically superior alternative. This process,
and services.                                              facilitated by trade, improves overall economic
   Because Canada’s provinces vary significantly in        growth and raises living standards in the long run. In
industrial and labour market structure, each faces         the short run, however, it risks igniting economic and
different challenges with respect to automation            political tensions as some businesses fail and some
and technology. This Commentary assesses the risk          people lose their jobs. At the same time, new jobs
that, in each province, workers could be replaced          are created and the skills required to perform others
by machines and the readiness of those workers to          might change dramatically. This process of creation
adapt to technological change. High-skill workers          causing obsolescence is observed in rapidly growing
are less likely to be automated; moreover, if the          economies, which exhibit high levels of both job
past is any guide, the labour market’s demand              creation and destruction (Howitt 2015).
for skills is likely to continue to increase. In this         The potential for automation does not necessarily
context, workers in New Brunswick, Newfoundland            translate, however, into actual automation. The
and Labrador and Saskatchewan are the most                 decision to invest in robots or smart software
susceptible to disruption due to technological             depends on a number of factors: firm size,

The author thanks Colin Busby, Andrew Heisz, Trevor Hughes, members of the Human Capital Policy Council and anonymous
reviewers for comments on an earlier draft. She retains responsibility for any errors and the views expressed.

.
5                                                                                                         Commentary 499

competitive pressure and the cost of a machine                       important contextual information that leads
versus the cost of human labour, to name a few.                      to understanding. Humans absorb and process
Just because something has been invented does                        this information and form conclusions without
not mean it is immediately useful or commercially                    conscious effort, all while participating in the
viable. General purpose technologies can take                        conversation. The development of computers that
decades to reach their full potential for productivity               can process “natural language” has been an ongoing
improvement. Automating technologies mean less                       field of research since the 1940s (Manaris 1998),
labour is required to produce the same amount of                     but computers still have difficulty incorporating
goods. If this process creates an excess supply of                   contextual information, making it difficult for
labour in the economy, it puts downward pressure                     them to distinguish between relevant and irrelevant
on wages. Since labour then becomes less expensive                   information.1
and freely available, there will be less incentive                       In principle, occupations with high skills
for companies to put research and development                        requirements, where humans still outperform
funding into automating technologies. Instead, this                  computers, are impossible to automate. Such
research funding could be better used developing                     occupations generally require adaptability to
new technologies or improving processes, which                       novel situations and problems or involve social
requires highly skilled workers. These offsetting                    components as a key function – examples include
effects lower the impact of technology on overall                    police officers, specialist physicians and instructors
employment (Acemoglu and Restrepo 2016).                             of persons with disabilities. Occupations that
                                                                     require low levels of adaptation in the tasks
A rtifici a l Intelligence v er sus                                  performed and do not require subtle human
Hum a n Intelligence                                                 interactions – for example, bookkeepers, motor
                                                                     vehicle assemblers and service station attendants.
Humans and computers “think” differently and                         – are easier to automate. The ability to automate
process information in different ways. Computers                     occupations with low requirements for some skills
are better than humans at calculation, repetition                    and high requirements for others is, however, less
without fatigue and pattern recognition. Humans                      obvious: it is likely that some aspects of these
are better at incorporating contextual information,                  jobs are automatable while others are not. In this
creativity and complex problem solving. For                          case, automating technologies can improve each
example, when people converse, not only the words                    employee’s productivity, but as the occupation itself
being spoken – themselves unlikely to be structured                  evolves, fewer and fewer people will be required
with perfect grammatical syntax – but also tone of                   to perform it. The occupation itself might not
voice, facial expression and body language provide                   be automatable, but some of the jobs currently

1       A particularly spectacular example of the limitations of software in interacting with humans is Microsoft’s Tay artificial
        intelligence (AI) “chatbot.” Launched in March 2016, Tay was intended to interact with people on Twitter and learn about
        the world through conversation. In less than 24 hours of learning from users, Tay was seriously malfunctioning, to say the
        least. Microsoft quickly removed the bot for “adjustments,” but the experience showed the rudimentary ability of AI to
        understand human interactions, much less coordinated internet trolls. In August 2017, XiaoBing, Tay’s longer-running
        Chinese counterpart, was removed from China’s most popular messaging app after expressing anti-communist sentiments
        and informing users, “My China dream is to go to America.”
6
allocated to it might be “automated” due to the R isk a nd R e a diness: Winner s
lower requirement for labour. a nd Loser s by Prov ince
Each province faces slightly different challenges
Autom ation a nd C a na da’s
in developing policy to confront a technologically
L a bour M a r k et
advanced and uncertain future. Provinces with
To determine the impact of automation on more economic diversification or a concentration
Canada’s labour markets, I use the likelihood of workers in areas that are not very susceptible to
that each occupation could be automated in automation are better situated for technological
combination with labour market information to change than others. Incorporating various factors
determine the jobs and industries most susceptible about each province’s labour market and economy,
to disruption. Using feedback from AI researchers I develop a measure of the risk of disruption in
and engineers to determine the skills that remain the labour market due to technological change
difficult to computerize in combination with and a measure of how ready workers are for this
detailed data concerning the skills content of disruption.
occupations, previous research has calculated a
“risk of automation” for each occupation in Canada Risk
(Oschinski and Wyonch 2017).
On the whole, Canada’s labour market is well Although some provinces are better prepared to
positioned for relatively rapid technological change. adapt to technological change than others, no
Employment trends over the past 30 years show province is immune to disruption. In all provinces,
that automation in the job market is a gradual at least three in 10 workers are employed in
process, and the labour market has been adjusting occupations that are likely automatable. For those
to technological progress over time (Figure 1). The who do lose their jobs, getting a new one might
share of employment in high-risk occupations – involve redeploying existing skills with minimal
those that require less adaptive skills – has declined new technical training, or significant training and
steadily, from 50 percent of total employment in switching to an entirely new type of occupation in a
1987 to 40 percent in 2015 (Figure 2). Conversely, different industry. The polarization of employment
the share of employment in occupations with low in industries and types of occupations has
susceptibility to automation increased from 27 implications for how difficult it will be for workers
percent in 1987 to 37 percent in 2015. This change to transition to new employment if their current job
is likely to continue, and will be most disruptive for is automated.
those whose jobs change dramatically or become The process of technological change is iterative,
completely automated. Such workers might have and occupations with a lower risk of automation
to go back to school or otherwise gain new skills will still exist for quite some time. People employed
to secure new employment in less automatable in highly automatable occupations, however, might
occupations. But even in occupations highly need to transition to a different job before the
susceptible to automation – accounting for 34 end of their career, which complicates the policy
percent of current employment – it is unlikely that response. That, however, is easier said than done:
employment will be completely replaced by smart if the only available jobs are those at low risk
machines over the next few years. of automation, significant retraining, requiring
higher education and/or skills likely would be7 Commentary 499
Figure 1: Growth in Employment by Risk Category, Canada, 1987–2030 (projected)
Employment in low-risk occupations
Employment in medium-risk occupations
Employment in high-risk occupations
Index of growth Projection
(2017 = 100)
160
140
120
100
80
60
40
20
0
-20
Source: Oschinski and Wyonch 2017; author’s calculations.
Figure 2: Composition of Employment by Risk Category, Canada, 1987–2030 (projected)
Share of Total
Employment
(percent)
60
50
40
30
20
10
0
1987 2000 2015 2030
High risk Medium risk Low risk (Projection)
Sources: Oschinski and Wyonch 2017; author’s calculations.8
Table 1: Components of Measure of Risk of Automation
Weight Indicator
Polarization of risk over the distribution of employment
0.4 • polarization of risk over distribution by industrial composition of employment
• polarization of risk over distribution of employment by type of occupation
Portion of employment vulnerable to automation
• percent of total employment theoretically automatable
0.6
• average automation risk level of all employment
• percent of employment in occupations at high risk of automation
Source: Author’s definition.
needed to move displaced workers into such employment susceptible to automation. Manitoba
jobs. The overall risk ranking takes into account and Saskatchewan, despite having the highest
the polarization of risk across occupations and proportion of employment at risk of automation,
industries as well as the overall proportion of also have relatively low polarization in the
employment at risk of automation (Table 1). The distribution of employment over risk levels. The
measure of polarization is defined as unidirectional: Atlantic provinces exhibit the highest levels of
people feel alienation from those at lower risk polarization in employment, indicating significant
than themselves (proportional to the relative risk), potential for disruption of their labour markets
but feel no alienation toward those with jobs that since workers in those provinces are likely to have
are more susceptible to automation. The portion more difficulty than workers elsewhere finding
of employment vulnerable to automation takes new employment quickly. At the same time,
into account the average level and percentage of Newfoundland and Labrador and Nova Scotia
employment theoretically at risk of automation. The have lower proportions of employment vulnerable
portion of employment in occupations at high risk to automation than most of the rest of the country.
of automation is included to account for the shorter The difficulty of retraining and transitioning
time horizon for potential disruption, since these workers due to the significant polarization of
occupations are likely to be automated sooner. employment, however, leaves significant potential
British Columbia and Ontario are the provinces for disruption in those two provinces.
least at risk of disruption in their labour markets
and have low levels of polarization of risk across Readiness
occupations and industries (Figure 4).2 Alberta
and Quebec similarly exhibit low polarization The measure of the adult population’s “readiness”
of risk, but a higher proportion of overall to adapt to technological change incorporates
measures of basic core skills (literacy and numeracy)
2 See Appendix Table A-1 for details of the individual attributes of the automation risk composite measure by province.9 Commentary 499
Figure 3: Readiness to Adapt to Technological Change, by Province
Source: Author’s calculation.
and the portion of the population that can solve foundational nature of these core skills, they weigh
problems in a technology-rich environment.3 most heavily in the overall readiness measure.4
Proficiency in these basic core skills allows workers Being ready for new technology also means being
to redeploy their skills with relatively minor able to adopt it. Developing and adapting to new
retraining in the event that their job is automated. technologies requires people at the forefront of
Further, literacy and numeracy are the foundation their field to have advanced knowledge of the areas
on which more advanced skills, such as computer for which the technologies are being developed.
programming, can be built. Because of the The “readiness” measure includes the employment
3 Measures of literacy and numeracy are weighted to account for the distribution of employment in each province. The
portion of the population that can solve problems in a technology-rich environment is the percentage of people, including
non-respondents, who score at a proficiency level of 2 or above in problem solving in a technology-rich environment.
4 The choice of weights in the “readiness” index is the subjective importance of each component (see Appendix Table
A-3). The ordinal ranking of provinces is not sensitive to this choice, and is comparable to results calculated with all the
components in the index equally weighted.10
rate and the portion of the population that holds a workforce and the susceptibility to automation in
postgraduate degree (Table 2). each province. They are meant, as starting point in
As Figure 3 shows, workers in Ontario and developing proper policy responses, to yield insight
Alberta are the most ready to adapt to technological about differences between provinces and to signal
change, with the highest levels of core skills in the province-wide policy priorities.
country.5 Nova Scotians lead the country in terms A follow-up exercise to compute a risk/readiness
of their ability to solve problems in a technology- measure would account for differences in risk and
rich environment. Ontario and Nova Scotia have skills levels across local labour markets and age
the advantage of a higher concentration of people groups and the responsiveness of programs to meet
with a postgraduate degree, who are well positioned localized needs. Although the risk of automation
to adapt new technologies to new applications does not change with age, younger workers have a
and facilitate their adoption. In contrast, workers greater incentive to adapt to technological change
in New Brunswick and Newfoundland and than do older workers, who might choose to retire
Labrador are the least prepared to adapt to instead of investing in new skills to stay in the
technological change. The adult populations in labour market. Further, the appropriate government
these provinces score the lowest on all core skills supports to assist displaced workers might need to
(literacy, numeracy and problem solving in a vary by age and existing workforce skills. Similarly,
technology-rich environment). These two provinces the geographical distribution of skills or potential
also have a smaller proportion of postgraduate automation within provinces matters: some regions
degree holders than do the other provinces, which might be particularly susceptible to disruption
partially explains the lower levels of core skills in due to the presence of large local industries with
their labour force (since scores are correlated with employment in automatable occupations.
education level).6 In addition, the employment rate Of the 10 provinces, Ontario and Alberta
of postgraduate degree holders in New Brunswick are the best positioned in terms of readiness for
and Newfoundland and Labrador is low relative automation, with both scoring above average across
to other provinces, potentially signalling a lack of all components of the measure (Figure 5). Workers
opportunity in high-skill, specialized careers in in British Columbia and Ontario face the lowest
those two provinces. risk of disruption due to automation. Those two
provinces also face a relatively low polarization
Putting It All Together of risk in the distribution of employment and a
smaller fraction of employment in occupations
Incorporating the potential for automation with that are likely automatable. The labour market in
considerations of the skills level of the population, Quebec faces a lower risk of disruption than the
labour market composition and economic Canadian average, but Quebec’s adult population
diversification in each province shows that some exhibits average levels of core skills. Nova Scotians
provinces are better positioned than others to adapt score above average in terms of skills, with the
to technological change (Figure 5). These measures largest portion of the population able to solve
are general indicators of the skills level of the problems in a technology-rich environment, but
5 See Appendix Table A-4 for details of the individual attributes of automation readiness by province.
6 The correlation between all indicators in the readiness and risk indices can be found in Appendix Table A-5 and A-6,
respectively.11 Commentary 499
Table 2: Components of Measure of Readiness to Adapt to Technological Change
Weight Indicator
Core skills
• literacy,
0.8
• numeracy,
• problem solving in a technology-rich environment
Advanced education
0.2 • percent of population with a postgraduate degree
• employment rate of people with a postgraduate degree
Source: Author’s definition.
Figure 4: Risk of Disruption in the Labour Market due to Technological Change, by Province
Source: Author’s calculations.12
Figure 5: Risk and Readiness, by Province
Readiness
1
0.9 Ontario
Alberta
0.8 Nova Scotia
0.7 British Columbia Canada
0.6
0.5 Quebec Prince Edward Island
Manitoba
0.4
Saskatchewan
0.3
0.2
0.1 Newfoundland and Labrador
New Brunswick
0
0 0.1 0.2 0.3 0.4 0.5 0.6 0.7 0.8 0.9 1
Risk
Source: Author's calculations.
risk of automation in that province’s labour market for skills in the labour market continues to grow,
is similar to the Canadian average. Saskatchewan however, there is room for public policy to moderate
and Prince Edward Island face the highest risk of the effect of technological change on the labour
technological unemployment, with relatively high market in a number of ways.
percentages of employment in occupations that are In developing policies, to facilitate the transition
likely automatable. Workers in New Brunswick and to a high-tech future, provinces facing a lower risk
Newfoundland and Labrador are the least ready to of disruption might be able to leverage existing
adapt to technological change. policies and expand educational or unemployment
support where necessary, while those that face
Polic y Implic ations a nd a higher risk of labour market disruption might
Conclusion require a broader approach. Indeed, evidence
suggests that innovation policy is more likely to be
The process of technological progress is one of successful if it integrates considerations for talent
creative destruction, where some occupations, and knowledge, entrepreneurship and business
skills, products and firms become obsolete and are growth, innovation in government, and clarity of
replaced by technologically superior alternatives. purpose for government support (Schwanen, 2017).
Given historical trends of employment, it seems The federal and some provincial governments
unlikely that all occupations that are highly have begun to adapt existing policies to support
susceptible to automation will be replaced by smart workers displaced by technology. For example,
machines over the next few years. As the demand13 Commentary 499
Ottawa has leveraged the existing flexibility of Differences in the composition of employment
the employment insurance program to ensure and skills levels across the country highlight
that workers can return to school without losing priority areas that provincial governments should
their eligibility, and Ontario has expanded access consider in developing education and employment
to its Student Assistance Program to mature policy responses to adapt to current and future
students. More concentrated efforts to bolster the technological change. Disruption as a result of
interpersonal and creative problem-solving skills technological change is not a uniform process, so
of the workforce also might be required to adapt to the policies to tackle it similarly should not be
technological change. uniform, but should take into account each region’s
strengths and weaknesses.14
A ppendi x:
Me a sur ing R isk of a nd R e a diness for Disruption
Risk
Using the risk of automation for each occupation in Canada from Oschinski and Wyonch (2017),
I evaluate the composition of employment by the polarization of risk in industrial composition and
employment by occupation (Labour Market Information Council 2015). To measure the polarization of
risk over the distribution of employment, the distribution of risk over employment is defined as
(π , y ) def= (π1 ,…, π n ; y1 ,…, yn ) ,
where πi denotes the proportion of employment and yi Є[0,1]denotes the risk level in risk category i.
The polarization measure is defined as
n n
(
P (π , y ) = ∑∑π 1i +α π jδ yi , y j
=i 1 =j 1
)
where α denotes the sensitivity to polarization and δ denotes the antagonism people feel between each
category. I define the antagonism function as δ(yi,yj) = max{yj-yi,0}, which can be interpreted as the
alienation people feel toward those at lower risk than themselves (proportional to the relative risk) but
not toward those who are more highly susceptible to automation. Following the numerical calculation
of Esteban and Ray (1994), α = 1.6. This measure is calculated for the polarization of risk in overall
employment and in industrial composition. The measures have been normalized over provinces to yield a
score for each province between 0 and 1. Finally, to account for varying levels or susceptibility across the
country, the measure of risk incorporates the percentage of employment in each province that is highly
susceptible to automation, the percentage that theoretically could be automated and the average risk of
automation over employment. See Table A-2 for detailed results by province.15 Commentary 499
Table A1: Components of Measure of Risk of Automation
Weight Indicator
0.4 Polarization of Risk over the distribution of employment
0.5 • Polarization of Risk over distribution by industrial composition of employment
0.5 • Polarization of risk over distribution of employment by occupation
0.6 Portion of Employment Vulnerable to Automation
0.25 • Percent of Total Employment Theoretically Automatable
0.25 • Average Automation Risk Level of All Employment
0.5 • Percent of Employment in Occupations at High Risk of Automation
Sources: Labour Market Monitoring Toolkit (2015); Oschinski and Wyonch (2017).
Table A2: Attributes Contributing to Automation “Risk” Composite Measure, by Province
Rank Overall Polarization Polarization Percent of Average Percent of Em-
of Risk in of Risk in Employment Risk ployment at High
Employment Industrial Possibly Level Susceptibility to
[0-1] Composition Automatable Automation
[0-1]
Canada 0.44 0.16 0.87 45.1 0.54 33.5
Newfoundland and
7 0.52 1.00 1.00 36.7 0.58 30.4
Labrador
Prince Edward
9 0.67 0.90 0.46 41.3 0.60 35.7
Island
Nova Scotia 5 0.41 0.42 0.61 42.6 0.55 32.8
New Brunswick 6 0.50 0.58 0.47 42.6 0.57 33.9
Quebec 4 0.31 0.15 0.14 45.6 0.53 34.1
Ontario 2 0.22 0.04 0.00 45.4 0.53 33.1
Manitoba 8 0.53 0.14 0.41 46.5 0.56 36.5
Saskatchewan 10 0.68 0.14 0.28 48.2 0.59 39.0
Alberta 3 0.31 0.00 0.13 45.8 0.55 33.8
British Columbia 1 0.17 0.01 0.16 43.6 0.53 31.4
Source: Author’s calculation.16
Readiness
Using information from Statistics Canada’s Labour Force Survey and the Programme for International
Assessment of Adult Competencies (PIAAC), I assess the level of basic core skills and education in the
adult population of each province. PIAAC assesses literacy, numeracy and ability to solve problems in a
technology-rich environment. Each skill is scored on a 500-point scale, with scores divided into levels
of proficiency based on the associated competencies. Literacy and numeracy are scored in five levels and
problem solving in three levels. Each metric represents a pillar of a basic skill level that would make it
possible for a person to adapt in the face of losing their job to technology, either through more training or
simply a redeployment of existing skills in a new area. Accordingly, the measure of readiness incorporates
the average literacy and numeracy scores of the labour force (ages 25 and older) and the percentage of the
population scoring at level 2 or higher for problem solving in a technology-rich environment.
The ability to adopt technology also depends on the percentage of the population with advanced skills
capable of developing and deploying various technologies to specific applications. To account for this, the
readiness score incorporates a relative measure of the percentage of the population in each province that
holds a postgraduate degree and the employment rate of postgraduate degree holders. See Table A-4 for
detailed results by province.
Table A3: Attributes Contributing to Automation “Readiness” Composite Measure, by Province
Weight Indicator Data
0.8 Core Skills (PIAAC)
0.25 Literacy Average PIAAC scores weighted by employment by
occupation, employed population 16 to 65.
0.25 Numeracy Statistics Canada. Table 477-0083.
Percent of the employed population (aged 16 to 65) scoring
at level 2 or 3 in PIAAC problem solving in a technology-
0.3 Problem Solving in a Technology-Rich Environment
rich environment.
Statistics Canada. Table 477-0084
0.2 Advanced Education
Percent of population (25 years and over) with educational
0.1 Percent of population with graduate degrees attainment above a bachelor’s degree.
Statistics Canada. 2016. Table 282-0004.
Employment rate of population (25 years and over) with
0.1 Employment rate of people with graduate degrees educational attainment above a bachelor’s degree.
Statistics Canada. 2016. Table 282-0004.
Source: Statistics Canada.17 Commentary 499
Table A4: Attributes Contributing to Automation “Readiness” Composite Measure, by Province
Rank Overall Literacy Numeracy Problem Percent of Percent of Post
Readi- Solving in a population Grad popula-
ness technology- with a post- tion Employed
rich grad certifica-
environment tion
Canada 0.70 277.5 271.0 39.6 9.2 74.1
Newfoundland and
9 0.11 272.8 262.7 33.9 5.3 75.2
Labrador
Prince Edward
6 0.47 280.2 269.7 33.0 7.5 70.5
Island
Nova Scotia 3 0.81 279.0 269.4 42.4 10.1 73.0
New Brunswick 10 0.06 273.0 262.0 33.8 5.9 71.6
Quebec 5 0.49 274.4 271.5 36.4 8.0 74.5
Ontario 1 0.91 279.6 272.6 41.3 11.1 74.6
Manitoba 7 0.43 276.1 267.3 36.5 6.5 74.6
Saskatchewan 8 0.36 274.3 267.2 35.5 6.0 77.2
Alberta 2 0.83 279.3 271.9 41.1 8.3 74.9
British Columbia 4 0.69 277.4 270.0 41.7 8.9 70.9
Source: Author’s calculation.
Table A5: Correlation of Readiness Index Component Indicators
Literacy Numeracy Problem Solving Percent with Percent of Post
post-grad Grads Employed
certification
Literacy 1 0.76 0.58 0.76 -0.31
Numeracy 0.76 1 0.66 0.81 0.02
Problem Solving 0.58 0.66 1 0.84 0.01
Percent with post-grad
0.76 0.81 0.84 1 -0.18
certification
Percent of Post Grads
-0.31 0.02 0.01 -0.18 1
Employed
Source: Author’s calculation.18
Table A6: Correlation of Risk Index Component Indicators
Polarization Polarization Total Average Risk Percent at High
employment Industry Employment at Risk
composition risk
Polarization employment 1 0.66 -0.85 0.66 -0.21
Polarization Industry
0.66 1 -0.63 0.35 -0.28
composition
Total Employment at risk -0.85 -0.63 1 -0.27 0.68
Average Risk 0.66 0.35 -0.27 1 0.48
Percent at High Risk -0.21 -0.28 0.68 0.48 1
Source: Author’s calculation.19 Commentary 499
R EFER ENCES
Acemoglu, Daron, and Pascual Restrepo. 2016. “The Manaris, Marvin. 1998. “Natural Language Processing:
Race between Machine and Man: Implications A Human-Computer Interaction Perspective.”
of Technology for Growth, Factor Shares, and Advances in Computers 47: 1–66.
Employment.” NBER Working Paper 2252. Oschinski, Matthias, and Rosalie Wyonch. 2017. Future
Cambridge, MA: National Bureau of Economic Shock? The Impact of Automation on Canada’s Labour
Research. Market. Commentary 472. Toronto: C.D. Howe
Brynjolfsson, Erik, and Andrew McAfee. 2014. The Institute. March.
Second Machine Age: Work Progress and Prosperity in Schwanen, Daniel.2017. Innovation Policy in Canada: A
a Time of Brilliant Technologies. New York: W.W. Holistic Approach. Commentary 497. Toronto: C.D.
Norton. Howe Institute. December.
Esteban, Joan-Maria, and Debraj Ray. 1994. “On the
Measurement of Polarization.” Econometrica 62 (4):
819–51.
Howitt, Peter. 2015. Mushrooms and Yeast: The
Implications of Technological Progress for Canada’s
Economic Growth. Commentary 433. Toronto: C.D.
Howe Institute. September.
Krugman, Paul. 2013. “Sympathy for the Luddites.”
New York Times, June 13.
Labour Market Information Council. 2015. “Labour
Market Monitoring Toolkit.” Table 17.
Levy, Frank, and Richard Murnane. 2004. The New
Division of Labor: How Computers Are Creating the
Next Job Market. Princeton, NJ: Princeton University
Press.R ecent C.D. How e Instit ute Public ations
January 2018 Laurin, Alexandre. “Two-Parent Families with Children: How Effective Tax Rates Affect Work
Decisions.” C.D. Howe Institute E-Brief.
December 2017 Hunter, Lawson, Kenneth G. Engelhart, Peter Miller. Strengthening Canadian Television Content:
Creation, Discovery and Export in a Digital World. C.D. Howe Institute Commentary 498.
December 2017 Schwanen, Daniel. Innovation Policy in Canada: A Holistic Approach. C.D. Howe Institute
Commentary 497.
December 2017 Found, Adam, and Peter Tomlinson. “Business Tax Burdens in Canada’s Major Cities: The 2017
Report Card.” C.D. Howe Institute E-Brief.
November 2017 Ciuriak, Dan, Lucy Ciuriak, Ali Dadkhah, and Jingliang Xiao. “The NAFTA Renegotiation:
What if the US Walks Away?.” C.D. Howe Institute Working Paper.
November 2017 Dachis, Benjamin, William B.P. Robson, and Farah Omran. Fuzzy Finances: Grading the
Financial Reports of Canada’s Municipalities. C.D. Howe Institute Commentary 496.
November 2017 Mahboubi, Parisa. “Talkin’ ’Bout My Generation: More Educated but Less Skilled Canadians.”
C.D. Howe Institute E-Brief.
November 2017 Robson, William B.P. Rethinking Limits on Tax-Deferred Retirement Savings in Canada. C.D.
Howe Institute Commentary 495.
November 2017 Found, Adam. “Flying Below the Radar: The Harmful Impact of Ontario’s Business Property
Tax.” C.D. Howe Institute E-Brief.
October 2017 Cross, Philip. “Revisions to Economic Statistics and Their Impact on Policymaking.” C.D.
Howe Institute Working Paper.
October 2017 Gordon, Daniel V., and Jean‐François Wen. A Question of Fairness: Time to Reconsider Income-
Averaging Provisions. C.D. Howe Institute Commentary 494.
October 2017 Laurin, Alexandre. Off Target: Assessing the Fairness of Ottawa’s Proposed Tax Reforms for “Passive”
Investments in CCPCs. C.D. Howe Institute Commentary 493.
September 2017 Dachis, Benjamin, Blake Shaffer, and Vincent Thivierge. All’s Well that Ends Well: Addressing
End-of-Life Liabilities for Oil and Gas Wells. C.D. Howe Institute Commentary 492.
Support the Instit ute
For more information on supporting the C.D. Howe Institute’s vital policy work, through charitable giving or
membership, please go to www.cdhowe.org or call 416-865-1904. Learn more about the Institute’s activities and
how to make a donation at the same time. You will receive a tax receipt for your gift.
A R eputation for Independent, Nonpa rtisa n R ese a rch
The C.D. Howe Institute’s reputation for independent, reasoned and relevant public policy research of the
highest quality is its chief asset, and underpins the credibility and effectiveness of its work. Independence and
nonpartisanship are core Institute values that inform its approach to research, guide the actions of its professional
staff and limit the types of financial contributions that the Institute will accept.
For our full Independence and Nonpartisanship Policy go to www.cdhowe.org.C.D. HOWE
In stitute
67 Yonge Street, Suite 300,
Toronto, Ontario
M5E 1J8You can also read