Improved management practices - Case study
←
→
Page content transcription
If your browser does not render page correctly, please read the page content below

Case study

Improved management practices
The Queensland Government is committed to building       •   pest management
a strong and sustainable agricultural industry;              –– Targeted chemical application
which has been demonstrated through its ongoing                 (injecting rather than spraying)
commitment to the Reef Water Quality Protection Plan
                                                             –– Reduced chemical use
and other land management initiatives. Agricultural
practices may impact the environment and natural         •   soil and water management
resources that the industry depends on. However,
                                                             –– Reduced tillage
improving agricultural practices may result in a two-
                                                             –– Longer crop cycles
fold benefit of improved environmental outcomes and
economic benefit over the long term.                         –– Minimised traffic in wet season
                                                             –– Soil moisture monitoring
Modelling of a typical cane farm near Cairns showed
                                                             –– Interrow vegetation
that income increased by improving practices such as
                                                             –– Composting.
reducing tillage and nitrogen application and legume
fallow. Although analysis indicated a small reduction    Capital outlay was needed for purchasing three
in crop yield, financial returns were enhanced through   harvesters and a slasher and to make changes to
reduced tillage operations, increased efficiencies       the irrigation and fertigation system. The farmer
and inputs over a full crop cycle. Overall, operating    considered it a worthwhile investment as it led to a
with these improved practices provided important         20 per cent reduction in irrigation-related costs and
economic benefits to a farmer at the plot level and      improved soil and plant health.
resulted in positive effects on profitability.
                                                         Water monitoring equipment and a soil analysis was
A 95 hectare banana farm that adopted improved           also purchased, which resulted in a considerable
practices after Severe Tropical Cyclone Larry in         reduction in chemical (fertiliser and pesticide) costs.
2006, improved its financial viability, with benefits    For example:
extending to the bordering wetlands. The farm’s
                                                         • herbicide usage reduced by 50%
gross margin improved due to increased yields and
savings associated with improved practices, and the      • fungicide usage reduced by 60%
net present value of the practice change was positive.   • granular fertiliser usage reduced by 30%
Improved practices included:                             • no nematicides needed to be used.
• nutrient management
   –– Soil and leaf analysis                             There were also production benefits in terms of site
                                                         preparation as the use of the ripper and plough were
   –– Nutrient application matched to crop needs
                                                         down by 60 per cent and irrigation costs reduced.
   –– Fertigation and foliar application allowing
      smaller and more regular doses                     For more information on the Reef Water Quality
                                                         Protection Plan, go to www.reefplan.qld.gov.au. For
                                                         more examples of the economic benefits of improved
                                                         land management practices, please see the Improved
                                                         Practices Catalogue at www.daff.qld.gov.au.

38      State of Queensland agriculture report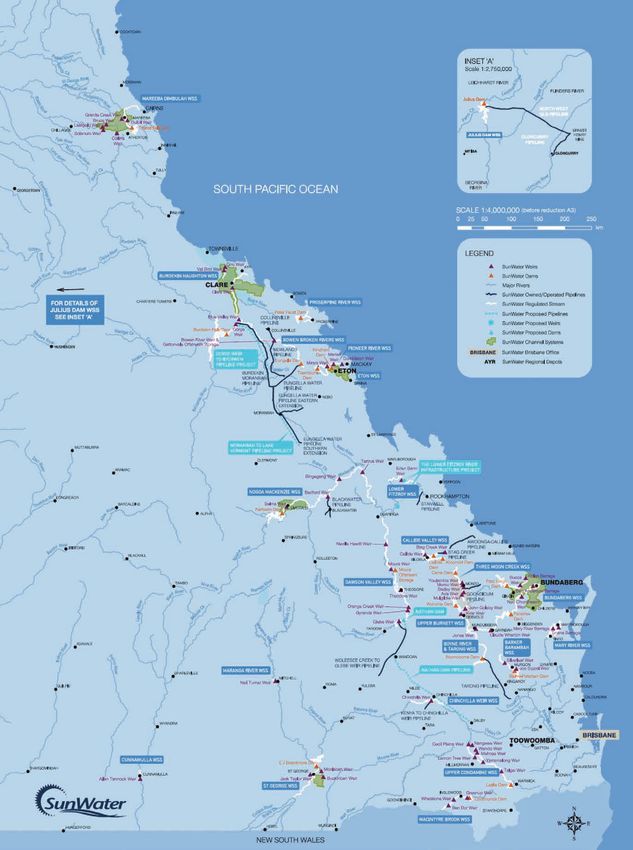
Water resources
Agriculture used just over two million megalitres of water in 2011–12, which is
equivalent to 60 per cent of Queensland’s total demand for water (see Table 2.5).
Cropping was responsible for the bulk of water usage.

Table 2.5   Water use in Queensland, 2011–12

                                                  Self-extracted           Distributed      Reuse        Total
                                                       (ML)                   (ML)           (ML)        (ML)
Agriculture

 Nursery and floriculture production                      8 505                    6 680         19        15 204

 Mushroom and vegetable growing                         69 060                    31 246       309        100 615

 Fruit and tree nut growing                              75 802                   46 606         51      122 460

 Sheep, beef cattle and grain farming                   212 107                   121 435      816       334 357

 Other crop growing                                     815 391               546 309         9 583     1 371 283

 Dairy cattle farming                                    31 014                    13 976       95        45 084

 Poultry farming                                          5 031                    2 697            0       7 728

 Deer farming                                                  2                       2            0            3

 Other livestock farming                                  11 015                   6 061         19       17 096

Total – Agriculture                                  1 227 926                    775 012    10 892     2 013 831

Aquaculture                                                                                         0        679

Forestry and logging                                                                                       3 302

Agriculture, forestry and                                 15 113                   9 284            0     24 398
fishing support services

Food, beverage and tobacco                               24 039                   45 784                  70 394
product manufacturing

Total of all uses                                    4 249 354               1 911 183       57 721     3 374 884
Source: Water Account, Australia, 2011–12, ABS 4610.0

Irrigation accounted for agricultural production worth $3.57 billion in Queensland in
2011–12, which was 35.6 per cent of the State’s total. The largest contributions went
into the following industries: cotton ($915 million), vegetables ($726 million),
fruit ($651 million) and sugar cane ($646 million). Irrigation’s largest contributions
by region were: Burdekin ($719 million), Border Rivers ($669 million) and
Burnett-Mary ($556 million).1

Water resources in Queensland are regulated through water resource plans for
23 water resource areas. A water resource plan for the Cape York region is currently
under development.

For more information on agricultural water use and water availability, refer to
the Land Audit at www.daff.qld.gov.au and the Minister’s Report 2012–2013 for
Queensland’s Water Resource Plans at www.dnrm.qld.gov.au.

1 Gross value of irrigated agricultural production, 2011–12, ABS 4610.0.55.008

                                                                                                                     39
Water storage levels
SunWater is a bulk water infrastructure developer and operator of Queensland’s
major water supply schemes. It supplies approximately 40 per cent of all water
used commercially in Queensland. SunWater provides water to over 5000
irrigation customers in the agriculture industry and also provides services for local
governments, mining and other industrial customers.
SunWater owns and manages around $7 billion in water infrastructure assets with
a distribution network in Queensland comprising 19 major dams, 63 weirs and
barrages, 80 major pumping stations, 2500 kilometres of pipelines and channels,
and 730 kilometres of drains (see Figure 2.4).
Table 2.6 outlines water storage levels as at June 2014. Up to date water storage
levels can be found on the SunWater website (www.sunwater.com.au).
40 State of Queensland agriculture reportTable 2.6 SunWater storage summary
Full capacity Current storage
Water supply scheme Storage
(ML) (ML) Date % full
Bjelke-Petersen Dam 134 900 91 400 06 Jun 2014 68
Barker Barambah Joe Sippel Weir 710 710 05 Jun 2014 100
Silverleaf Weir 580 550 06 Jun 2014 95
Bowen River Weir 943 940 25 May 2014 100
Bowen Broken Rivers Eungella Dam 112 400 112 300 06 Jun 2014 100
Gattonvale Offstream 5 230 4 920 04 Jun 2014 94
Boyne River and Tarong Boondooma Dam 204 200 158 000 06 Jun 2014 77
Ben Anderson Barrage 30 300 22 800 06 Jun 2014 75
Bucca Weir 11 600 6 770 06 Jun 2014 58
Fred Haigh Dam 562 000 489 600 06 Jun 2014 87
Bundaberg
Kolan Barrage 4 020 3 750 06 Jun 2014 93
Ned Churchward Weir 29 500 28 100 06 Jun 2014 95
Paradise Dam 300 000 165 100 06 Jun 2014 55
Burdekin Falls Dam 1 860 000 1 847 000 06 Jun 2014 99
Clare Weir 15 900 15 900 06 Jun 2014 100
Burdekin Haughton
Giru Weir 1 025 930 06 Jun 2014 91
Val Bird Weir 615 610 03 Jun 2014 99
Callide Valley Callide Dam 136 370 88 500 06 Jun 2014 65
Kroombit Dam 14 600 6 610 06 Jun 2014 45
Chinchilla Weir Chinchilla Weir 9 780 9 410 06 Jun 2014 96
Cunnamulla Allan Tannock Weir 4 770 2 860 14 May 2014 60
Glebe Weir 17 700 17 200 06 Jun 2014 97
Gyranda Weir 16 500 15 400 06 Jun 2014 93
Moura Offstream 2 820 740 06 Jun 2014 26
Dawson Valley Moura Weir 7 700 7 400 06 Jun 2014 96
Neville Hewitt Weir 11 300 N/A N/A N/A
Orange Creek Weir 6 140 6 140 06 Jun 2014 100
Theodore Weir 4 760 4 350 06 Jun 2014 91
Eton Kinchant Dam 62 800 61 100 06 Jun 2014 97
Julius Dam Julius Dam 107 500 81 600 06 Jun 2014 76
Lower Fitzroy Eden Bann Weir 35 900 35 900 04 Jun 2014 100
Ben Dor Weir 700 670 05 Jun 2014 96
Macintyre Brook Coolmunda 69 000 35 300 06 Jun 2014 51
Whetstone Weir 506 500 05 Jun 2014 99
Maranoa River Neil Turner Weir 1 470 N/A N/A N/A
41Full capacity Current storage
Water supply scheme Storage
(ML) (ML) Date % full
Mareeba Dimbulah Tinaroo Falls Dam 438 920 398 200 06 Jun 2014 91
Mary Barrage 12 000 12 000 06 Jun 2014 100
Mary River
Tinana Barrage 4 750 4 750 06 Jun 2014 100
Bedford Weir 22 900 18 000 02 Jun 2014 79
Bingegang Weir 8 060 8 030 22 Apr 2014 100
Nogoa Mackenzie
Fairbairn Dam 1 301 000 664 700 06 Jun 2014 51
Tartrus Weir 12 000 12 000 06 Jun 2014 100
Dumbleton Weir 8 840 6 260 06 Jun 2014 71
Marian Weir 3 980 3 980 06 Jun 2014 100
Pioneer River
Mirani Weir 4 660 2 940 06 Jun 2014 63
Teemburra Dam 147 500 147 500 06 Jun 2014 100
Proserpine River Peter Faust Dam 491 400 471 400 06 Jun 2014 96
Buckinbah Weir 5 120 4 490 06 Jun 2014 88
EJ Beardmore Dam 81 700 73 400 06 Jun 2014 90
St George
Jack Taylor Weir 10 270 9 260 06 Jun 2014 90
Moolabah Weir 3 950 1 060 06 Jun 2014 27
Three Moon Creek Cania Dam 88 500 81 200 06 Jun 2014 92
Claude Wharton Weir 12 800 8 270 06 Jun 2014 65
John Goleby Weir 1 690 1 690 06 Jun 2014 100
Upper Burnett Jones Weir 3 720 3 680 05 Jun 2014 99
Kirar Weir 9 540 9 540 06 Jun 2014 100
Wuruma Dam 165 400 134 300 06 Jun 2014 81
Leslie Dam 106 200 41 400 06 Jun 2014 39
Upper Condamine
Yarramalong Weir 390 280 06 Jun 2014 72
Total 6 729 529 5 441 000 81
Source: SunWater current storage summary – April 2014, SunWater
42 State of Queensland agriculture reportFigure 2.4 SunWater operations and infrastructure 2013
Source: SunWater 2012–13 Annual Report, SunWater
43Table 2.7 SEQWater Current Storage Summary
Full Capacity Current Storage
Storage
(ML) (ML) Date % Full
Atkinson Dam 30 401 20 069 06 Jun 2014 66
Baroon Pocket Dam 61 000 42 512 06 Jun 2014 70
Bill Gunn Dam 6 947 5 245 06 Jun 2014 76
Borumba Dam 45 952 46 048 06 Jun 2014 100
Bromelton Dam 8 210 5 623 06 Jun 2014 69
Cedar Pocket Dam 730 768 06 Jun 2014 105
Cooloolabin Dam 13 820 7 116 06 Jun 2014 52
Enoggera Dam 4 567 4 565 06 Jun 2014 100
Ewen Maddock Dam 16 587 16 371 06 Jun 2014 99
Gold Creek Dam 801 774 06 Jun 2014 97
Hinze Dam 310 730 287 668 06 Jun 2014 93
Lake Clarendon Dam 24 276 17 969 06 Jun 2014 74
Lake Macdonald 8 018 8 120 06 Jun 2014 101
Lake Manchester Dam 26 217 26 004 06 Jun 2014 99
Leslie Harrison Dam 24 868 18 703 06 Jun 2014 75
Little Nerang Dam 6 705 5 805 06 Jun 2014 87
Maroon Dam 44 319 41 918 06 Jun 2014 95
Moogerah Dam 83 765 78 477 06 Jun 2014 94
Nindooinbah Dam 322 212 06 Jun 2014 66
North Pine Dam 214 302 160 812 06 Jun 2014 75
Poona Dam 655 505 06 Jun 2014 77
Sideling Creek Dam 14 370 10 768 06 Jun 2014 75
Somerset Dam 379 849 377 328 06 Jun 2014 99
Wappa Dam 4 694 4 699 06 Jun 2014 100
Wivenhoe dam 1 165 238 1 053 447 06 Jun 2014 90
Wyaralong Dam 102 883 101 435 05 Jun 2014 99
Total 2 600 226 2 342 961 90
Source: SEQWater Latest Dam Levels, June 2014
44 State of Queensland agriculture reportDeclared Fish Habitat Areas
Over one million hectares of Queensland’s key coastal fish habitats are protected
through the declaration of 70 Fish Habitat Areas (FHAs). These FHAs protect the
habitat from development impacts in order to maintain fisheries’ productivity.
The FHA network focuses on estuarine and coastal habitats that support up to
75 per cent of Queensland’s commercial catch and most of the recreational and
traditional fishing catch. For more information on the status of Queensland’s
declared FHAs, refer to the Declared Fish Habitat Area Network Assessment Report
2012 at www.nprsr.qld.gov.au.
People
Queensland’s agriculture, forestry and fishing sector directly employed around
60 000 people in 2013.
• The 2013 figure is down from over 80 000 in 1985, which is a rate of decline of
1.1 per cent per annum. This rate of decline is projected to continue in the
medium term to 2018.2
• 76 per cent of these people were employed full-time.3
• In 2011–12, an estimated 36 610 were employed in sheep, beef and grain, 2250 in
dairy, 5710 in fruit and tree nut growing, 6130 in vegetables, 4560 in agriculture
and fishing services, and 3010 in other livestock farming. 4
• 70 per cent were male employees. Gender balance has not changed since the
early 1990s after recording strong increases in women’s participation in the
1970s and 1980s. The increase probably reflected the ability of women to more
accurately describe their farm management role, rather than an increase in
participation per se.
• 48 per cent of those employed in agriculture, forestry and fishing were
managers and 29 per cent were labourers. Other major occupational groups
were technicians and trades, clerical and administrative, machinery operators
and drivers (accounting for 6 per cent) and professionals (accounting for
2 per cent).
• 61 per cent were employees, 29 per cent were self-employed and 9 per cent
were employers.
• In 2012 the average age of owner-managers of Queensland broadacre farms
was 61 years, up from 54 years in 1990.5 A recent Rural Industries and Research
Development Corporation (RIRDC) study largely attributes the increasing age of
farmers to the decline in the number of farms.6
2
Employment projections, Department of Employment, http://lmip.gov.au/default.aspx?LMIP/
EmploymentProjections
3 Although not necessarily full-time in agriculture, agriculture was their main job but some would have
second jobs in other industries. These figures also do not include people who are employed part-time
in agriculture and have a full-time job in another industry.
4 Employment and Workplace Relations 2012, Department of Education, http://www.deewr.gov.au/
lmip/default.aspx?LMIP/Publications/IndustryEmploymentProjections
5 A gSurf database, ABARES
6 New entrants to Australian agricultural industries – Where are the young farmers? February
2014, RIRDC
45The food and beverage processing sector in Queensland is made up of approximately
1200 businesses. The majority of the sector (95 per cent) comprises micro- or
small-sized businesses (under 20 staff) and medium-sized businesses (under
200 staff).
An estimated 300 000 people are employed across the agricultural supply chain as
a whole:
• 4000 in the production of inputs to the Queensland agriculture, fisheries and
forestry sector 7
• 62 000 in agriculture, fisheries and forestry in 20138
• 42 000 in food processing as at June 20139
• 97 500 in food wholesale and retail in 201310
• 58 000 in food service in 201311
• 37 000 employed in the transport and logistics of food between these sectors
in 201312
An ageing workforce, combined with increased competition and decreasing
enrolments in agricultural courses is impacting on the productivity of the industry,
and this is likely to continue.
At the same time, there has been a shift towards the use of contract workers by
agribusinesses to enable more efficient use of workers at peak times. This alleviates
some of the additional requirements and costs associated with, but not limited to,
leave entitlements, insurance and workplace health and safety.13
For further information at a national level, refer to the Blueprint for Australian
Agriculture 2013–2020 at www.nff.org.au.
7 Labour Force, Australia, detailed, quarterly, Feb 2014, derived from ABS 6291.0.55.003; Food for a
growing economy, 2011, Queensland Government
8 Labour Force, Australia, detailed, quarterly, Feb 2014, ABS 6291.0.55.003
9 Australian industry, 2011–12, ABS 8155.0
10 Labour Force, Australia, detailed, quarterly, Feb 2014, derived from ABS 6291.0.55.003; Food for a
growing economy, 2011, Queensland Government
11 Labour Force, Australia, detailed, quarterly, Feb 2014, derived from ABS 6291.0.55.003; Food for a
growing economy, 2011, Queensland Government
12 Labour Force, Australia, detailed, quarterly, Feb 2014, derived from ABS 6291.0.55.003;
OESR Input–Output tables 2005–06
13
Agriculture: ISB 2013 Workforce development and planning, DAFF
46 State of Queensland agriculture reportLabour shortfall
In 2013, only 2100 people whose last job was in agriculture, forestry or fishing, were
identified as being unemployed. This represents an unemployment rate of
3.3 per cent, which is well below the all-industry average, suggesting that labour
supply for the sector is limited.
The 2012 Agriculture Workforce Development and Planning Report identified a labour
shortfall in Australia of 96 000 full-time workers.14
AgForce has quantified the labour shortfall in Queensland’s beef and sheep
meat and grain industries as 5000 skilled full-time employees and 17 000 casual
employees.15
Apprenticeships and traineeships
Approximately 1600 young people enter agriculture-related apprenticeships and
traineeships each year, although the combined intake slumped to under 900 in
2012–13. The completion rate averages over 60 per cent, which is slightly below the
all-occupations average of 67 per cent.
Little growth in the uptake of apprenticeships and traineeships may be partly
due to industry preferences for skill sets, training and non-accredited extension.
The relatively low completion rate may be attributed to participants failing to
continue to accreditation stage once they have learnt the required skills.
Skills demand
Many industries have identified their future training needs as technology and
innovation in new processes and machinery.
Based on intelligence from 11 of Queensland’s agricultural peak bodies, the two key
training areas demanded by most agricultural industries in Queensland are business
and professional services, and maintenance and farm assistance skills.
Workers are increasingly being shared across industries, emphasising the need for
common skills, such as:
• succession planning, reflecting an ageing workforce
• workplace health and safety
• business and financial management across industries
• mechanical and machinery maintenance
• farm assistance skills
• biosecurity (pest and disease identification and management).
14
Agriculture: ISB 2013 workforce development and planning, DAFF
15
Skills and labour news review analysis, 2012, AgForce
47Investment
Industry investment
In 2011–12, $16.2 billion was invested in the agriculture, fisheries and forestry
sector nationally. This represents 6.6 per cent of the total $246.5 billion invested
across the four major sectors—services, manufacturing, mining, and agriculture,
fisheries and forestry.
The $16.2 billion investment represents an 18.7 per cent annual growth in
investment for agriculture, fisheries and forestry. This was a higher annual growth
rate than in the services and manufacturing sectors, but lower than mining. While
investment projects can be irregular and averages are often skewed by large
transactions, it suggests that agriculture is receiving its share of investment.
Table 2.8 Australian industry investment, 2011–12
Agriculture,
Services Manufacturing Mining forestry and Total
fishing
Levels ($b) 106.9 20.8 102.6 16.2 246.5
Industry share (%) 43.4 8.4 41.6 6.6 100.0
Annual growth (%) 0.0 5.6 57.1 18.7 20.0
Source: Key facts Australian industry 2011–12, Department of Industry
Across the agribusiness supply chain, which includes first round processing, there
was significant additional investment in 2011–12 in the manufacturing sector.16 This
additional investment was in the following manufacturing industries:
• food, beverage and tobacco products ($4.28 billion)
• wood, pulp and paper products ($2.05 billion)
• furniture and other manufacturing ($2.21 billion).
An alternative measure of investment for Australia as a whole can be derived from
ABS estimates of capital inputs. These estimates account for depreciation of capital
assets and exclude land purchases. In 2012–13, the estimated value of capital
inputs to agriculture increased by $6.6 billion in real terms to $177.3 billion
(see Figure 2.5). This represents an average increase of 1.1 per cent per annum since
1989–90. However, all of the increase has occurred since 2002–03, suggesting a
significant improvement in business confidence in the sector since that time.
It is clear that investment funds continue to flow to agriculture suggesting a level of
confidence in the future of the sector.
16 Key facts Australia Industry 2011–12, Department of Industry
48 State of Queensland agriculture reportFigure 2.5 Change in productive capital stock chain volume measure in Australia –
agriculture, fisheries and forestry
8
7
6
5
4
3
$b
2
1
0
-1
-2
-3
1990–91
1992–93
1996–97
1998–99
2000–01
2002–03
2004–05
2006–07
2008–09
2010–11
2012–13
1994–95
Source: Estimates of industry multifactor productivity, 2012–13, ABS 5260.0.55.002
Foreign investment
Foreign investment in land is a significant issue in Australia, with concerns about
potentially adverse impacts on the competitiveness of the agriculture, fisheries and
forestry sector and, more broadly, on national identity. Such concerns need to be
weighed against the potential benefits of foreign investment, including access to
markets, technology and capital.
In December 2010, 99.4 per cent of Queensland farm businesses were wholly
Australian-owned, covering 88.2 per cent of the area of agricultural holdings and
92.0 per cent of water entitlements. An estimated 16.3 million hectares was under
foreign ownership, in whole or part.17 As there has been some level of foreign
ownership of the sector for decades, this information does not suggest that the
level of foreign ownership is increasing rapidly.
The Foreign Investment Review Board (FIRB) examines proposals by foreign
investors in Australia and makes recommendations to the Federal Treasurer on
investments that are subject to the Foreign Acquisitions and Takeovers Act 1975
and Australia’s foreign investment policy. In 2011–12, agriculture, fisheries and
forestry accounted for $3.6 billion in FIRB approvals. This was only 2 per cent of
total approvals, compared with 35 per cent for real estate and 30 per cent for
mineral exploration and development.
17 Agricultural land and water ownership, December 2010, Australian Bureau of Statistics 7127.0
49Foreign investment also occurs in processing assets. For example, this was
demonstrated by the takeover of Sucrogen (previously CSR Sugar) by Singaporean
agribusiness giant, Wilmar International Limited, in late 2010. This was followed by
the purchase of Mulgrave Mill and Bundaberg Sugar’s Far North Queensland mills
by Maryborough Sugar Factory (MSF). MSF brought about the closure of the Babinda
Mill; and in early 2012, Thailand’s biggest producer of sugar, Mitr Phol Sugar Corp,
stepped up its stake in MSF. Chinese company, COFCO, took a controlling interest in
the Tully Mill in mid-2011 and Sucrogen acquired Proserpine Mill in mid-2012.18
Table 2.9 Foreign investment application – agriculture, fisheries and forestry, Australia
Three-year
2009–10 2010–11 2011–12
average
Number of approvals 17 17 49 28
Proposed investment ($b) 2.3 1.4 3.6 2.4
Percentage of all proposals 2.00 0.79 2.00 1.60
Source: FIRB Annual Report 2011–12, Foreign Investment Review Board
Over the five years to 2011–12, the average level of foreign investment in the
agriculture sector has been almost $2.5 billion per annum. It should be noted
that investment proposals vary greatly in size and averages can be skewed by
large transactions.
The three main investment strategies used by recent foreign buyers of agricultural
land in Australia appear to be:
• agribusiness companies (private or government-owned) seeking to extend their
activities up the supply chain to secure supply sources
• investment or pension funds seeking profits from owning and operating
Australian agricultural land
• mining companies seeking land predominantly for mining activities, while
maintaining some agricultural activities.
In 2011–12 the largest source countries of investment in the agriculture sector by
value were:
• Canada ($1.4 billion)
• UK ($0.6 billion)
• USA ($0.5 billion)
• Thailand ($0.3 billion)
• Singapore ($65 million)
• China ($27 million).
18 Statistics – Facts and Figures, CANEGROWERS
50 State of Queensland agriculture reportForeign Ownership of Land Register
The Foreign Ownership of Land Register is a public register of all land in Queensland
held by foreign persons or foreign companies, as defined in the Foreign Ownership
of Land Register Act 1988. This is a tighter definition of foreign ownership than that
used in the ABS survey quoted previously.
The Act provides for the disclosure of foreign ownership of land in Queensland. All
foreigners, defined under the Act, are required to notify the Registrar of Titles of any
acquisition or disposal of land or a relevant interest in land.
An interest in land, as defined under the Act, can include an interest in freehold
land, state leasehold land and other specific types of interests. The register is
available online at www.dnrm.qld.gov.au.
As at 30 June 2013, foreign-owned interests in land totalled 5 084 200 hectares,
representing less than 3 per cent of Queensland’s land area. There were 129
countries of origin recorded in the register.
While the register does not specifically identify foreign-owned land used for
agricultural purposes, it does highlight that there is significant foreign investment
in land within Queensland.
51Cattle and calves micro view – case study19
The northern Australian beef industry is currently suffering the bust stage in a
two decade cycle of boom and bust. Survey data from the ABARES and ABS for
specialist beef producing farms in Queensland reveals progression of the cycle
but not the outcomes.
The rate of return on equity generated by a business drives its capacity to expand
or service debt.
Specialist Queensland beef businesses showed a marked improvement in the
average rate of return on equity (net of capital appreciation) over the period
1997–98 to 2001–02. This improved profitability was based on productivity
improvements made during earlier decades and the rising price of beef.
Expectations that this would continue stimulated a round of capital expenditure
that included significant purchases of additional property and saw many beef
producers trading up.
Figure 2.6 Queensland Cattle Market Index
240
220
200
180
160
140
120
100
80
60
Mar–11
Mar–12
Mar–91
Mar–01
Mar–10
Mar–87
Mar–97
Mar–05
Mar–07
Mar–92
Mar–93
Mar–95
Mar–94
Mar–03
Mar–04
Mar–86
Mar–88
Mar–89
Mar–90
Mar–96
Mar–98
Mar–99
Mar–00
Mar–02
Mar–06
Mar–08
Mar–09
Source: Damon Holmes, Livestock Market Analyst, Meat and Livestock Australia
19 The farm survey data used in this analysis is available at http://abares.win.hostaway.net.au/AME/
mla/mla.asp
52 State of Queensland agriculture reportFigure 2.7 Rate of return on equity for specialist Queensland beef producers
(excluding and including capital appreciation)
20
15
Rate of return (%)
10
5
0
–5
1991–92
1992–93
1993–94
1994–95
1995–96
1996–97
1997–98
1998–99
1999–00
2000–01
2001–02
2002–03
2003–04
2004–05
2005–06
2006–07
2007–08
2008–09
2009–10
2010–11
Rate of return excluding capital appreciation
Rate of return including capital appreciation
Source: http://abares.win.hostaway.net.au/AME/mla/mla.asp
The initial round of enthusiasm for property expansion and aggregation led to an
across-the-board increase in asset valuations. By the mid-2000s lenders were
funding a bubble in land values of major proportions. As is generally the case in a
bubble, the lending was based on rapidly improving property valuations, not the
long-term prospects of success for the borrower.
Rates of return on capital (including capital appreciation) of 8 per cent to 15 per cent
per annum during this period caused some lenders and investors to seriously over
extend themselves. Essentially, they were paying prices for assets that could not be
justified by the underlying capacity of the beef business to service those debts.
Profitability improvements ceased from the early 2000s, partly reflecting the long
series of dry seasons in Queensland. While product prices remained high they
stopped increasing in Australian dollar terms. Expectations of future profitability
remained high, particularly as a result of growing demand from emerging economies
such as China.
This bubble was evident in many property markets around the world, bringing about
the GFC in 2008. The GFC inhibited lenders from funding new loans and the market
for beef properties became very subdued. The capital value of surveyed specialist
beef properties in Queensland peaked (in real terms) in 2006–07 then
subsequently declined.
This process is expected to continue until the relationship between land value and
expected profitability is restored. While markets are notoriously liable to
overshoot in such circumstances, it is unlikely to occur because of the continued
positive outlook for the global beef market.
53Figure 2.8 Land capital value for surveyed specialist Queensland beef producers
(expressed in constant 2010–11 dollars)
8
7
6
5
$m
4
3
2
1
0
1991–92
1992–93
1993–94
1994–95
1995–96
1996–97
1997–98
1998–99
1999–00
2000–01
2001–02
2002–03
2003–04
2004–05
2005–06
2006–07
2007–08
2008–09
2009–10
2010–11
Land capital value at 30 June
Widespread drought during the early and middle part of the last decade significantly
increased cash and non-cash costs, with 2006–07 being something of a watershed
year for both costs and asset values. The reduction in costs to their long-term level
(in real terms) since 2006–07 reflected the massive efforts of producers reducing
costs to survive. Better seasons in recent years have also contributed to the relative
reduction in costs.
Figure 2.9 Cash and non-cash costs incurred by surveyed specialist Queensland
beef farms
1 600 000
Expressed in 2010–11 dollars
1 400 000
1 200 000
1 000 000
800 000
600 000
400 000
200 000
0
1991–92
1992–93
1993–94
1994–95
1995–96
1996–97
1997–98
1998–99
1999–00
2000–01
2001–02
2002–03
2003–04
2004–05
2005–06
2006–07
2007–08
2008–09
2009–10
2010–11
Other costs Interest payments
Fuel, oil and lubricants Other livestock purchases
Livestock transfers—inwards Fodder
Seed, fodder and fertiliser
54 State of Queensland agriculture reportOne of the consequences of the asset price bubble was a build-up of debt levels
(see Figure 2.10). Profitability has been sufficient to enable significant reductions in
debt since the 2006–07 peak, and has been assisted by falling costs and interest
rates since that time. However, this remains a risk for the future of the industry,
particularly as current low interest rates cannot be expected to last indefinately.
Figure 2.10 Debt levels for surveyed specialist Queensland beef farms
1 200 000
Expressed in 2010–11 dollars
1 000 000
800 000
600 000
400 000
200 000
0
1991–92
1992–93
1993–94
1994–95
1995–96
1996–97
1997–98
1998–99
1999–00
2000–01
2001–02
2002–03
2003–04
2004–05
2005–06
2006–07
2007–08
2008–09
2009–10
2010–11
Land purchase debt Other debt
The Northern beef report – 2013 Northern beef situation analysis20 reaffirms these
trends by outlining the performance of the northern beef industry across Western
Australia, the Northern Territory and Queensland over the last 12 years.
Interestingly, while profits remain stable across the region, the increasing debt of
top performers has eroded profitability with wide variation across producers. The
superior performance of the top 25 per cent of producers can be attributed to higher
incomes from better herd productivity (through higher reproductive rates, lower
mortality rates and heavier sale weights) and lower operating expenses (through
better labour efficiency). There is little correlation with beef prices, rainfall and
land quality.
Importantly, there appears to be an optimal operating scale range, with herd sizes
on either side of the scale leading to reduced performance.
20 McLean et al (2014), The Northern beef report – 2013 Northern beef situation analysis, Meat and
Livestock Australia, B.COM.0348
55Case study
Information to support producers
As the production of food and fibre has changed, As social media continues to be a vital, word-of-
so have sources of information available to mouth tool, FutureBeef social media champions use
industry. In Queensland, extensive use of online Twitter and Facebook to keep producers connected,
technologies by the FutureBeef eExtension team included and informed. More in-depth information is
has enabled rapid, targeted and interactive available in FutureBeef eBulletins which are sent to
information sources in response to Queensland’s nearly 3000 subscribers.
worsening drought situation.
Because producers don’t all access information in
A dedicated drought page on the FutureBeef website the same way, drought-focused articles will soon
(http://futurebeef.com.au/topics/drought/) provides appear in all three FutureBeef newsletters—Northern
24/7 access to the latest drought information and Muster, Beeftalk and CQ BEEF. They will also appear
management options. The web page receives almost as feature articles in the North Queensland Register
100 unique visits per week. and Queensland Country Life (both in hardcopy and
online), which will communicate the information to
The webinar ‘Decisions for drought affected over 50 000 readers.
producers’ was developed and presented in
February 2014, attracting over 260 registrations.
The webinar focused on the current drought situation
and decisions that producers need to be making.
Attendees were also introduced to an interactive tool
to help them better calculate the financial options of
selling versus feeding stock. The webinar was posted
on the FutureBeef website and has already received
over 100 views in three months.
56 State of Queensland agriculture reportYou can also read