THE EFFECT OF URBANIZATION ON FOOD SECURITY AND AGRICULTURAL SUSTAINABILITY
←
→
Page content transcription
If your browser does not render page correctly, please read the page content below
76
 Natalia Vasylieva,                                                                         ISSN 2071-789X
 Harvey James, Jr.
                             INTERDISCIPLINARY APPROACH TO ECONOMICS AND SOCIOLOGY

                                            Vasylieva, N., & James, H. (2021). The effect of urbanization on food security
                                            and agricultural sustainability. Economics and Sociology, 14(1), 76-88.
                                            doi:10.14254/2071-789X.2021/14-1/5

                                           THE EFFECT OF URBANIZATION
                                              ON FOOD SECURITY AND
                                           AGRICULTURAL SUSTAINABILITY
     Natalia Vasylieva                   ABSTRACT. Because urbanization is an inevitable process
     Dnipro State Agrarian and              accompanying economic growth, this research specifies
     Economic University,                   impacts of urbanization on food security and agricultural
     Dnipro, Ukraine                        sustainability, with a particular focus on Ukraine. Using
     E-mail: vasylieva.n.k@dsau.dp.ua       methodological fundamentals of econometrics and
                                            divisive hierarchical clustering, the analysis depicts
     Harvey James, Jr.                      country features, world patterns, and notable examples of
     University of Missouri,                implementing food security and sustainable agricultural
     Columbia, MO, USA                      development. Data come from the Food and Agricultural
     E-mail: HJames@missouri.edu            Organization of the United Nations, the World Bank
                                            Data, and State Statistics Service of Ukraine. Polynomial
                                            regressions show gradual sustainable agricultural
     Received: March, 2020                  development in Ukraine driven by domestic urbanization
     1st Revision: January, 2021            from 1996 to 2018. The analysis identifies country
     Accepted: March, 2021                  standing among 186 states distributed into four major
                                            world clusters of the pruned binary tree and evaluated
                                            through urbanization and securing food availability and
     DOI: 10.14254/2071-
                                            affordability. The findings from comparative profiles of
     789X.2021/14-1/5
                                            selected leading countries determine prospects of
                                            Ukrainian urban market size, crop farming and animal
                                            husbandry, food production per capita, employment in
                                            agriculture, and share in GDP, both within and beyond
                                            the EU. Matching at a country level reconciles
                                            urbanization with providing food security and economic,
                                            environmental, and social components of agricultural
                                            sustainability.

     JEL Classification:C38, C51,        Keywords: trends of urbanization, world food security, divisive
     O13, O57                            hierarchical clusters, EU profiles of sustainable agriculture,
                                         Ukraine.

Introduction

       Growth of population and urbanization are core driving forces affecting the
sustainability of agricultural development and the nature of global food security. Sustainable
development is a prime goal of progress according to the Food and Agricultural Organization
(FAO) of the United Nations. It declared that “to be sustainable, agriculture must meet the needs
of present and future generations for its products and services, while ensuring profitability,
environmental health and social and economic equity” (FAO, 2020). McKenzie and Williams
(2015, p. 221) stated that “sustainability constitutes the entry point for all agricultural
development.” Food security is paramount since it provides “a universal human right that is

                                   Economics & Sociology, Vol. 14, No.1, 2021
77
Natalia Vasylieva, ISSN 2071-789X
Harvey James, Jr.
INTERDISCIPLINARY APPROACH TO ECONOMICS AND SOCIOLOGY
realized when all people have physical and economic access at all times to adequate food or the
means for its procurement, without discrimination of any kind” (FAO, 2020).
Urbanization is an inevitable trend of economic progress. Globally, total urban
population surpassed total rural population in 2008. Urbanization has dual implications for
agriculture. Firstly, urbanization correlates with economic growth. Thus, it amplifies
purchasing power of food consumers, increases their ability and willingness to pay more for
qualitative and diversified agricultural products, expands domestic markets, and incentivizes
export/import operations (Stage et al., 2009; Knorr et al., 2018). Small agricultural farmers face
significant pressures to consolidate their assets in order to increase the effectiveness of their
activities and remain competitive. Secondly, urbanization results in a reduction in viable
farmland and accelerates both environmental contamination and ecological degradation
(McKenzie and Williams, 2015; Katan et al., 2018). Consequently, agriculture becomes more
dependent on intensive technologies, advanced processing, and innovative management
practices (Seto and Ramankutty, 2016). This is why it is important to focus on the beneficial
and disadvantageous impacts of urbanization on developing agricultural sustainability and
mitigating perils of food insecurity.
Exploring the link between urbanization and food security is a pressing issue. Thus,
important insights can be obtained by studying the interactions of urbanization and food
security in different countries. For this reason, this study focuses on Ukraine, which is one of
the largest agricultural countries in Europe. On the one hand, Ukraine belongs to the top world
exporters of cereals and oilseeds. On the other hand, domestic animal husbandry cannot
maintain food security even at the national level (Vasylieva, 2019). Given the ongoing
integration into the global market environment, it is necessary to study the influence of
urbanization on sustainable agricultural development and food security in Ukraine.
1. Literature review
Numerous studies demonstrate the importance of providing food security. Solving this
problem is both urgent and complicated. It is urgent because of the need for agriculture to feed
over 9 billion people by 2050 (Grafton et al., 2015). It is complicated because food security is
affected by a confluence of economic, political, social, and other factors. For instance, Van
Bavel (2013) showed that ignoring optimization of farm inputs and forgoing investments in
relevant scientific investigations triggers growth in poverty and famine, increases in pollution
and the exhaustion of natural resources, and accelerates a sharp rise in migration pressure.
Similarly, Gardner (2013) and Meyers and Kalaitzandonakes (2015) explored the ways to
produce at least 50% more food by 2050 despite an unfavorable climate change, increase in
energy costs, and continuing turbulence in international agricultural trade policy. Alfieri (2016)
offered actions that could maintain sustainability and ensure global food security by both
availability and affordability components. It involved strategic goals to limit agricultural
expansion, promote genetic diversity of crops, foster different forms and capacities of farming,
balance consumption, food waste and post-harvest losses, arrange elastic and fair trade regimes,
and control the rate of urbanization.
Important here is the idea that “no nation has prospered without urbanization and there
is no prosperous nation that is not predominantly urban” (Satterthwaite et al., 2010, p. 2810). It
is expected that 66% of the world population would live in cities by 2050 and that the shares of
the rural dwellers in Europe, North and Latin America would drop below 20%. Asia and Africa
are expected to be at least 50% and 20% of the world concentration in urban areas in coming
years. When urbanization advances, different countries raise different concerns about
coordinating the goals of food security and sustainable agricultural development with the
Economics & Sociology, Vol. 14, No.1, 202178
Natalia Vasylieva, ISSN 2071-789X
Harvey James, Jr.
INTERDISCIPLINARY APPROACH TO ECONOMICS AND SOCIOLOGY
realities of population dynamics and urbanization. For example, Africa demonstrates the
highest velocity of urbanization. However, it often takes a form that disrupts benefits of urban
economic growth, contributing to social inequality and chronic malnutrition of local people
(Arouri et al., 2014). Meanwhile, Chen et al. (2018) and Kundu (2011) undertook
comprehensive studies aimed at planning harmonized urban transformations and providing
food security with regard to the most populated countries – China and India. It is a tangible
challenge, since these states would accumulate about 18% and 12% of the world city residents
by 2025.
In order to elaborate the depicted issues with regard to Ukraine, the objective of this
study is to examine impacts of urbanization on indicators of sustainable agricultural
development and to reveal its prospects based on the important international patterns. To this
end, the presented research accomplishes the following three tasks:
Task 1: examining the domestic influence of urbanization on basic indicators of
sustainable agricultural development in Ukraine;
Task 2: specifying the standing of Ukraine among other countries with regard to food
security and unfolding world urbanization;
Task 3: determining comparative profiles of developing effective agricultural
sustainability and food security within and beyond the EU top countries to facilitate
Ukrainian adjustments to the realities of the urban world.
2. Methodological approach
The methodological approach to complete task 1 was econometrics (Greene, 2007;
Studenmund, 2016). Specifically, the study utilized the following N-degree polynomial
regressions
N
Y A0 Ai Xi , (1)
i1
where an explainable variable X denotes the share of urban population, in %; numerical
regression coefficients A i , i 0,..., N are calculated by means of the least squares method; the
explained variable Y refers to the indicators of sustainable agricultural development accessible
from State Statistics Service of Ukraine, including
share of agriculture in Gross Domestic Product (GDP), in %;
crop production per capita, in the national currency UAH;
animal production per capita, in the national currency UAH;
employment in agriculture, in %.
To fulfill task 2, the study compares advancements of urbanization worldwide and in
Ukraine, utilizing simple linear regressions such as
ZW ( t ) B0W B1W t , (2)
Z U ( t ) B0U B1U t , (3)
W W U U
where t denotes a variable of time; B , B , B , B are numerical regression coefficients
0 1 0 1
calculated by means of the least squares method; Z W and Z U designate shares of global and
Ukrainian urban population, in %.
Official statistics confirm higher velocity of the world urbanization than that in Ukraine.
Therefore, equations (2) and (3) are used to determine the year of T when Z W (T) Z U (T) , or
when global and Ukraine urbanization are equal, which is
T (B0W B0U ) /( B1U B1W ) . (4)
Economics & Sociology, Vol. 14, No.1, 202179
Natalia Vasylieva, ISSN 2071-789X
Harvey James, Jr.
INTERDISCIPLINARY APPROACH TO ECONOMICS AND SOCIOLOGY
Furthermore, in order to identify the comparative standing of Ukraine among other
countries (Babenko et al., 2017; Kolesnyk et al., 2018), each country was evaluated by
indicators of the urbanization level and securing food availability and affordability, namely:
C1 described its share of urban population, in %;
C 2 characterized its average value of food production per capita, in Int$;
C3 presented its Gross Domestic Product per capita, in Int$.
The methodological foundation for comparing Ukraine with other countries was the
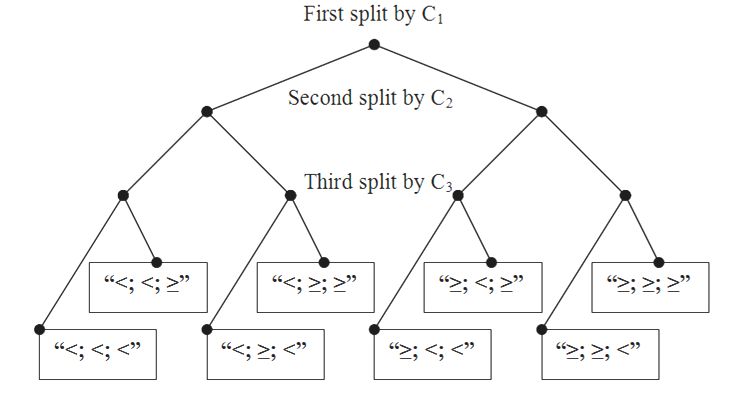
divisive hierarchical clustering (Kaufman and Rousseeuw, 2005). This procedure generates a
structure of a binary tree unfolded by three conditional splits relative to the corresponding
Ukrainian indicators C1U , C 2U , and C3U . In particular,
first split was subject to C1 C1U versus C1 C1U ;
second split was on condition of C 2 C 2U versus C 2 C 2U ;
third split was subject to C3 C3U versus C3 C3U .
This procedure makes it possible to distribute comparable countries into 23 8 clusters
marked by signs of their relevant conditions from the first (top) to the third (bottom) split (as
shown in Graph 1). In order to capture the world pattern of major connections between
urbanization and food security in the allocated countries, the empty clusters or those with minor
loading below 1% were removed or “pruned” in terms of the divisive hierarchical clustering.
The remaining clusters were distinguished via their average indicators. In total, this procedure
delivered an informative picture of Ukrainian standing among agricultural competitors and
consumers in the urbanizing world.
Graph 1. Initial tree of divisive hierarchical clustering
Source: own composition
The methodological approach to address task 3 involved a comparative statistical
analysis (Keyfitz and Caswell, 2010; Mitchell, 2011) suitable for assessing deviations of
Ukrainian agriculture from the best practices within and beyond the EU. For these purposes we
selected 7 appropriate indicators that relate to food security (Headey and Ecker, 2013) and were
accessible from statistics of the Food and Agriculture Organization of the United Nations and
the World Bank Data. These include:
share of urban population, in %;
share of agriculture in GDP, in %;
average food production per capita, in Int$;
Economics & Sociology, Vol. 14, No.1, 202180
Natalia Vasylieva, ISSN 2071-789X
Harvey James, Jr.
INTERDISCIPLINARY APPROACH TO ECONOMICS AND SOCIOLOGY
arable land per capita, in ha;
daily animal protein supply per capita, in g;
share of male employment in agriculture, in %;
share of female employment in agriculture, in %.
The listed composition has the following interpretation. Firstly, the share of agriculture
in GDP and average food production per capita display an economic component of
sustainability. Secondly, arable land per capita and daily animal protein supply per capita
describe an environmental component of sustainability relevant to global ecological challenges
caused by agriculture. Finally, shares of male and female employment in agriculture link to its
social part.
Ukrainian prospects of sustainable agricultural development were completed as follows.
Let Fi , i 1,...,7 , be Ukrainian values of the listed indicators. Their deviations Di , i 1,...,7 ,
U
from the corresponding average top world indicators FiW , i 1,...,7 , were calculated by means
of the equations:
Di FiW FiU , i 1, 2, 6, 7 , (5)
Di (Fi Fi ) / Fi 100 , i 3, 4, 5 .
W U U
(6)
Importantly, equation (5), applies to the shares of urban population, agriculture in GDP
as well as male and female employments in agriculture, evaluated the considered deviations in
percentage point. In contrast, equation (6), utilized for the indicators of an average food
production per capita, arable land, and daily animal protein supply, assessed the examined
deviations in percent.
3. Conducting research and results
The described research methodology entailed the relevant empirical outcomes presented
in this section.
3.1. Agricultural sustainability influenced by urbanization in Ukraine
To synchronize calculations with launching the national Ukrainian currency (UAH) in
1996, the research time frame covered the period 1996 to 2018. The analysis relevant to task 1
relied on time-series samples derived from State Statistics Service of Ukraine (2020) in
compatible prices in UAH for 1996 to 2018. Balancing between the sample size and demand
for regression goodness-of-fit, this research considered only first- and second-degree
polynomials (1). The computed regressions are exhibited in the Graph 2. The calculated R-
squared coefficients verified their sufficient goodness-of-fit, whereas urbanization dynamics
explained, respectively, 70%, 90%, 90%, and 70% of changes in the analyzed Ukrainian
indicators.
Firstly, the calculations identified the ongoing upward trend concerning the share of
agriculture in Ukrainian GDP after some decline around the level of 68.5% of urban population
(see the Graph 2, a). This promising signal means that national agriculture captures advantages
of urbanization and is a stable sector of the Ukrainian economy in difficult times (Khalatur et
al., 2018).
Secondly, the regression of crop production showed that an increase of urban population
in Ukraine by 1 percentage point resulted in an average increase in crop production by 2073.5
UAH or $76.2 per capita (see the Graph 2, b). This confirms a sustained Ukrainian commitment
to food security in cereals and oilseeds segments of the agrifood sector (Vasylieva, 2019).
Economics & Sociology, Vol. 14, No.1, 202181
Natalia Vasylieva, ISSN 2071-789X
Harvey James, Jr.
INTERDISCIPLINARY APPROACH TO ECONOMICS AND SOCIOLOGY
18 5000
Crop production per capita, UAH
y = 2073.5x - 139513.6
Share of agriculture in GDP, %
16 2 4000 2
y = 5.6x - 762.4x + 26072.8 R = 0,9
2
14 R = 0.7
3000
12
2000
10
1000
8
0
6 67 68 69 70
67 68 69 70 -1000
Share of urban population, % Share of urban population, %
a b
1800 Employment in agriculture, % 25
y = 751.6x - 50335.0
1600
R2 = 0.9 20
Animal production per capita, UAH
1400
1200 15
1000 y = 2.7x2 - 367.8x + 12652.1
10
800 R2 = 0.7
600 5
400
0
200 67 68 69 70
0 Share of urban population, %
67 68 69 70
Share of urban population, %
c d
Graph 2. Econometric relation between urbanization in Ukraine and indicators of agricultural
sustainability
Source: own calculation
Thirdly, the regression of animal production showed that an increase of urban
population in Ukraine by 1 percentage point resulted in an average growth in animal production
by 751.6 UAH or $27.6 per capita (see the Graph 2, c). This lags behind the previous indicator
of crop husbandry and suggestsan unfulfilled social obligation of Ukrainian agriculture to the
domestic consumers with the unsaturated demands for meat and milk (Vasylieva, 2019). It also
emphasizes that in light of sustainable agricultural development, crop and animal husbandry
could be better balanced in terms of specialization and diversification (Czyzewski & Smedzik-
Ambrozy, 2015).
Finally, calculations showed stable employment of 18% in Ukrainian agriculture during
the last 5 years (see the Graph 2, d). In positive terms, it demonstrates that the national
agricultural sector remains an important social niche for Ukrainian labor force. In negative
terms, it is consistent with the assumptions of Karamushka et al. (2018) that many Ukrainian
farmers use outdated technologies since the progressive urbanization directs agriculture
Economics & Sociology, Vol. 14, No.1, 202182
Natalia Vasylieva, ISSN 2071-789X
Harvey James, Jr.
INTERDISCIPLINARY APPROACH TO ECONOMICS AND SOCIOLOGY
“towards more capital- and energy-intensive and less labor-intensive farming” (Satterthwaite
et al., 2010, p. 2815).
3.2. World pattern of urbanization and food security
The initial calculations relating to task 2 were originated from time-series data on
urbanization observed worldwide and in Ukraine for 1996 to 2018 (The World Bank Data,
2020). The resulting regressions are presented in the Graph 3. They show an average annual
rise in urban population by 0.47 percentage point across the globe and by 0.1 percentage point
in Ukraine. Based on equation (4), Ukrainian and the world indicators would reach the equal
levels of 73% by 2056.
72
67
y = 0.096 t - 125.431
62
R2 = 0.854
57
52
y = 0.471 t - 895.791
47
R2 = 0.999
42
1995 2000 2005 2010 2015 2020
Share of the world urban population, %
Share of urban population in Ukraine, %
Линейный (Share of the world urban
population, %)
Graph 3. Regressions of urbanization dynamics
Линейный worldwide
(Share of and in
urban population in Ukraine
Source: own calculation Ukraine, %)
The divisive hierarchical clustering relating to task 2 relied on a cross-sectional sample
of 186 countries with the accessible indicators for 2018 from FAO (2020). The analyzed
countries encompassed 99.1% of the world population, excluding populous states of Syria,
Somalia, and Venezuela. Given the Ukrainian indicators of C1U , C 2U , and C3U , the countries a
distributed into four major clusters as marked in the Graph 1.
In particular, the cluster “83
Natalia Vasylieva, ISSN 2071-789X
Harvey James, Jr.
INTERDISCIPLINARY APPROACH TO ECONOMICS AND SOCIOLOGY
population of 29.3% included Albania, Antigua and Barbuda, Armenia, Austria, Azerbaijan,
Barbados, Bhutan, Bosnia and Herzegovina, Botswana, China (mainland), Croatia, Cyprus,
Ecuador, Egypt, Estonia, Eswatini, Fiji, Georgia, Grenada, Indonesia, Jamaica, Kazakhstan,
Latvia, the Maldives, Mauritius, Mongolia, Montenegro, Namibia, North Macedonia, Panama,
the Philippines, Poland, Portugal, Romania, Saint Kitts and Nevis, Saint Lucia, Saint Vincent
and the Grenadines, Serbia, the Seychelles, Slovakia, Slovenia, South Africa, Sri Lanka,
Suriname, Thailand, Trinidad and Tobago, Tunisia and Turkmenistan.
The cluster “;84
Natalia Vasylieva, ISSN 2071-789X
Harvey James, Jr.
INTERDISCIPLINARY APPROACH TO ECONOMICS AND SOCIOLOGY
farming has capacities to compete with the countries from the cluster “; ; ”. That is, it should
be ready to address further urban growth and stronger involvement into the global food security
system.
Table 1. Average indicators of the world major clusters and Ukraine
Share of urban population, Food production per
Cluster GDP per capita, Int$
% capita, Int$
“85
Natalia Vasylieva, ISSN 2071-789X
Harvey James, Jr.
INTERDISCIPLINARY APPROACH TO ECONOMICS AND SOCIOLOGY
Thirdly, food production within and beyond the EU exceeds that of Ukraine by 30% and
71%, respectively. Despite difficult times in Ukraine, there are many options for enhancing
agricultural productivity through implementing innovations and effective management
(Karamushka et al., 2018; Velychko and Velychko, 2017). Such approaches are the cornerstone
of agricultural prosperity in the examined top countries (Godfray and Garnett, 2014). Therefore,
their advanced practices are worth a separate exploration, adaptation and implementation in
Ukrainian agriculture.
80
60
40
20
0
Share of Share of Food Arable land Daily animal Share of male Share of
-20 urban agriculture in production per capita protein employment female
population GDP per capita supply per in agriculture employment
capita in agriculture
-40
-60
World Top within the EU World Top beyond the EU
Graph 5. Comparative profiles of agricultural sustainability
Source: own calculation
Fourthly, the indicator of arable land per capita showed equal capacities of crop farming
in Ukraine and the top countries beyond the EU. In comparison with the top EU countries,
Ukraine had an advantage of 60%. Unfortunately, the restricted market turnover eliminates
farmland benefits of the national agriculture (Koroteyev et al., 2017; Skrypnyk et al., 2018).
Fifthly, the indicator of animal protein per capita is very important for providing healthy
nutrition (Khan et al., 2017). Thus, Ukrainian agriculture should focus on amplifying its animal
husbandry by 30 to 61%.
Sixthly, the comparative profiles showed that Ukrainian agriculture involves more men
and women than those ones in the top countries. Larger deviations were found for female
employment by 9 percentage point beyond and 10 percentage point within the EU. Overall,
Ukraine follows the common trend on the dominant male employment in agriculture which
surpasses the female engagement by 4 percentage point (Doss et al., 2018). Meanwhile,
statistics convinces that the further urbanization will agree “with fewer people working in
agriculture and more working in transport, wholesaling, retailing, food processing and vending”
(Satterthwaite et al., 2010, p. 2815).
Conclusion
This study showed that the upward trend in Ukrainian urbanization is consistent with
the ongoing positive changes in sustainable agricultural development. Global urbanization
facilitates positive tendencies in both economic growth and food security. Specifically,
increments by 45 percentage point in the shares of urban population among the formed clusters
Economics & Sociology, Vol. 14, No.1, 202186
Natalia Vasylieva, ISSN 2071-789X
Harvey James, Jr.
INTERDISCIPLINARY APPROACH TO ECONOMICS AND SOCIOLOGY
of 186 countries associated with almost tenfold GDP increase and fivefold rise in food
production.
Agricultural production in Ukraine was ranked 17th in the world. Unfortunately, other
Ukrainian industries do not contribute to the overall economy the same way that agriculture
does, which is why Ukraine is ranked behind 114 countries in terms of GDP. Possible
improvements of such standing were clarified by comparative profiles of the top countries
within and beyond the EU. They illuminated avenues of urbanization, employment in
agriculture and its share in GDP, showed advantages in crop farming, exhibited prospects in
animal husbandry and food security. The plausible patterns on developing agricultural
sustainability and fortifying food security in Ukraine could be delivered from competitive
Lithuania and prosperous Canada within and beyond the EU. They encourage rising Ukrainian
food production by 17.1% and 25.4%. Such progress is an imperative to meet challenges of
providing the secure and sustainable feeding of the urban world now and later on.
References
Alfieri, F. (2016). Politics, economics, and demographics of food sustainability and security.
Reference Module of Elsevier Inc. in Food Science. doi: 10.1016/B978-0-08-100596-
5.03435-1.
Arouri, M., Youssef, A. B., Nguyen-Viet, C., & Soucat, A. (2014). Effects of urbanization on
economic growth and human capital formation in Africa. Program on the global
demography of aging at Harvard University: Working Paper Series, 119, 1-22. Retrieved
March 11, 2020, from https://halshs.archives-ouvertes.fr/halshs-01068271/document
Babenko, V., Pasmor, M., Pankova, J., & Sidorov, M. (2017). The place and perspectives of
Ukraine in international integration space. Problems and Perspectives in Management,
15(1), 80-92. doi: 10.21511/ppm.15(1).2017.08.
Chen, A., Liu, G. G., & Zhang, K. H. (2018). Urbanization and Social Welfare in China.
London: Routledge.
Czyzewski, A., & Smedzik-Ambrozy, K. (2015). Specialization and diversification of
agricultural production in the light of sustainable development. Journal of International
Studies, 8(2), 63-73. doi: 10.14254/2071-8330.2015/8-2/6.
Doss, C., Meinzen-Dick, R., Quisumbing, A., & Theis, S. (2018). Women in agriculture: Four
myths. Global Food Security, 16, 69-74. doi: 10.1016/ j.gfs.2017.10.001.
FAO (2020). Sustainable development goals. Food and agriculture data. Economic and social
development department, UN Statistics. Retrieved March 15, 2020,
from http://www.fao.org/home/en/
Gardner, B. (2013). Global food futures: Feeding the world in 2050. London: Bloomsbury
Academic.
Godfray, H. C. J., & Garnett, T. (2014). Food security and sustainable intensification.
Philosophical Transactions of the Royal Society: Biological Sciences, 369(20120273).
doi: 10.1098/rstb.2012.0273.
Grafton, R. Q., Daugbjerg, C., & Qureshi, M. E. (2015). Towards food security by 2050. Food
Security, 7(2), 179-183. doi: 10.1007/s12571-015-0445-x.
Greene, W. H. (2007). Econometric Analysis. Upper Saddle River, New Jersey: Pearson
Prentice Hall.
Headey, D., & Ecker, O. (2013). Rethinking the measurement of food security: from first
principles to best practice. Food Security, 5(3), 327-343. doi: 10.1007/s12571-013-0253-
0.
Economics & Sociology, Vol. 14, No.1, 202187
Natalia Vasylieva, ISSN 2071-789X
Harvey James, Jr.
INTERDISCIPLINARY APPROACH TO ECONOMICS AND SOCIOLOGY
Karamushka, O., Moroz, S., & Vasylieva, N. (2018). Information component of innovative
support for agricultural enterprises capital. Baltic Journal of Economic Studies, 4(4), 145-
150. doi: 10.30525/2256-0742/2018-4-4-145-150.
Katan, L., Dobrovolska, O., & Espejo, J. M. R. (2018). Economic growth and environmental
health: a dual interaction. Problems and Perspectives in Management, 16(3), 219-228.
doi: 10.21511/ppm.16(3).2018.18.
Kaufman, L., & Rousseeuw, P. J. (2005). Finding Groups in Data: An Introduction Cluster
Analysis. Hoboken, New Jersey: Wiley-Interscience.
Keyfitz, N., & Caswell, H. (2010). Applied Mathematical Demography. New York, New York:
Springer.
Khalatur, S., Pavlova, G., & Zhylenko, K. (2018). The role of some indicators of financial
security in Ukraine in the context of transnationalization and national interests.
Investment Management and Financial Innovations, 15(3), 237-248.
doi:10.21511/imfi.15(3).2018.20.
Khan, A., Khan, S., Jan, A. A., & Khan, M. (2017). Health complication caused by protein
deficiency. Journal of Food Science and Nutrition, 1(1), 1-2. Retrieved March 12, 2020,
from http://www.alliedacademies.org/articles/health-complication-caused-by-protein-
deficiency-8550.html
Knorr, D., Kho, C. S. H., & Augustin, M. A. (2018). Food for an urban planet: challenges and
research opportunities. Frontiers in Nutrition, 4(73). doi: 10.3389/fnut.2017. 00073
Kolesnyk, T., Samborska, O., Talavyria, M., & Nikolenko, L. (2018). Ensuring the sustainable
development of the Ukrainian agrarian sector in conditions of globalization. Problems
and Perspectives in Management, 16(3), 245-258. doi:10.21511/ppm.16(3).2018.20.
Koroteyev, M., Korman, I., Manziy, O., Semenda, O., & Semenda, O. (2017). Prospects for the
market turnover of agricultural land in Ukraine. Problems and Perspectives in
Management, 15(2-2), 344-354. doi: 10.21511/ppm.15(2-2).2017.04.
Kundu, A. (2011). Trends and processes of urbanization in India. Urbanization and Emerging
Population Issues – 6, Human Settlements Group, IIED, Population and Development
Branch, UNFPA. Retrieved March 10, 2020, from http://pubs.iied.org/10597IIED.html
McKenzie, F. C., & Williams, J. (2015). Sustainable food production: constraints, challenges
and choices by 2050. Food Security, 7(2), 221-233. doi: 10.1007/s12571-015-0441-1.
Meyers, W. H. and Kalaitzandonakes, N. (2015). World Population, Food Growth, and Food
Security Challenges. Food Security in an Uncertain World: Frontiers of Economics and
Globalization, 15, 161-177.
Mikalauskiene, A., Narutaviciute-Cikanauske, R., Sarkiunaite, I., Streimikiene, D., & Zlateva,
R. (2018). Social aspect of sustainable development: issues of poverty and food shortage.
Montenegrin Journal of Economics, 14(2), 59-78. doi: 10.14254/1800-5845/2018.14-2.4.
Mitchell, N. H. (2011). Mathematical applications in agriculture. Boston, Massachusetts:
Cengage Learning.
Satterthwaite, D., McGranahan, G., & Tacoli, C. (2010). Urbanization and its implications for
food and farming. Philosophical Transactions of the Royal Society: Biological Sciences,
365(1554), 2809-2820. doi: 10.1098/rstb.2010.0136.
Seto, K. C., & Ramankutty, N. (2016). Hidden linkages between urbanization and food systems.
Science, 352(6288), 943-945. doi: 10.1126/science.aaf7439.
Skrypnyk, A., Tkachuk, V., Andruschenko, V., & Bukin, E. (2018). Sustainable development
facets: farmland and market demand estimation. Journal of Security and Sustainability
Issues, 7(3), 513-525. doi: 10.9770/jssi.2018.7.3(11).
Stage, Jes., Stage J., & McGranahan, G. (2009). Is urbanization contributing to higher food
prices? Urbanization and Emerging Population Issues – 1, Human Settlements Group,
Economics & Sociology, Vol. 14, No.1, 202188
Natalia Vasylieva, ISSN 2071-789X
Harvey James, Jr.
INTERDISCIPLINARY APPROACH TO ECONOMICS AND SOCIOLOGY
IIED, Population and Development Branch, UNFPA. Retrieved March 13, 2020,
from http://www.iied.org/pubs/display.php?o=10573IIED
State Statistics Service of Ukraine. (2020). Agriculture in Ukraine. Statistics. Retrieved
February 29, 2020, from http://www.ukrstat.gov.ua
Studenmund, A. H. (2016). Using econometrics: a practical guide. London: Pearson plc.
The World Bank Data. (2020). Agriculture & rural development. Statistic Indicators. Retrieved
March 19, 2020, from https://data.worldbank.org/indicator
Van Bavel, J. (2013). The world population explosion: causes, backgrounds and projections for
the future. Facts, views & vision in ObGyn, 5(4), 281-291.
Vasylieva, N. (2019). Problems and prospects of food security in Ukraine. Bulgarian Journal
of Agricultural Science, 25(4), 668-676.
Velychko, O., & Velychko, L. (2017). Logistical modelling of managerial decisions in social
and marketing business systems. Journal of International Studies, 10(3), 206-219.
doi:10.14254/2071-8330.2017/10-3/15.
Economics & Sociology, Vol. 14, No.1, 2021You can also read


