Valuer-General's 2018 - Property Market Movement Report
←
→
Page content transcription
If your browser does not render page correctly, please read the page content below
State Valuation Service

           Valuer-General’s 2018
Property Market Movement Report
Cover photos

Gold Coast City. (Photo courtesy of Shutterstock)
Point Vernon in Hervey Bay, Fraser Coast Regional Council. (Photo courtesy of Shutterstock)
Emerald in Central Highlands Regional Council. (Photo courtesy of Central Highlands Development Corporation)
Cattle (Photo courtesy of S Barlow)

© State of Queensland, 2018.
The Queensland Government supports and encourages the dissemination and exchange of its information.
The copyright in this publication is licensed under a Creative Commons Attribution 3.0 Australia (CC BY) license.

Under this license you are free, without having to seek our permission, to use this publication in accordance with the
license terms.
You must keep intact the copyright notice and attribute the State of Queensland as the source of the publication.
Note: Some content in this publication may have different license terms as indicated.
For more information on this license, visit http://creativecommons.org/licenses/by/3.0/au/deed.en.

CS7909 03/18

                                                                    Valuer-General’s 2018 Property Market Movement Report   ii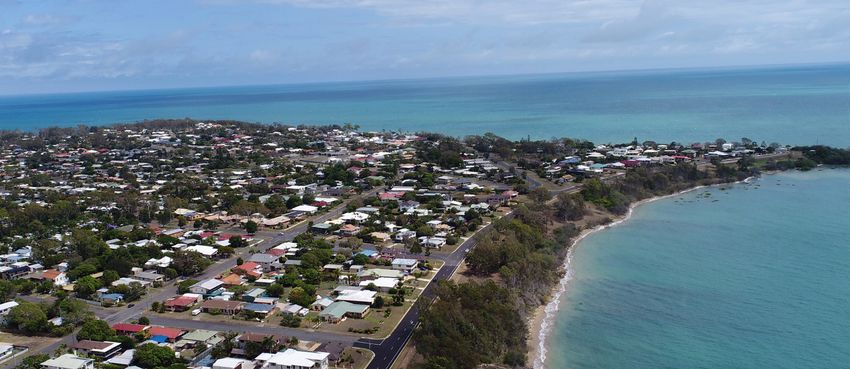
Contents

  Valuer-General’s foreword                                                                            1
  Introduction                                                                                         2
  Property market movement                                                                             2
          Overall market trends                                                                        3
          Gold Coast                                                                                   3
          Greater South East                                                                           4
          Wide Bay–Burnett                                                                             5
          Darling Downs                                                                                5
          Maranoa                                                                                      6
          Central Queensland                                                                           7
          North Queensland                                                                             8
          Western Queensland                                                                           9
          Rural                                                                                       10

Figures
  Figure 1 Local government areas and the 2018 annual valuation program		                             iv
  Figure 2 Property land use by region, 2018			                                                        2
  Figure 3 Overall percentage movement in total value since the previous annual                       11
           valuation for the whole state and all local government areas
  Figure 4 Queensland drought situation as at 27 September 2017 			                                   14
  Figure 5 Queensland drought situation as at 11 January 2018			                                      15
Tables
  Table 1    New median value and percentage movement in median value for                             12
             residential and rural residential land since the previous annual valuation
             in local government areas included in the 2018 annual valuation
  Table 2 New total value and percentage movement in total value for commercial,                      13
          industrial, multi-unit and primary production land since the previous
          annual valuation in local government areas included in the 2018
          annual valuation

                                                            Valuer-General’s 2018 Property Market Movement Report   iii
2018 Annual Valuation Program
Inset
TORRES SHIRE
FRASER COAST
REGIONAL
GYMPIE REGIONAL
WEIPA TOWN
NOOSA
SHIRE
SUNSHINE COAST
REGIONAL
SOMERSET
REGIONAL
MORETON BAY
COOK SHIRE REGIONAL
BRISBANE REDLAND
LOCKYER VALLEY CITY
DOUGLAS SHIRE IPSWICH CITY
REGIONAL
CITY LOGAN
CITY
CARPENTARIA MAREEBA SHIRE
SHIRE CAIRNS REGIONAL GOLD
SCENIC RIM COAST
REGIONAL CITY
CASSOWARY COAST
TABLELANDS
BURKE REGIONAL
CROYDON REGIONAL
SHIRE ETHERIDGE
SHIRE
SHIRE HINCHINBROOK SHIRE Included in Program
TOWNSVILLE CITY Not Valued (40)
BURDEKIN SHIRE
CHARTERS Valued (22)
TOWERS WHITSUNDAY
MOUNT ISA
REGIONAL REGIONAL
CITY MCKINLAY RICHMOND
SHIRE SHIRE
FLINDERS MACKAY REGIONAL
SHIRE
CLONCURRY
SHIRE
ISAAC REGIONAL
WINTON SHIRE
BOULIA SHIRE BARCALDINE LIVINGSTONE SHIRE
REGIONAL
LONGREACH ROCKHAMPTON
REGIONAL REGIONAL GLADSTONE
REGIONAL
CENTRAL HIGHLANDS
REGIONAL
DIAMANTINA SHIRE BLACKALL-TAMBO BANANA
BUNDABERG
REGIONAL SHIRE
BARCOO SHIRE REGIONAL
NORTH
BURNETT
REGIONAL
MURWEH SHIRE SOUTH
QUILPIE SHIRE BURNETT
WESTERN REGIONAL Inset
MARANOA REGIONAL DOWNS
REGIONAL
TOOWOOMBA
REGIONAL
BULLOO SHIRE PAROO SHIRE
GOONDIWINDI
SOUTHERN
BALONNE SHIRE REGIONAL
DOWNS
REGIONAL
Figure 1 Local government areas and the 2018 annual valuation program
CS7798 01/18
Valuer-General’s 2018 Property Market Movement Report iv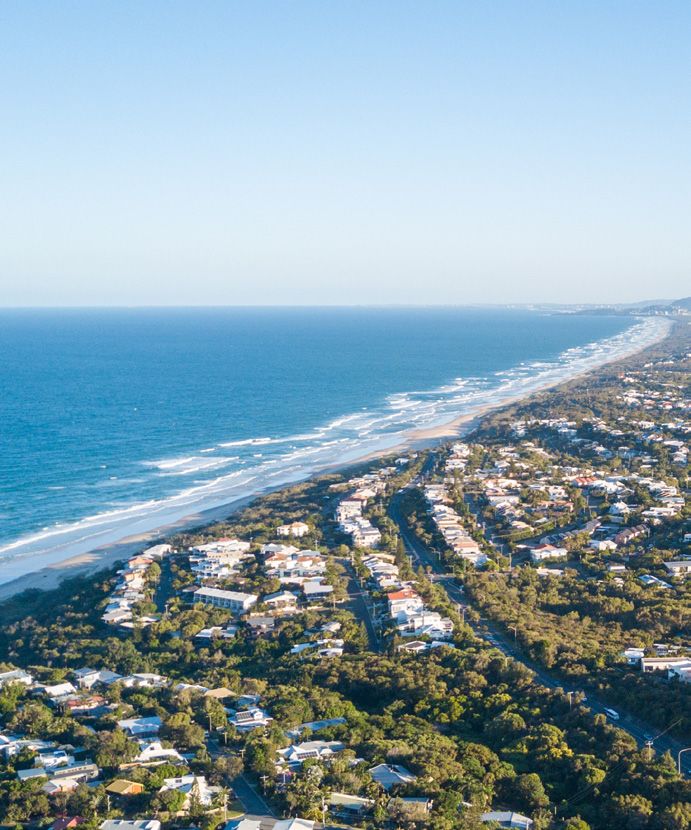
Valuer-General’s foreword
I am pleased to release this year’s property market                            ‘Conditions facing regionally important industries,
movement report, ahead of the issue of the 2018 annual                         including in the resource sector and tourism, have
statutory land valuations on Wednesday, 7 March 2018.                          continued to strengthen. For example, coal prices and
                                                                               associated import demand from China have held up, better
Following a statewide market survey and consultation
                                                                               winter rainfall has eased drought conditions in some areas
with local government and industry groups, 22 local
                                                                               and tourism numbers continue to improve.’2
government areas have been valued in accordance with the
Land Valuation Act 2010.                                                       ‘A global trade recovery, strengthening commodity prices
                                                                               and increased export volumes boosting Queensland
A market survey report prepared for each local government
                                                                               export earnings. The value of Queensland goods exports
area details the sales of land in the area since the last
                                                                               increased $22.3 billion to be $71.4 billion in the year
valuation was made and the probable impact of those
                                                                               to October 2017, while education and tourism exports
sales on the value of land in an area. In addition, valuers
                                                                               continue to grow, driven by demand from Asia.’3
also consider factors that impact on the value of the land
such as the state of the economy, commodity prices and                         Coinciding with the issue of annual valuations on
population trends.                                                             7 March we are introducing a new online search feature
                                                                               for landowners to find their land value information.
The 22 local government areas receiving new valuations
this year are: Banana, Barcoo, Boulia, Bulloo,                                 The online search displays annual valuation information
Central Highlands, Charters Towers, Diamantina,                                from the existing online valuation roll, residential market
Douglas, Fraser Coast, Gladstone, Gold Coast,                                  tables and mapping products into one easy-to-use online
Goondiwindi, Hinchinbrook, Isaac, Maranoa, Murweh,                             search accessible on desktop and mobile devices. The
Noosa, Paroo, Quilpie, Scenic Rim, Sunshine Coast and                          search tool also displays the movement in the residential
Toowoomba.                                                                     median values of major residential localities and local
                                                                               government area as a whole.
The rateable local government areas being valued this year
represent approximately 41 per cent of the total land area                     Queensland Globe continues to provide landowners with
of Queensland or 29 per cent of the properties on the state                    access to more detailed valuation information. Our online
valuation roll.                                                                resources, Queensland Globe and rural sales map can be
                                                                               viewed at www.qld.gov.au/landvaluation and can help you
The new valuations will take effect on 30 June 2018 for local
                                                                               better understand your land valuation and local property
government rating, state land tax and state land rental
                                                                               market.
purposes (where applicable).
                                                                               With many Queensland landowners now electing to receive
This report summarises the comprehensive analysis of
                                                                               their notices electronically, I encourage all landowners
all property markets within the 2018 annual valuation
                                                                               to have their future valuation notices and other valuation
program for Queensland by a team of regionally-based
                                                                               information sent to them by email by visiting
registered valuers in the State Valuation Service of the
                                                                               www.qld.gov.au/landvaluation and changing their contact
Department of Natural Resources, Mines and Energy.
                                                                               details.
There are continued signs of strength in some areas
                                                                               I hope you find this year’s property market movement
of Queensland’s property market. Generally, across
                                                                               report informative.
Queensland there has been increased sales activity in
rural markets. This has resulted in an uplift in land values
within the majority of grazing, horticultural, small crop and
dryland farming industries.
Continued strengthened cattle prices within the beef
industry and continued low interest rates are driving this                     Neil Bray
confidence, even though the majority of the state remains                      Valuer-General
drought declared.                                                              State Valuation Service
Looking at other economic indicators, Queensland Treasury
advise ‘dwelling investment increased by a further 2.4 per
cent in 2016–17. However, dwelling approvals are now well
below their peak in early 2016, driven by significant falls in
approvals for medium-to-high density dwellings.’1

1 Queensland Budget 2017–18: Mid year fiscal and economic review, p8, Queensland Government
2 ibid. p11
3 ibid. p3

                                                                                   Valuer-General’s 2018 Property Market Movement Report     1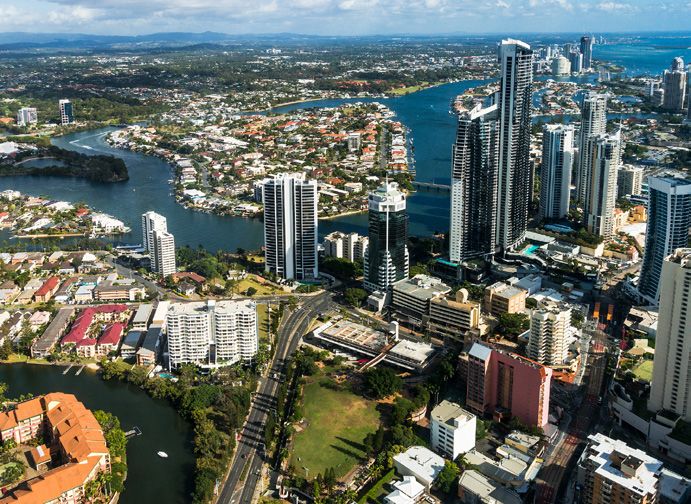
Introduction                                                                                Property market movement
Two methodologies are used to undertake statutory land                                      The volume of property lodgements recorded with the
valuations in Queensland—site value and unimproved                                          Registrar of Titles decreased over the first half of the 2017–18
value.                                                                                      financial year with an average of 2926 daily lodgements,
                                                                                            down 6 per cent from the previous financial year.
Site value is used to value all non-rural land. It is the
amount for which non-rural land could be expected to                                        Proper ty value changes, both up and down, can be
sell for, at the date of valuation, without any structural                                  attributed to a number of factors:
improvements on the land (e.g. houses, buildings or
                                                                                            • supply and demand within the market place
fences). Site value includes site improvements made to the
land such as earthworks (e.g. levelling, filling, or drainage                               • consumer confidence
works). Excavations and drainage associated with a
                                                                                            • availability of finance
building are not included in site value.
                                                                                            • local, national and global economic factors
Unimproved value is used to value rural land. It is the
amount for which rural land could be expected to sell for, at                               • the effects of extreme weather events.
the date of valuation, without physical improvements such
as houses, fences, dams, levelling or earthworks. If your                                   Table 1 (page 12) shows the new median value and
land has been valued on an unimproved basis, it is either                                   percentage movement for residential and rural residential
zoned rural (or equivalent) or designated rural for statutory                               land in the local government area since the previous
valuation purposes.                                                                         valuation. Table 2 (page 13) shows new total value and
                                                                                            percentage movement in total value for each land use
                                                                                            category since the last annual valuation was issued.
   Single unit residential                                                                  Figure 3 (page 11) shows the overall percentage movement
   Rural residential                                                     INSET
   Multi-unit residential                                                                   in total value since the previous valuation for each local
   Commercial                                            NAMBOUR

   Industrial                                                                               government area and the whole state.
   Primary production
   Other
                                                                                            This year’s overall percentage movements in land values
                                                                      BRISBANE              for the 2018 annual valuation are summarised below:
                                                            IPSWICH                         • Nineteen local government areas recorded an overall
                                                                                              increase of between 1.6 per cent (Charters Towers) and
                                                                          GOLD COAST          41.9 per cent (Maranoa).
                             NORTH
                                                                                            • Of the nineteen local government areas that increased,
                                 CAIRNS
                                                                                              three increased by 0–5 per cent, four increased 5–10 per
                                                                                              cent and twelve recorded increases of more than 10 per
                                                                        Local government      cent.
                                                                        areas valued
                                     TOWNSVILLE
                                                                         DNRME offices
                                                                          with SVS staff
                                                                                            • Three local government areas recorded an overall
                                                                                              decrease in value between 5.1 per cent (Paroo) and
                                                          MACKAY
                                                                                              9.2 per cent (Hinchinbrook).

                                                           ROCKHAMPTON

                                 CENTRAL EMERALD
                                                                               BUNDABERG

                                                                   NORTH
                                                                   COAST      MARYBOROUGH

                                                  ROMA

                                                                                 SEE
                                                           TOOWOOMBA
                                                                                 INSET

                                           SOUTH WEST         WARWICK

Figure 2 Property land use by region, 2018

                                                                                               Valuer-General’s 2018 Property Market Movement Report      2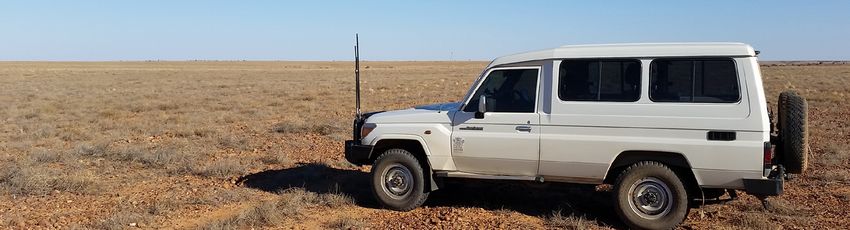
Overall market trends                                                                 Gold Coast
An increase in urban land values has generally occurred in                            Gold Coast City land values have generally increased
the Gold Coast, Scenic Rim, Toowoomba, Sunshine Coast,                                from the 2017 annual valuation. While the key contributor
Noosa and Douglas local government areas. In contrast,                                to the overall increase was in the residential sector,
some regional Queensland local government areas                                       increases have been recorded across most market
experienced generally static to falling property values, in                           sectors. The market movement is consistent with general
particular those communities whose economies are closely                              economic indicators such as improving visitor numbers1,
linked to activity in the resources sector, such as Gladstone                         development and infrastructure spending in the lead up to
and Isaac regional councils.                                                          the 2018 Gold Coast Commonwealth Games2.
The market is still being influenced by:                                              Most residential localities recorded minor increases in
                                                                                      value, the stronger increases being in coastal and near
• prevailing economic uncertainty and weak employment
                                                                                      coastal locations such as Mermaid Beach, Burleigh Waters,
  growth in some regional centres
                                                                                      Burleigh Heads, Elanora, Currumbin Waters and Tugun.
• declining business investment reflecting the state of the                           Residential land values in Coombabah and Runaway Bay
  resources sector                                                                    have recorded only slight increases.
• drought – although better winter rainfall in some areas                             Gold Coast multi-unit development site values increased
  saw a recovery in crop production and herd rebuilding.                              by a minor amount overall depending on location.
                                                                                      The diversity in values is reflective of the demand for
However, these drivers are offset by:
                                                                                      development sites in particular locations and markets.
• strong housing construction and growth in dwelling                                  Southern coastal localities between Mermaid Beach and
  investment                                                                          Coolangatta generally increased by minor to moderate
• continued growth in international tourism and education                             amounts. Land values in central coastal and broadwater
  due to the lower Australian dollar                                                  locations, such as in Southport, Surfers Paradise,
                                                                                      Broadbeach and Labrador, generally increased by only
• low borrowing costs and improving rental yields                                     slight amounts, while values in non-coastal, lower density
• investment opportunities being taken up by interstate                               locations such as in Robina showed slight to minor
  and overseas buyers.                                                                increases.
                                                                                      The market for Gold Coast commercial property has been
The mining and gas industries continue to influence                                   characterised by improving yields and reducing vacancy
the property market as the gas sector moves from an                                   rates. Commercial land value increased by a minor amount
exploration and construction phase towards a production                               overall varying by location. The overall movement was
phase, while the mining industry is impacted by volatile                              influenced by significant increases in southern coastal
resource prices. The fluctuating activity within the sector                           localities such as Palm Beach and Tugun. Land values in
is still impacting on centres including Gladstone, and                                the established commercial locations such as Southport
townships within the Isaac and Banana local government                                and Bundall increased slightly, while emerging locations
areas.                                                                                such as Robina and Varsity Lakes experienced only minor
Increased confidence within rural markets has led to                                  increases.
moderate increases across the state with some minor to
moderate increases in Greater South East Queensland.
Continued high commodity prices within the beef
industry and continued low interest rates are driving this
confidence, even though the majority of the State remains
drought declared.
Despite a drop in the sugar price and an increase in the
Australian dollar the demand for sugar cane land is still
evident, with the market still generally supporting static to
slightly increased land values.

                                                                                      Gold Coast City. (Photo courtesy of Shutterstock)

1 Travel by Australians: Results of the national visitor survey for year ending September 2017
2 Andrew Potts, Gold Coast Bulletin, June 11 2017

                                                                                           Valuer-General’s 2018 Property Market Movement Report   3
Steady demand for industrial sites across the Gold Coast      Residential land values in the towns and villages increased
has resulted in a moderate overall increase in industrial     moderately overall with significant increases in Tamborine
land values. Values in all major industrial locations, such   Mountain and Canungra. The rural homesite market,
as in Yatala, Molendinar and Burleigh Heads, increased        which is the main market driver in the area, also increased
at relatively consistent rates. More significant increases    moderately overall. Diverse movement in this market
occurred in the Coomera Marine precinct. Nerang, Carrara      reflected local sales evidence and demand resulting in a
and Currumbin industrial values increased by only minor       range of increases from relatively minor in Tamborine to
amounts.                                                      significant on Tamborine Mountain. Kooralbyn, Canungra,
                                                              Peak Crossing, Beaudesert and Aratula rural residential
Rural residential home sites recorded a minor increase
                                                              values have increased moderately.
in value overall, with homesite lots closer to denser
residential areas in Helensvale and Nerang reporting          The impact of emerging markets and infrastructure
marginally greater increases.                                 resulted in a range of movements for commercial and
                                                              industrial land in Bromelton and Aratula that resulted
Gold Coast primary production land values, represented
                                                              in a moderate increase for each location. Otherwise the
by the horticulture, cane farming and beef cattle grazing
                                                              majority of commercial and industrial land value was
industries have generally remained unchanged.
                                                              static.

Greater South East                                            Farming and grazing businesses in the area are a
                                                              significant component of the local economy. Farm and
Greater South East Queensland encompasses the valley          grazing land values increased by a minor amount overall,
areas west of Greater Brisbane, coastal areas north to        with more moderate increase recorded in locations such as
Noosa, and areas inland to Gympie Regional Council.           Peak Crossing, Mount Walker and Beechmont.
These local government areas were valued in 2018:             Noosa and Sunshine Coast local government areas were
                                                              last valued in 2016 and generally most market sectors and
• Scenic Rim Regional Council                                 localities have increased in value since that time.
• Noosa Shire Council                                         The Sunshine Coast region has experienced minor to
• Sunshine Coast Regional Council                             moderate growth in residential land values driven by a
                                                              number of factors including the significant infrastructure
Scenic Rim Regional Council area was last valued in 2015.     construction, strong tourism activity and continued
Values in the area have been static until recently when       demand for coastal living. Demand typically centres on
demand spreading from surrounding areas has lifted value.     mid-priced coastal property as well as the smaller towns
Overall the increase in value was minor, however there has    along the North Coast railway line such as Yandina,
been variability with significant increases in some markets   Nambour and Landsborough that provide an affordable
and locations.                                                option for buyers. Prestige property values have also
                                                              improved with minor increases in beachfront lands as
                                                              well as for canal frontage properties in Noosa and
                                                              Pelican Waters.
                                                              Improving multiple unit building activity and demand is
                                                              evident on the Sunshine Coast and has resulted in minor
                                                              growth in mulit-unit land values.
                                                              Commercial land values are generally steady with some
                                                              minor increases across the Sunshine Coast region, however
                                                              there is growth in most industrial values underpinned by
                                                              the strengthening building and development sector.
                                                              Rural residential home site values generally mirrored the
                                                              changes in the urban areas, with minor increases recorded
                                                              in value in Sunshine Coast and Noosa.
                                                              Farming activities such as cattle, small crops and tree
                                                              crops are significant enterprises in South East Queensland.
                                                              Rural land values in Sunshine Coast have had moderate
                                                              increases with market activity reflecting the demand for
                                                              hinterland properties.

Sunshine Beach, Noosa Shire Council. (Photo courtesy of
Shutterstock)

                                                                 Valuer-General’s 2018 Property Market Movement Report     4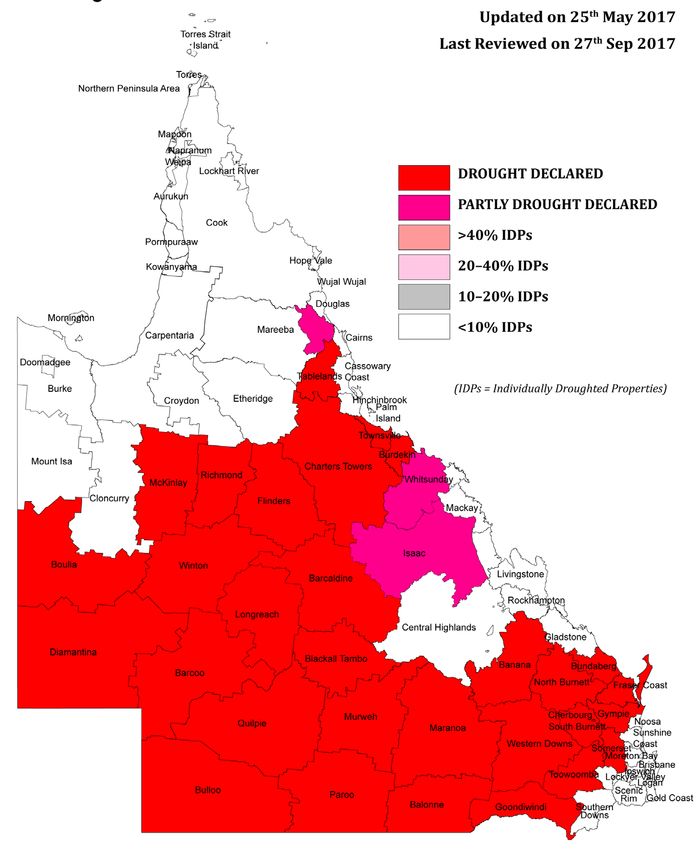
Wide Bay–Burnett                                                   These local government areas in the region were valued
                                                                   in 2018:
Wide Bay–Burnett encompasses the region from
                                                                   • Toowoomba Regional Council
Maryborough north to Bundaberg, and west to Kingaroy
and Monto. Within the region Fraser Coast Regional Council         • Goondiwindi Regional Council
was valued in 2018.
                                                                   The economy of Toowoomba and surrounds continues
Fraser Coast was last valued in 2016 and since that time
                                                                   to be positive due to a number of completed, ongoing
market conditions have improved in some areas with land
                                                                   and proposed infrastructure including the Brisbane
values rising in Hervey Bay and some coastal areas.
                                                                   West Wellcamp Airport, Grand Central shopping centre
Hervey Bay is experiencing some activity in the residential        development, the Second Range Crossing, Charlton
sector, with most areas showing a slight to minor rise in          Industrial Estate development, the proposed Inland
values predominately in the lower to middle price range.           Rail, and the proposed Toowoomba railway precinct and
The older established areas of Maryborough remained                parkland development.
static, while values in the hinterland towns and villages
                                                                   These projects have created confidence within
remained generally unchanged.
                                                                   Toowoomba City. This is further supported by the effects
Multi-unit land values remained static in Maryborough,             of the continued strengthening beef commodity prices,
however values have risen in some areas within Hervey Bay          low interest rates and the general demand for rural land
in line with the rising residential land values.                   across the Darling Downs, resulting in moderate increases
                                                                   in rural land values.
Industrial, retail and other commercial activity has been
largely subdued across the local government area as a              Toowoomba Regional Council was last revalued in 2016.
reflection of local market conditions and as a result, land        Since that time there has been minor to moderate growth
values are mostly unchanged.                                       within the residential and rural residential markets
                                                                   of Toowoomba and surrounding towns. The towns of
Rural residential values remained generally static with
                                                                   Millmerran, Pittsworth, Oakey and Yarraman are the
demand typically focused on smaller sites around the
                                                                   exception where the markets remained static, and minor
major centres.
                                                                   reductions have been made in Clifton, Nobby, Cooyar and
Grazing, cane growing, and small and tree cropping are             Greenmount.
significant land uses in the Fraser Coast area, however land
                                                                   The multi-unit market in Toowoomba has now plateaued,
values were generally static on the back of limited sales
                                                                   following a sustained period of significant development
evidence in the farming sector.
                                                                   prior to the 2016 annual valuation.

Darling Downs                                                      Generally, the industrial market across Toowoomba
                                                                   remained static, except for the Charlton Industrial Estate
The Darling Downs is a farming region on the western               which has experienced significant increases in value,
slopes of the Great Dividing Range in southern                     related to the significant infrastructure projects in the
Queensland. The Downs are to the west of the Greater               region.
South East and is generally applied to an area comprising          There is considerable optimism within the commercial
Southern Downs, Western Downs, Toowoomba and                       market of Toowoomba City. The market for quality
Goondiwindi regional council local government areas.               commercial investment properties has been robust.

Point Vernon in Hervey Bay, Fraser Coast Regional Council. (Photo courtesy of Shutterstock)

                                                                       Valuer-General’s 2018 Property Market Movement Report   5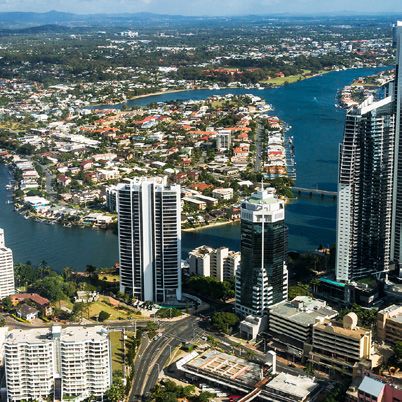
There is demand for smaller commercial premises or sites The continued effects of the strengthened beef
suitable for commercial use on a scale suitable for owner commodity prices and low interest rates has seen the
occupiers. There has been an increase in leasing activity general demand for rural land continue from the 2017
within the CBD and fringe for food and entertainment revaluation across the Goondiwindi Regional Council
venues including cafes, restaurants and bars. The local government area, resulting in continued significant
increased retail floor area brought on line by the Grand increases in value.
Central shopping centre redevelopment appears to have
increased overall vacancy levels within this locality.
Demand for office space within the CBD fringe also Maranoa
continues with the conversion of residential dwellings in The Maranoa region is located in south west Queensland
to professional offices. approximately 480 km west of Brisbane and adjoins the
Redevelopment is occurring within the city fringe Darling Downs.
commercial areas with the recently completed Bunnings The town of Roma, is the dominant urban centre and serves
store on the former foundry site at the corner of Ruthven as the region’s primary hub for commerce, education,
and Bridge streets. Inner city development continued with health, transport, government, retail and financial
a number of new developments and restaurants being services.
constructed, coupled with more apartments.
The urban markets throughout Maranoa Regional Council
Sales within this market support an overall minor have stabilised, since the gas industry has moved from
increase in the level of land value, with varying increases infrastructure development to the production phase.
in the fringe commercial and outlying suburban Within the last revaluation of 2017, all urban land values
commercial areas. were significantly reduced within the town of Roma.
Since the last revaluation of Goondiwindi Regional Rural land values have continued to rise significantly,
Council in 2017, the urban components remained following the increases contained in the last revaluation
generally static overall, except for significant increases in 2017. These increases are a result of the continued
in the industrial market and moderate to significant strengthening of the beef commodity prices and low
increases for rural residential properties in Goondiwindi, interest rates. Better quality and more sought after
including the riverfront properties along the lands have reflected larger increases in property values.
McIntyre River.
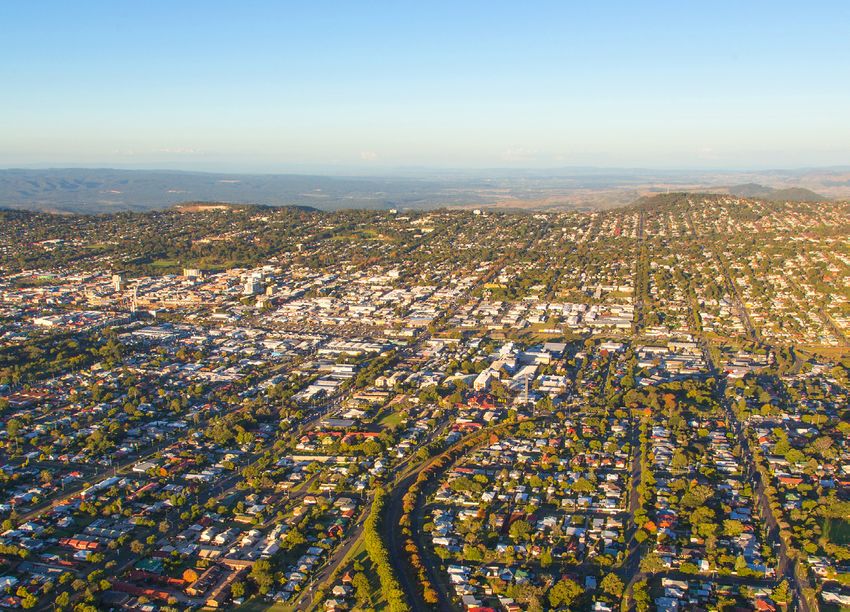
Aerial view of Toowoomba (Photo courtesy of Dan Proud Photography)
Valuer-General’s 2018 Property Market Movement Report 6Central Queensland The worst affected property markets are the lower-valued
properties in improved residential property markets and
Central Queensland encompasses Rockhampton, the residential rental markets. Reliable evidence of a
Gladstone and Mackay and extends south to Miriam Vale, decline in land values has taken time to filter through,
north to Bowen and west to the Queensland–Northern but there is now sufficient market evidence to indicate a
Territory border. downward movement.
These Central Queensland local government areas were The level of reduction varies from town to town, the extent
valued in the 2018 annual valuation: of reductions relates to a combination of the town’s
reliance on the mining industry, and the date at which the
• Banana Shire Council
town’s associated mines rationalised their workforce.
• Central Highlands Regional Council
Although there was considerable variation between mining
• Gladstone Regional Council towns, the trend throughout the local government areas
• Isaac Regional Council of Gladstone, Isaac and Banana was of moderate value
reductions for most urban land types. Urban lands were
Over the last year, Central Queensland experienced a more stable in Central Highlands Regional Council, after
mixed property market movement. Generally, urban some significant reductions in previous valuation periods.
property markets softened or remained static, and rural While property values have reduced in the mining towns
property markets have remained static or increased. such as Dysart, Moranbah, Clermont, Moura and Theodore,
Since the early 2000’s, regional urban markets have been the residential rental market in most towns has started to
influenced by the region’s resources industry. During 2017, firm at lower and more sustainable levels.
the region started to recover from the previous economic Gladstone property values also reduced in 2017 with small
downturn, caused, in part by the reduced viability of the lot residential and multi-unit values reduced in many areas.
Bowen Basin coal industry. This ongoing easing in the residential market demand
Reductions in coal prices since 2013 saw several in 2017 was mainly due to continued uncertainty in the
uneconomic mines closed during 2015–16, remaining LNG sector and excess supply created during the LNG
operational mines rationalised, and infrastructure infrastructure construction phase. There were some flow-
development projects postponed or abandoned. In mid- on reductions in property values in Gladstone’s industrial
to-late 2016 and throughout 2017, an increase in the and commercial sectors, although not all areas were
spot prices for coal saw stabilising in some markets and impacted.
renewed interest in new coal projects. The grazing markets throughout the region, after several
Support industries were also impacted by conditions in years of softening, have generally seen moderate to
the mining sector. The biggest impact occurring in the significant increases with the continued strengthened
mining and resource-based towns which traditionally cattle prices achieved in 2016–2017. Sales across the
accommodated workers in houses rather than in temporary region continued to trend upward. Grazing land values
accommodation. in all Central Queensland local government areas have
seen minor to moderate increases, except for in Gladstone
The effect on the property market was that demand for Regional Council where values remained unchanged.
urban lands remained soft in 2017 in most urban centres.
However, with continued strong coal prices, we are now
seeing stabilisation in these urban markets.
Emerald, Central Highlands Regional Council. (Photo courtesy of Central Highlands Development Corporation)
Valuer-General’s 2018 Property Market Movement Report 7North Queensland Demand for larger rural residential blocks has generally
flattened, however values have increased moderately for
North Queensland encompasses the Burdekin in the blocks located east of the Mingela Range.
south, and extends north to Cape York and west to the
The primary production sector within the local government
Queensland-Northern Territory border.
area, has been very active since the last annual valuation
These local government areas were valued in the 2018 in 2014. The market for grazing lands remains optimistic
annual valuation: but cautious. The property sales indicate some variability
depending on land quality and location. Whilst the broader
• Charters Towers Regional Council
trend is static to increasing, some of the values for the
• Douglas Shire Council poorer quality lands are still below levels set in the last
• Hinchinbrook Shire Council annual valuation.
Based on the available land sales, moderate increases in
Charters Towers Regional Council is centred on the town value have occurred for the better quality pastoral lands,
of Charters Towers, located 135 kilometres southwest of a minor to moderate reduction in the high-cost breeder
the major regional centre of Townsville. Charters Towers is lands, and a general stabilisation of values elsewhere.
largely a service centre for adjoining pastoral and mining
enterprises. Douglas Shire is located in Far North Queensland about 50
kilometres north of Cairns. The main administrative centre
Traditionally, the real estate market in the town of Charters is the town of Mossman, while the main urban centre is
Towers has been closely related to the state of the mining, Port Douglas.
pastoral and education sectors. The pastoral sector
continues to suffer from the prolonged drought, although The economy has advanced through the economic
confidence appears to be returning on the back of record downturn since 2008 with positive evidence in the tourism
high cattle prices and demand exists for quality land. industry. The property construction market has improved
Over recent years, there has been a reduction in mining steadily with development and renovation of resorts, units
opportunities for the town with slowed activity in both and houses evident in recent times. The local tourism
the Central Queensland coal mines and the local gold industry continues to lead the recovery with improvements
operations, impacting local employment. in the market evident from the 2016 period. This has
continued into 2017 with sound levels of holiday occupancy
These economic drivers have caused a slowing in the levels being maintained. The arable and intensive
volume of sales leading to a slight to minor softening of grazing market is resilient on the back of continued high
land values within the Charters Towers residential market, commodity prices for beef and a strong sugar industry.
and a general stabilisation of values within the immediate
rural residential homesite market. A full review was The residential market in Mossman has improved with
undertaken of all commercial and industrial lands within minor increases in values experienced across the board.
the town, resulting in a variation to values in most cases. The commercial and industrial markets have generally
remained the same.
Slight to moderate increases in values were experienced
in the smaller localities and villages within the local On the back of strong tourism, Port Douglas commercial
government area including in Homestead, Pentland and lands have generally experienced minor increases
Mingela. The exception is the town of Greenvale, where a to land values. The industrial locality of Craiglie has
significant decrease in values has occurred due to a lack of also experienced a slight to minor increase in values.
demand. Residential lands in Port Douglas have experienced minor
increases in values.
Variations to values have existed across localities within
the local government area. Minor increases have been
experienced in Wangetti, Newell and Daintree; minor to
moderate increases in values in Cooya Beach and Craiglie;
whilst there has been slight reduction in values at Wonga
Beach.
The rural homesite market generally has experienced a
minor increase in values north to the Daintree River, with a
stabilisation of values north of the river.
The arable and grazing market has generally experienced
minor to moderate increases in value, which also better
aligns to the levels of value in similar quality adjoining
areas in the Far North region.
Hinchinbrook Shire Council is centred on the sugar cane
community of Ingham and associated localities about 110
Port Douglas, Douglas Shire Counicl (Photo courtesy of
kilometres north of Townsville.
Shutterstock)
Valuer-General’s 2018 Property Market Movement Report 8The volume of sales transactions are generally down on Boulia Shire Council is situated about 300 kilometres
historic levels, with the exception of arable lands which south of the city of Mount Isa, adjacent to the Northern
are trending to be within normal parameters. Communities Territory border. The shire has a geographic area of 61 635
such as Forrest Beach are oversupplied with vacant land sq.kilometres with the town of Boulia as its administrative
stock, which has put a downward pressure on land values. centre.
Residential land values within Ingham have generally Landforms within Boulia Shire are diverse as they
experienced a softening of values with minor to moderate encompass parts of the North West Highlands, Mitchell
decreases. This trend is also occurring in the commercial Grass Downs and Channel Country biogeographical
and industrial markets. regions. Located within the semi-arid to arid zone where
rainfall varies considerably, Boulia Shire has been drought
The lack of demand for land in Forrest Beach has resulted
declared over successive years.
in minor to moderate reductions of land value. There is
limited stock available in the communities of Taylors Beach Despite the drought, a number of primary production
and due to this, land values have generally remained the transactions have occurred leading up to the date of
same. valuation demonstrating a moderate uplift in pastoral
values, generally consistent with an upward movement in
Other villages within the local government area including
values experienced in the south and east.
Toobanna, Trebonne, Abergowrie, Halifax and Cordelia
have generally experienced a minor softening in land Residential land values within the town of Boulia have
values. generally remained stable, while there has been significant
reductions to values in the town of Urandangi, albeit from
Similar to residential lands, there has been limited demand
a low base.
for rural residential lands throughout the local government
area. Minor to moderate reductions in value have generally In Barcoo and Diamantina shire council areas, urban land
been experienced across the board, including the Mount values have been maintained at previous levels. Many
Fox locality. of the smaller towns are feeling the impact of prolonged
drought conditions and subsequent population drift away,
Despite a drop in the sugar price and an increase in the
due to limited employment opportunities. While there has
Australian dollar the demand for sugar cane land is still
been a partial break in seasonal conditions, it may take
evident, with the market still generally supporting static
some time for the smaller towns to recover, as demand for
to slightly increased land values.
labour in the rural sector recovers as graziers re-stock. All
urban areas are generally static within the local authorities
Western Queensland of Bulloo and Quilpie, since the last revaluation in 2014.
For the purposes of this report, the Western Queensland In Paroo and Murweh shires last valued in 2015, the
region encompasses the pastoral zone local government towns of Charleville and Cunnamulla recorded significant
areas west to the Northern Territory border and south to reductions in value, while the towns of Morven and
the South Australia and New South Wales borders. Augathella in Murweh Shire recorded significant increases.
These local government areas were valued in the 2018 The increase in values within the rural property market
annual valuation: within the south west are being driven by the continued
strengthened beef commodity prices and low interest
• Barcoo Shire Council rates. Significant increases in value have occurred within
• Boulia Shire Council the mulga lands due to its affordability. The Warrego flood
plain market is generally static. Carbon credit affected
• Bulloo Shire Council
sales have been occurring within the mulga market. Sales
• Diamantina Shire Council between producers are being sold at generally similar
levels within this market. The impact on land values from
• Murweh Shire Council
the construction of wild dog exclusion fencing has yet to
• Paroo Shire Council be determined in the market place, with regard to those
properties that have fencing installed and those that don’t.
• Quilpie Shire Council
(Photo courtesy of S Barlow)
Valuer-General’s 2018 Property Market Movement Report 9Rural The Australian wool market closed in 2017 in record
territory, with the Eastern Market Indicator closing at
Continued optimism generally surrounded rural property 1760c/kg in December 2017.2 In early 2018 it has continued
markets this year, even though the majority of Queensland to rise to 1822c/kg compared to around 400c/kg less in
remained drought declared. This market confidence 2017,3 resulting in higher prices for re-stockers rebuilding
has generally been driven by high commodity prices their flock.
within the beef and sheep industries and continued low
The effect of continued strengthening of beef commodity
interest rates. This optimism in rural markets is also being
prices is particularly evidenced within the better quality
supported by investment in the construction of exclusion
property markets of Central Queensland, Maranoa and
fences to control wild dogs on many rural properties across
the Darling Downs. There has also been significant
Queensland.
interest within the mulga property market in south-west
Rural land values have continued to grow on the back of Queensland due to its affordability.
landowners’ expectations that conditions in agriculture
Generally, the bulk of market purchases are by existing
have improved and continue to do so. Potential
family business acquiring additional property.
purchasers however still remain cautious, until there is
an improvement in weather conditions. Queensland has Increased rural values are generally occurring throughout
not seen a reasonable season for some time, and many the majority of local authorities being revalued across
primary producers are still waiting for rains to start before Queensland, with sales across Maranoa, Goondiwindi,
re-stocking after the prolonged drought conditions. Sunshine Coast regional councils and Murweh and Douglas
shires generally showing significant increases.
Strong cattle market competition exists between re-
stockers, for limited availability. The Eastern Young Cattle Generally, moderate increases have occurred in the rural
Indicator reflects this situation. 1 October 2014: 365 cents/ areas of Boulia, Diamantina, Barcoo, Banana and Quilpie
kg/cwt (carcase weight), 4 October 2016: 719 cents/kg/ shires, and the regional councils of Isaac and Toowoomba.
cwt, 3 October 2017: 547.84 cents/kg/cwt and 30 January
Minor to slight increases generally occurred in Bulloo,
2018: 534.25 cents/kg/cwt. 1 This trend has been impacted
Paroo, Hinchinbrook shires and the regional councils of
by current weather conditions, and has impacted on
Central Highlands, Scenic Rim and Charters Towers, while
rebuilding efforts. Demand for high quality Australian beef
markets in Gladstone and Fraser Coast regional councils
remains strong.
remained static.
Full reviews of rural valuations are currently underway in
many locations across Queensland to improve uniformity
between valuations. The 2018 annual valuation included
a full review of Murweh Shire Council, the Taroom area
of Banana Shire and the eastern areas of Goondiwindi
Regional Council. The south west local government areas
were also analysed as common markets for the respective
country types. These market based reviews have resulted
in varied changes to valuations being issued.
Rural land purchased by resource companies for the
purpose of mining or other extractive industry are not
used to determine statutory land values of rural land. This
market activity has now slowed due to the state of the
resource sector, and respective markets are now being
influenced by rural landowners.
Despite a drop in the sugar price and an increase in the
Australian dollar, the demand for sugar cane land is still
evident with the market still generally supporting static to
slightly increased land values.
Cattle (Photo courtesy of S Barlow)
1 Source: Meat and Livestock Australia
2 Source Landmark Wool Report
3 Queensland Country Life
Valuer-General’s 2018 Property Market Movement Report 10HINCHINBROOK
-9.2
GLADSTONE
-9.0
PAROO
-5.1
CHARTERS TOWERS
1.6
ISAAC
2.8
BULLOO
3.8
FRASER COAST
5.5
Overall percentage change by local government area
CENTRAL HIGHLANDS
6.4
TOOWOOMBA
8.2
GOLD COAST
8.3
Local government area
2018 annual land valuation
STATEWIDE
8.8
10.4
SUNSHINE COAST
10.8
DOUGLAS
11.3
NOOSA
15.2
BANANA
17.3
SCENIC RIM
17.9
DIAMANTINA
18.1
MURWEH
18.5
BOULIA
19.7
BARCOO
21.8
QUILPIE
25.9
GOONDIWINDI
41.9
MARANOA
50
40
30
20
10
0
-10
-20
% change
Figure 3 Overall percentage movement in total value since the previous annual valuation for the whole state and all local
government areas valued in the 2018 annual valuation.
Valuer-General’s 2018 Property Market Movement Report 11Table 1 New median value and percentage movement in median value for residential and rural residential land since the
previous annual valuation in local government areas valued in the 2018 annual valuation.
Residential Rural residential
Local New Median New Median
government median value median value
area value change value change
($) (%) ($) (%)
Banana 65 000 -1.5 73 000 -7.6
Barcoo 10 000 0.0 21 500 0.0
Boulia 9 000 0.0 23 000 0.0
Bulloo 4 000 0.0 6 400 0.0
Central Highlands 58 000 0.0 124 000 0.0
Charters Towers 49 500 -4.8 110 000 0.0
Diamantina 19 000 0.0 50 000 0.0
Douglas 140 000 12.0 152 500 2.4
Fraser Coast 129 000 10.3 117 000 2.6
Gladstone 95 000 -15.9 118 000 -6.4
Gold Coast 345 000 9.5 390 000 5.4
Goondiwindi 75 000 0.0 130 000 12.1
Hinchinbrook 56 000 -22.2 95 000 -12.0
Isaac 37 000 -46.4 74 000 -17.8
Maranoa 58 000 0.0 158 750 5.8
Murweh 12 000 -57.9 28 000 -58.2
Noosa 270 000 13.7 202 500 8.0
Paroo 4 700 -52.5 16 000 -60.0
Quilpie 24 000 0.0 31 000 0.0
Scenic Rim 167 500 14.0 237 500 13.1
Sunshine Coast 247 500 8.8 275 000 10.0
Toowoomba 185 000 7.3 197 500 5.3
Valuer-General’s 2018 Property Market Movement Report 12Multi-unit Commercial Industrial Primary production
New Total New Total New Total New Total
Local government area total value total value total value total value
value change value change value change value change
($) (%) ($) (%) ($) (%) ($) (%)
Banana 3 712 000 -1.0 16 325 400 -11.3 37 749 834 -1.2 1 357 062 890 22.0
Barcoo 106 500 0.0 81 000 0.0 63 281 500 20.2
Boulia 186 610 -5.8 172 280 0.0 69 752 100 19.3
Bulloo 44 600 0.0 215 800 0.0 44 981 500 2.7
Central Highlands 24 651 100 -1.1 77 493 600 0.1 76 805 770 0.0 1 796 759 040 9.5
Charters Towers 2 388 500 -3.7 18 353 700 5.8 15 300 440 4.2 443 541 100 4.7
Diamantina 540 000 0.0 459 850 0.0 43 387 000 19.8
Douglas 272 360 000 8.6 161 691 500 7.2 39 500 200 6.9 101 681 100 47.0
Fraser Coast 276 281 000 5.2 397 063 200 0.5 162 024 800 0.5 230 532 000 0.0
Gladstone 130 164 000 -12.3 206 098 400 -5.8 266 744 050 -9.3 230 757 520 0.0
Gold Coast 17 175 645 400 6.6 4 095 568 700 8.5 3 692 649 500 15.4 125 046 800 0.2
Goondiwindi 6 457 000 19.9 39 822 250 2.9 55 772 500 13.5 778 768 900 38.0
Hinchinbrook 6 602 000 -18.9 39 127 000 -21.4 14 991 000 -10.2 318 293 600 4.8
Isaac 11 406 000 -27.3 25 917 000 -20.8 24 189 400 -23.8 1 814 735 610 18.8
Maranoa 5 765 400 -0.3 70 680 600 0.6 91 992 150 0.1 1 853 246 070 59.6
Murweh 4 635 800 -57.0 1 815 700 -56.7 257 778 290 52.9
Noosa 1 426 416 500 4.5 232 195 000 2.7 139 566 000 9.5 61 565 500 20.1
Paroo 1 085 800 -58.2 410 000 -59.7 93 385 200 3.5
Quilpie 770 450 0.0 1 198 800 0.0 54 704 800 26.3
Scenic Rim 53 894 500 13.0 163 732 500 1.1 80 284 800 4.7 1 121 213 320 11.0
since the previous annual valuation in local government areas valued in the 2018 annual valuation.
Sunshine Coast 3 418 594 200 12.8 1 710 894 400 5.6 759 604 500 7.2 382 303 100 30.4
Toowoomba 528 746 500 0.3 845 398 980 7.5 775 030 132 5.3 2 265 847 230 23.3
Valuer-General’s 2018 Property Market Movement Report
13
Table 2 New total value and percentage movement in total value for commercial, industrial, multi-unit and primary production landQueensland drought situation as at 27 September 2017
Figure 4: Queensland drought situation as at 27 September 2017 Source: www.longpaddock.qld.gov.au
Valuer-General’s 2018 Property Market Movement Report 14Queensland drought situation as at 11 January 2018
Figure 5: Queensland drought situation as at 11 January 2018 Source: www.longpaddock.qld.gov.au
Valuer-General’s 2018 Property Market Movement Report 15You can also read