Shell Cove Boat Harbour - Social Infrastructure Assessment January 2018 - Frasers Property
←
→
Page content transcription
If your browser does not render page correctly, please read the page content below
Shell Cove Boat Harbour

Social Infrastructure Assessment

                  January 2018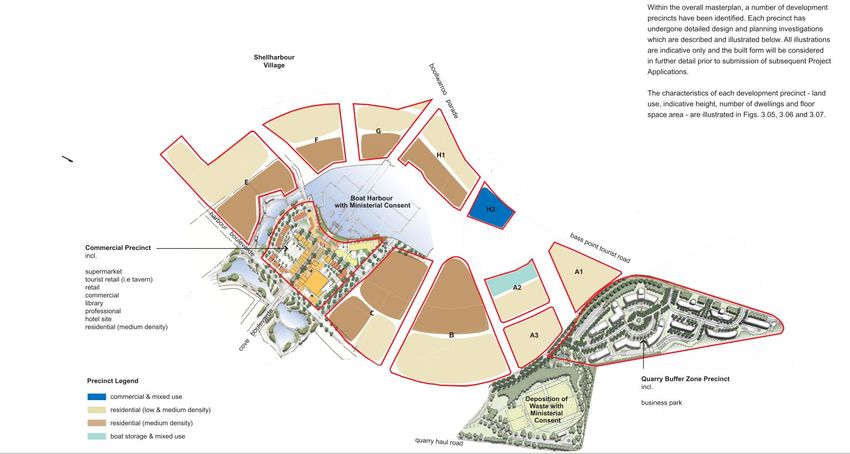
Prepared for:

Frasers Property Group

MacroPlan staff responsible for this report:

Wayne Gersbach – General Manager (NSW)

Gordon Yoon – Senior Economist

                                               2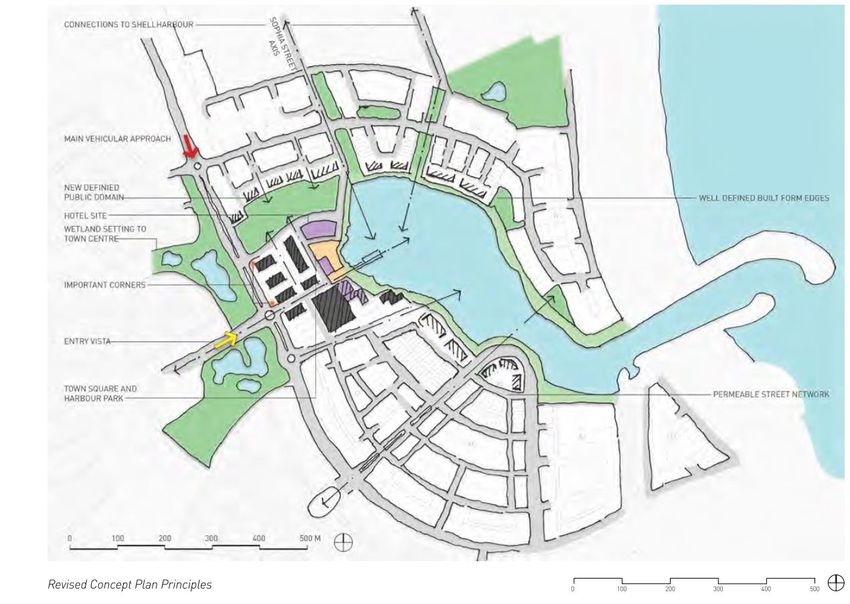
Table of contents

Ex ec ut i ve Su mm a r y .......................................................................... 5

 Overview                                                                                            5
 Project Objectives/ Scope                                                                           5
 Demographic Context and Population Forecast                                                         6
 Community Infrastructure Needs Assessment                                                           9

Se ct io n 1 : I nt ro d u cti o n ................................................................. 15

 1.1     Overview                                                                                  15
 1.2     Project Objectives/ Scope                                                                 15
 1.3     Information Sources                                                                       16
 1.4     Abbreviations                                                                             16
 1.5     Report Limitations                                                                        16

Se ct io n 2 : L oc a t io n an d C a tc hm e nt C on tex t ............................. 17

 2.1     Overview                                                                                  17
 2.3     Locational Setting                                                                        17
 2.4     Development Details                                                                       18
 2.5     Catchment Definition                                                                      21

Se ct io n 3 : P o l ic y C on tex t .............................................................. 23

 3.1     Overview                                                                                  23

Se ct io n 4 : De mo g r a ph i c C on tex t ................................................. 25

 4.1     Overview                                                                                  25
 4.2     Current Demographic Profile and Composition                                               25
 4.3     Population Projections                                                                    27

Se ct io n 5 : Co mm u n ity I nf r a st r uct u r e ........................................ 28

 5.1     Overview                                                                                  28
 5.2     Community Infrastructure Approaches                                                       28
 5.3     Community Infrastructure Principles                                                       28
 5.4     Community Infrastructure Standards                                                        30

Se ct io n 6 : Cu r r en t S u pp l y a n d O p p or tu n ity A s se s s me nt ....... 33

                                                                                                          3
6.1   Overview                                          33
6.2   Methodology                                       33
6.3   Scope of Community/ Supply Facility               34
6.4   Emergency Infrastructure                          34
6.4.1 NSW Fire Stations Current and Future Supply       34
6.4.2 NSW Ambulance Service Current and Future Supply   35
6.5   Primary and Secondary School Infrastructure       36
6.6   Community Health Facility                         39
6.7   Regional Health Facilities                        40
6.8   Residential Aged Care Places                      41
6.9   Youth Centres                                     43
6.10 Community Centre                                   44
6.11 Child Care Facility                                46
6.12 Library                                            49
6.13 Performing Arts/ Cultural Centre                   50
6.14 Tertiary Facilities                                51
6.15 Open Space and Recreation Supply Assessment        51

                                                             4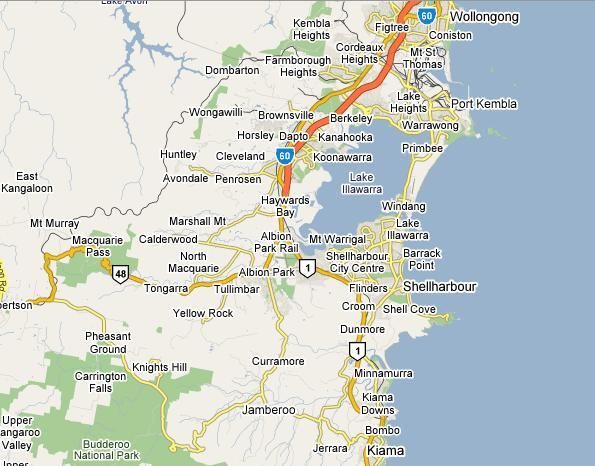
Executive Summary
Overview
JBA is currently engaged by Frasers Property Group and seeks modification to the Shell
Cove Boat Harbour Concept Plan Approval, under 75W of the Environmental Planning
and Assessment ACT 1979, in response to design development, market trends, and to
provide more flexibility in the future.
MacroPlan has been commissioned by Frasers Property Group (Frasers) to assess the
potential social infrastructure impacts of the project revisions and in particular review
any increased need for facilities such as schools, hospitals and community facilities.
This assessment examines the social infrastructure required to service the needs of the
new Shell Cove Boat Harbour precinct. To ensure a detailed understanding of
infrastructure needs is developed, all existing infrastructure within a 5 and 10km radius
is reviewed in addition to the Shell Cove development. Population forecasting within this
radius is used to understand key drivers and opportunities within the Boat Harbour
precinct.
Project Objectives/ Scope
The Shell Cove project is a large scale, master-planned, urban development located on
the New South Wales coast in the Shellharbour City region.
The overall project comprises development of over 3,000 residential dwellings with an
estimated population of 9,000 people, a 300-berth boat harbour, an 18-hole
championship golf course, a district retail centre, community facilities and open space
networks.
The Boat Harbour precinct that is the focus of this assessment consists of:
1,556 residential dwellings within a mix of development density including 3 to 6
storey apartments, medium density dwellings and detached housing.
A hotel building, which spans up to 11 storeys, with flexibility to accommodate
serviced and residential apartments.
District retail centre incorporating a 3,000 sqm supermarket and 6,000-8,000
sqm of specialty shops and commercial space
5 Marina commercial and maintenance facilities
Business Park with up to 30,000 sqm GFA
Foreshore reserves and promenade
2 lane public boat ramp and car and trailer parking (approved under separate
consent); and
Wetland reserves.
The development includes a 4-star hotel with high-quality conference facilities. The hotel
will have the ability to accommodate and service a large number of visitors to the region
for both business and holiday purposes.
Demographic Context and Population Forecast
Population forecasts have been projected for a 10km radius around the site over the
next 25-30 years. The area surrounding the site is a moderate growth area. This is
shown in the table below.
10km radius Population and Dwelling Growth Forecasts – 2016 to 2036
2016 2021 2026 2031 2036
Population 82,872 87,132 91,261 95,097 98,522
Number of Households 32,886 35,120 37,225 39,254 41,129
People Per Household 2.52 2.48 2.45 2.42 2.40
Source: MacroPlan (2017), ABS Census (2016), DP&E Population Projections (2016)
Overall, the catchment and surrounding area was found to be very similar to regional
NSW in most socio-economic and demographic indicators. As of the 2011 Census, the
population of Shell Cove and the greater Shellharbour LGA area was characterised by:
• Household sizes slightly above state averages.
• Household incomes in Shellharbour (LGA) and the 10km catchment are
approximately 10% below the NSW State average.
• While there is some variation across the different geographic areas, generally age
distribution is in line with regional averages with the exception of Shellharbour
LGA’s 5-24 age brackets which is above the NSW State average.
• The proportion of family types was broadly in line with NSW State proportions.
The proportion of one parent families with children was slightly higher in the
10km catchment than the NSW State average (differ from 2011 Census).
• The 10km catchment and Shellharbour (LGA) both have above average
proportions of owner & purchaser households.
6• Shellharbour (LGA) and the 10km catchment have high proportions of low density
dwellings.
• A smaller proportion of people were born overseas for the both the 10km
catchment and Shellharbour (LGA) than the NSW State average.
While there is an element of ageing population within the 10km catchment, with the
proportion of seniors set to double from 9,969 persons in 2016 to 20,675 persons in
2036, there is also considerable growth forecast in the younger age cohorts. The young
persons and families will still make up the greatest proportion of the population.
Projected Population by Age Cohort within a 10km radius, Selected SA2 regions
2016 2021 2026 2031 2036
0-4 5103 5378 5529 5543 5584
5-9 5485 5645 5951 6115 6130
10-14 5327 5543 5685 5988 6133
15-19 5470 5455 5666 5848 6115
20-24 5043 4888 4877 5062 5235
25-29 4450 4329 4222 4199 4348
30-34 4887 5323 5166 5045 5033
35-39 4775 5511 5923 5785 5667
40-44 5452 5261 6009 6430 6285
45-49 5409 5631 5449 6189 6608
50-54 5718 5532 5730 5587 6325
55-59 5701 5773 5598 5799 5640
60-64 5035 5675 5734 5588 5807
65-69 4794 5224 5898 5976 5870
70-74 3708 4424 4867 5494 5594
75-79 2838 3354 4041 4457 5087
80-84 1921 2152 2576 3155 3527
85+ 1755 2034 2338 2838 3535
Total 82,872 87,132 91,261 95,097 98,522
Source: MacroPlan (2017), ABS Census (2016), DP&E Population Projections (2016)
Community Infrastructure Best Practice, Approaches and Standards
There are various approaches to community infrastructure planning and provision.
These include:
7 Hierarchical provision (using a regional, local and state framework) – which allow
provision to key market / community catchments and
Integrated approach which seeks to combine different facilities and which can
leverage the benefits and synergies of different facilities.
In addition, a set of principles have been developed to help guide the development of
community infrastructure. These include:
Hierarchy of facilities / settings
Hubbing / co-location integration
Multiuse
Flexibility (change function over time)
Targeted to local needs / demands
Activity generators (day / night) / active programming
Access (disability access and transport)
Visibility (highly visible location)
Safety / security (passive surveillance)
Avoid duplication
Contribute to health, wellbeing and capacity
Promote social equity
Seek sustainable approaches to management, funding and maintenance (capital
and operating) e.g. whole of life costs and
Create local competitive advantage, uniqueness and identity
In order to assess the demand for community infrastructure arising from the Boat
Harbour precinct, MacroPlan has developed community infrastructure standards that
take into consideration:
Community infrastructure standards from the Development Code produced by the
Growth Centres Commission/GCC (October 2006). The standards relate a range
of community infrastructure facilities to current and emerging populations.
Demand / population projections (also using specific groups where required, for
example 70+ or children aged 0-4) in the precinct.
Estimates of current and future supply of community/social infrastructure within a
5km or 10km catchment.
Previous lessons and experience in community infrastructure.
It is noted that the demand / supply balance uses different catchments (with the supply
catchment covering a larger area). Hence, care must be taken in interpreting the results
as the number of facilities provided by the economic model (the balance between supply
8and demand) must take into account possible usage and travel patterns (which will be
determined in part by distance and the nature of the facility). For example, some
residents may consider facilities 5km too far to access, and may prefer a smaller facility
closer to the local population.
This is most evident in the provision of community infrastructure such as primary schools
or public open space where a small neighbourhood park can meet local needs within a
500m radius, while a regional park will attract users from larger distances.
Community Infrastructure Needs Assessment
Due to the small residential size of the Boat Harbour precinct, there are limited
community infrastructure requirements that can be assigned specifically to the
development site that include:
8.04 ha of open space that includes 1-2 neighbourhood parks
These infrastructure requirements are to be addressed through planned infrastructure in
the Boat Harbour Masterplan and/or surrounding community infrastructure as outlined
below.
The results of the overall community infrastructure assessment for the Shell Cove Boat
harbour precinct are shown in the table overleaf.
9Policy / Strategy Summary (& comparison with previous assessment in 2008)
Community Comment / Recommendation
Infrastructure
Type
From 2008 to now there has been a 67% increase in numbers of NSW Fire Stations, reflecting the increasing
NSW Fire Stations
demand for Fire Services arising from the recent residential development.
In our view, there is adequate supply of fire stations in the catchment radius. However, further consultation
will need to occur with appropriate authorities for provision in the future as growth occurs.
Furthermore, Frasers has indicated that all new apartment and hotel buildings will have sprinkler system
which will contain fires before they burn over large areas (i.e. preventing fire spread and growth).
From 2008 to now there has been a 100% increase in numbers of NSW Ambulance Stations, reflecting the
NSW Ambulance
increasing demand for ambulance services arising from the recent residential development, particularly the
Service Dapto and Calderwood regions.
There is likely to be an adequate supply of ambulance stations in the catchment radius. Further consultation
will need to occur with appropriate authorities for provision in the future as growth occurs.
From 2008 to now there has been a 200% increase in the numbers of NSW Police Stations, reflecting the
NSW Police Service
increasing demand for Police Service arising from the recent residential development.
In our view, there is adequate supply of police stations in the catchment radius. However, further
consultation will need to occur with appropriate authorities for provision in the future as growth occurs.
From 2008 to now there has been a 29% increase in numbers of primary schools, reflecting the increasing
Primary schools
demand for primary schools arising from the recent residential development.
Shellharbour Public School and Stella Maris Catholic Primary School, in the township of the
Shellharbour Village, are in close proximity. The dwellings in the stage 8 and 9 at Shell Cove Boat Harbour
Precinct are primarily within their local school catchment.
According to our assessment, there is an already high level of supply of primary schools in the area. In our
10view, the supply of primary schools for the locality is adequate.
From 2008 to now there has been a 33% increase in numbers of high schools, reflecting increasing demand
Secondary schools
for secondary education arising from recent residential development.
In our view, there is currently adequate supply of high schools in the catchment radius. According to our
assessment, there is an already high level of supply of high schools in the area to 2026.
Our spare capacity assessment for each secondary school across the catchment area, shows that no new
secondary school is needed in the short term since there is enough spare capacity in the catchment.
However, the Boat Harbour development will contribute to catchment demand for an additional
high school. According to our assessment, one high school might be needed in the long term (2036
onwards) but further consultation will need to occur with appropriate authorities for this potential provision
as growth occurs.
Service requirements could be accommodated within existing facilities through additional development. We
also note that there are 4 secondary schools located in the 5km catchment radius, including the
Shellharbour Anglican College which is located across the road from the western entrance of Shell Cove.
According to MacroPlan’s community infrastructure standards, there will not be a need for a community
Community Health
health facility to be incorporated into the development site.
Facility Provision ratios demonstrate a need for community health facilities in the 10km catchment radius, but this
demand should be met either within the Shell Cove region (i.e. Shell Cove Family Health), within other local
areas in the catchment radius by the relevant authorities and through other facilities (e.g. Shellharbour
private and public hospitals etc).
Shell Cove Family Health is the local health practice located closest to the subject site within Shell Cove.
The community health facility offers a range of primary care services including:
o Doctors – General Practice (8 – 10 general practitioners available)
o Primary Health Nursing
o Dietitians
o Exercise Physiology
o Physiotherapy
11o Clinical Psychology
o Podiatry
o Pathology
Furthermore, there is a development recently commenced for a single community health centre at the
former Kiama Hospital site.
From 2008 to now there has been a 64% increase in numbers of hospital beds, reflecting the increasing demand
Regional Health
for regional health facilities arising from the recent residential development.
Facilities In our view, there is already a sufficient supply of current regional health facilities to accommodate
growth demand from the subject site, associated with the proposed higher number of dwellings.
In October 2017, a major upgrade to Shellharbour hospital ($215m) was announced by the State Government.
This investment is extensive; delivering more operating theatres, a new emergency department and greatly
expanded surgical services.
From 2008 to now there has been a 118% increase in numbers of residential aged care places (combined High
Aged Care Centre
and Low care places), reflecting the increasing demand for aged care services and the rapidly ageing population
profile in the region.
In our view, there is already a sufficient level of supply of residential aged care facilities in the catchment with
the potential six (5) new aged care facilities in the pipeline to year 2022.
According to MacroPlan’s community infrastructure standards, there will not be a need for additional residential
aged care facilities to be incorporated into the development site. In our view, there is already a good level of
supply of aged care residential places.
We also note that the Commonwealth Government is shifting its funding focus from RACF to home care
packages. This shift in policy will be an increasingly important feature of service deliver over time.
Moreover, home care packages can be delivered more efficiently when retirees are collocated. This outcome is
more likely at the subject site, due to the predominance of apartments.
From 2008 to now there has been a 200% increase in numbers of youth centres, reflecting the increasing
Youth facility
demand for such facilities and services arising from the recent residential development.
12 According to MacroPlan’s community infrastructure standards, there will not be a need for additional youth
centre(s) to be incorporated into the development site. In our view, there is already a good level of supply of
current regional health facilities.
From 2008 to now there has been a 100% increase in numbers of community service centres, reflecting the
Community Service
increasing demand for community service arising from recent population growth.
Centre In our view, there is an adequate supply of community service centres within the catchment area.
From 2008 to now there has been a 130% increase in numbers of local community centre, reflecting the
Local & District
increasing demand for local community centres arising. There has been no change in numbers of district
Community Centre community centre since 2008.
However, there is still inadequate supply of local community centres within the catchment area. According to
provision ratios there will be urgent needs for local community centres within the development site.
There is the opportunity for Shell Cove to become a district community centre to cater to
undersupply within the catchment area. Frasers has indicated that the additional provision is already
incorporated with the current development plan.
According to our assessment, more community facilities might be needed in the long term (2036 onwards) but
further consultation will need to occur with appropriate authorities for provision in the future as growth occurs.
From 2008 to now there has been a 78% increase in numbers of child care places, reflecting the increasing
Child care
demand due to more young families living in the region.
In our view, there is adequate supply of child care services within the catchment area. According to
MacroPlan’s community infrastructure standards, there will not be a need for additional childcare facility to
be incorporated into the development site.
From 2008 to now there has been a 128% increase in numbers of after-school care places, reflecting the
After school
increasing demand due to more young families living in the region.
Although there is identified need for after school facilities to be constructed in the short term within the
10km catchment radius, our view is that there is adequate supply of community service centres within the
catchment area.
13o The existing arrangement at Shell Cove Primary School for after school care will meet this identified need
within the development site.
o The new Shell Cove public school can provide additional capacity for out of hours care.
From 2008 to now there has been a 25% increase in numbers of library, reflecting the increasing demand due to
Library
more population living in the region.
There are adequate levels of library services within the catchment area.
From 2008 to now there has been a 200% increase in numbers of such facilities, reflecting the increasing
Performing arts /
demand due to more population living in the region.
cultural centre There is adequate supply of performing arts / cultural facilities in the catchment area.
8.04 ha of useable open space will need to be set aside in the development site. This should include at least one
Open Space
and potentially two local parks that incorporate playground and passive play areas. The remainder can be made
up of foreshore, bushwalking or bike riding areas.
Shell Cove Boat Harbour Precinct’s current and future open space provision will exceed this provision.
14Section 1: Introduction
1.1 Overview
MacroPlan Australia has been commissioned by Frasers Property Group (Frasers) to
assess the potential social infrastructure impacts of the Shell Cove development and, in
particular, review any increased need for facilities such as schools, hospitals and
community facilities arising from project changes.
JBA is currently engaged by Frasers and seeks for modification to the Shell Cove Boat
Harbour Concept Plan Approval, under 75W of the Environmental Planning and
Assessment ACT 1979, in response to design development, market trends, and to
provide more flexibility in the future.
This assessment looks at the social infrastructure required to services the needs of the
new Shell Cove Boat Harbour precinct. To ensure a detailed understanding of
infrastructure needs is developed, all existing infrastructure within a 5 and 10km radius
will be reviewed in addition to the Shell Cove development. Population forecasting
within this radius is used to understand key drivers and opportunities within the Boat
Harbour precinct.
1.2 Project Objectives/ Scope
The Shell Cove project is a large scale, master-planned, urban development located on
the New South Wales Coast in the Shellharbour City region, being jointly developed by
Frasers and Shellharbour City Council.
The overall project comprises development of over 3,000 residential dwellings with an
estimated population of 9,000 people, a 300 berth Boat Harbour, 18 hole championship
golf course, district retail centre, community facilities and open space networks.
The Boat Harbour precinct that is the focus of this assessment consists of:
1,556 residential dwellings within a mix of development density including 3 to 6
storey apartments, medium density dwellings and detached housing;
A hotel, which spans up to 11 storeys, with flexibility to accommodate serviced
and residential apartments;
15 District retail centre incorporating a 3,000sqm supermarket and 6 - 8,000 sqm of
specialty shops and commercial space;
Marina commercial and maintenance facilities;
Business Park with up to 30,000sqm GFA;
Foreshore reserves and promenade;
2 lane public boat ramp and car and trailer parking (approved under separate
consent); and
Wetland reserves.
1.3 Information Sources
This report draws on a wide range of information sources, including:
• Population Projections, NSW Department of Planning and Environment (2016).
• Census of Population and Housing, Australian Bureau of Statistics (2006& 2011).
• Australian Bureau of Statistics.
• Relevant experience throughout Victoria and Australia, with particular reference
to socio-economic profiles, area trends, and recent market performance.
1.4 Abbreviations
The following abbreviations are used in this report
• ABS Australian Bureau of Statistics
• LGA Local Government Area
• SLA Statistical Local Area
1.5 Report Limitations
This report is prepared on the instructions of the party to whom it is addressed and is
thus not suitable for the use other than by that party. As the report involves future
forecasts, it can be affected by a number of unforeseen variables. It represents for the
party to whom or which it is addressed the best estimates of MacroPlan, but no
assurance can be given by MacroPlan that the forecasts will be achieved.
16Section 2: Location and Catchment Context
2.1 Overview
This section discusses location and catchment context.
2.2 Shellharbour City Council
Shellharbour is one of the state's youngest cities, having been gazetted in January 1996,
but today ranks as one of the most progressive non-metropolitan communities in New
South Wales.
The LGA serves a community of approximately 71,200 residents across an area of 154
square kilometres with anticipated community growth of 19,250 persons by 2036.
2.3 Locational Setting
The site sits within the Shellharbour SA2 area, (as defined by the ABS), and is located
17km south of Wollongong.
As illustrated in the map below, the site is located adjacent to the Pacific Ocean with
frontage to Shellharbour beach. The site is accessed via Shellharbour Road, which
intersects with the Princess Highway at Dunmore.
Regional Location Map
Shell Cove Boat Harbour
Precinct
Source: MacroPlan (2017)
172.4 Development Details
The overall project comprises development of a community with over 3,000 residential
dwellings, a 300 berth Boat Harbour, 18-hole championship golf course, district retail
centres, community facilities and open space networks.
Approved Concept Plan
Source: LFA (2010)
The terms of the current Shell Cove Boat Harbour Concept Plan Approval are as follows:
Up to 1,238 dwellings with a total gross floor area of approximately 150,000m 2
comprising single dwellings, medium density and apartments.
A business park with a maximum gross floor area of 30,000m 2.
Retail/commercial/hotel/community development with a maximum gross floor
area of 22,000m2.
Public open space and wetlands.
Associated drainage, stormwater infrastructure and roads.
18The details of the proposed modifications to the aforementioned approval are as follows:
Up to 1,556 dwellings comprising single dwellings, medium density and
apartments.
Increase the maximum height of the residential flat buildings from 4 storeys to 6
storeys in parts of the Shell Cove Town Centre and on key foreshore locations.
Relocate the proposed Shell Cove Town Centre hotel and increase its maximum
height from 9 storeys to 11 storeys.
Allow the additional permit for both serviced and residential apartments
development in the hotel building(s) .
Retail and commercial development combined with a maximum gross floor area
of 22,000m2.
Revised Concept Plan Principles
Source: COX Richardson (2017)
19The current masterplan for development of the Shell Cove project includes the following
elements:
BOATHARBOUR PRECINCT
Boat Harbour
300 Floating berths
Boat Maintenance
Travel lift
Hardstand for 12 to 14 boats
Small commercial building of approximately 400 sqm housing repair and
maintenance services, ship chandlers, etc
Fuelling wharf
Sewer pump out
Dry Stack (under review)
Potential dry stack for up to 150 boats
Public Boat Ramp
2 lane public boat ramp with car and trailer parking
Retail
Main Street mixed use district centre
5,800 sqm retail including supermarket of 3,500 sqm
1,000 sqm of commercial space
1,200 sqm of tourism based retail – eg tavern, restaurants, etc
Hotel
4 Star hotel with supporting restaurant, bar, conference, reception and
service areas
Residential
778 apartments
459 medium density
319 detached
Business Park (employment
30,000sqm GFA of commercial space in business park
generating lands)
Community Uses
Community Centre to be located within main street retail centre
BALANCE OF SHELL COVE PROJECT
Residential
2,010 dwellings comprising 1,764 residential allotments and 246 medium
density dwellings. Note: these dwellings will be fully completed by 2017
School
Public Primary school developed by Dept Education – year K to 6
Childcare
3 child care centres
202.5 Catchment Definition
The following maps show the Shell Cove development location in context to surrounding
LGA boundaries and 10km catchment area. The 10km catchment radius takes in
suburbs from the LGAs of Kiama, Wollongong and Shellharbour. The suburbs are:
10km Catchment Suburbs
Minnamurra Yallah Kiama Downs Shell Cove Primbee
Albion Park Lake Illawarra Oak Flats Mount Warrigal Dunmore
Warilla Albion Park Rail Bombo Windang Shellharbour
Barrack
Heights Croom Blackbutt Kiama Barrack Point
Flinders
Shell Cove 5km and 10km Catchment Area Map
Source: MacroPlan (2017)
211.6. Study and Modelling Assumption Limitations
The study is based on a series of assumptions and principles on which the modelling and
other work is based upon.
As such, the forecasts should be used as a guide in the development of future plans for
the community over time and it is important to recognise that changes in the
assumptions and the surrounding environment could influence the results. These
changes could include release of new land and / or the development of new housing
opportunities elsewhere locally or in NSW, a shift in the demographic profile in the area
(for example, an exit of the older population and a stronger than expected increase in
the number of families entering the region).
22Section 3: Policy Context
3.1 Overview
This section discusses the key policy drivers affecting the current study.
Illawarra-Shoalhaven Regional Plan
The Illawarra Region is framed by the natural features of the Illawarra Escarpment and
coastline. It is home to more than 400,000 people, delivered $16.2 billion in economic
output to the State (in 2013), and the regional city of Wollongong. The southern portion
of the region is characterised by cultural landscapes and agricultural lands that provide a
long-term resource for sustainable food production.
According to the latest NSW population projections, by 2036, the region's population is
expected to increase by 67,050 people from 2016. The Regional Plan aims to ensure that
adequate housing is available and appropriately located to sustainably accommodate the
region's sustainable economic growth over the next 20 years. The Plan also integrates
economic, social and environmental considerations in the interests of achieving
ecologically sustainable development for the region.
Selected items with most relevance to the subject area as follows:
• Develop a stronger marine-based tourism industry, capitalising on the region’s
numerous small ports and building on The Waterfront, Shell Cove marine facility
• Deliver housing in new release areas best suited to build new communities,
provide housing choice and avoid environmental impact Established and smaller
release areas will add to the diversity of supply such as Shell Cove, Tullimbar,
Haywards Bay, South Kiama, West Culburra, Vincentia, Sussex Inlet, Manyana
and Milton-Ulladulla.
• Sequence release areas, in the vicinity of mineral resources, to allow the
continuation of working extraction activities. In addition, identified release areas
such as Shell Cove (near Bass Point Quarry) and Spring Creek (near Bombo
Quarry) have sequenced development so that working quarries can continue to
23operate. This approach to the staged rollout of new release areas in the vicinity of
extractive operations should continue.
The Plan applies to the four local government areas of Kiama, Shellharbour, Shoalhaven
and Wollongong. The Plan will be reviewed every five years. The implementation of these
actions, in the Regional Plan, will be the responsibility of the NSW Government, the four
local Councils and the Illawarra Pilot Joint Organisation (JO).
24Section 4: Demographic Context
4.1 Overview
This section discusses the current and emerging demographic context of the catchment
and precinct under investigation.
4.2 Current Demographic Profile and Composition
Overall, the catchment and surrounding area was found to be very similar to regional
NSW in most socio-economic and demographic indicators. As of the 2016 Census, the
population of Shell Cove and the greater Shellharbour LGA area was characterised by:
• Household sizes slightly above state averages (differ from 2011 Census).
• Household incomes in Shellharbour (LGA) and the 10km catchment are
approximately 10% below the NSW State average.
• While there is some variation across the different geographic areas, generally age
distribution is in line with regional averages with the exception of Shellharbour
LGA’s 5-24 age brackets which is above the NSW State average.
• The proportion of family types was broadly in line with NSW State proportions.
The proportion of one parent families with children was slightly higher in the
10km catchment than the NSW State average (differ from 2011 Census).
• The 10km catchment and Shellharbour (LGA) both have above average
proportions of owner & purchaser households.
• Shellharbour (LGA) and the 10km catchment have high proportions of low density
dwellings.
• A smaller proportion of people were born overseas for the both the 10km
catchment and Shellharbour (LGA) than the NSW State average. Although these
proportions were higher than the NSW Regional average.
The Key Indicators are provided in the figure overleaf. This includes a comparison of
each of the socio-economic characteristics in the 10km catchment and Shellharbour
(LGA) to NSW State averages.
25Shell Cove Catchment Key Indicators Table (2016 Census)
Sydney New South
10km Shellharbour New South
Metropolitan Wales Regional
catchm ent LGA Wales
Area Balance
Headline Indicators (2016)
Population and Households
Persons 83,865 68,460 4,823,991 2,643,536 7,480,228
Households 29,709 23,627 1,623,868 980,437 2,604,320
Average Household Size 2.82 2.70 2.80 2.40 2.60
Socio-Economic Snapshot
Incom e and Wealth
Average Household Income $70,841 $69,836 $91,000 $60,736 $77,272
variation from NSW State average -8.3% -9.6%
Average Mortgage Repayment $23,329 $22,152 $26,004 $19,080 $23,832
variation from NSW State average -2.1% -7.0%
Occupation
Clerical and Administrative Workers 14% 14% 15% 12% 14%
Community and Personal Service Workers 12% 13% 10% 12% 10%
Labourers 10% 11% 8% 11% 9%
Machinery Operators And Drivers 8% 9% 6% 7% 6%
Managers 10% 9% 14% 13% 14%
Professionals 17% 14% 26% 18% 24%
Sales Workers 12% 11% 9% 10% 9%
Technicians and Trades Workers 17% 18% 12% 15% 13%
Demographic Snapshot
Age Distribution
0-4 years 6% 6% 6% 6% 6%
5-14 years 12% 14% 12% 13% 12%
15-24 years 12% 14% 12% 13% 12%
25-54 years 37% 38% 44% 36% 41%
55-64 years 14% 13% 11% 14% 12%
65 years and over 18% 17% 14% 20% 16%
Fam ily Types
Couple family w ith children 37% 35% 33% 42% 37%
Couple family w ithout children 44% 45% 50% 39% 46%
One parent family 18% 19% 15% 17% 16%
Other Family 1% 1% 2% 1% 2%
Lone Households 23% 21% 22% 28% 28%
Group Households 2% 2% 5% 3% 3%
0%
Tenure Type
Ow ner 40% 34% 29% 37% 32%
Purchaser 31% 36% 33% 31% 32%
Renter 26% 27% 34% 28% 32%
Other 0% 1% 1% 1% 1%
Dw elling Type
Separate House 74% 80% 57% 82% 66%
Semi-detached 21% 14% 14% 9% 12%
Flat, Unit, Apartment 4% 4% 28% 6% 20%
Birthplace
Australia 76% 77% 57% 81% 66%
Overseas 24% 23% 43% 19% 35%
Source: MacroPlan (2018) and ABS Census (2016)
264.3 Population Projections
According to our population projections in the catchment area 1 , the 10km catchment
population of the region is expected to increase to 87,132 persons by 2021 and 98,522
persons by 2036. This represents approximately 15,650 person increase between 2016
and 2036, at an average rate of 0.9% per annum.
Projected Population by Age Cohort within a 10km radius, Selected SA2 regions
2016 2021 2026 2031 2036
0-4 5103 5378 5529 5543 5584
5-9 5485 5645 5951 6115 6130
10-14 5327 5543 5685 5988 6133
15-19 5470 5455 5666 5848 6115
20-24 5043 4888 4877 5062 5235
25-29 4450 4329 4222 4199 4348
30-34 4887 5323 5166 5045 5033
35-39 4775 5511 5923 5785 5667
40-44 5452 5261 6009 6430 6285
45-49 5409 5631 5449 6189 6608
50-54 5718 5532 5730 5587 6325
55-59 5701 5773 5598 5799 5640
60-64 5035 5675 5734 5588 5807
65-69 4794 5224 5898 5976 5870
70-74 3708 4424 4867 5494 5594
75-79 2838 3354 4041 4457 5087
80-84 1921 2152 2576 3155 3527
85+ 1755 2034 2338 2838 3535
Total 82,872 87,132 91,261 95,097 98,522
Source: MacroPlan (2017), ABS Census (2016), DP&E Population Projections (2016)
Notably, much of the population growth is expected to come from the 70+ age cohorts
at an average of 2.8% pa over the 20 years to 2036. Within this age group, the 80-84
and 85+ age cohorts will experience the rapid growth at 3.1% and 3.6%, respectively.
1
Our population projection adopts the NSW projected population growth rates of the corresponding aged
groups in the selected LGAs – Shellharbour, Wollongong and Kiama
27Section 5: Community Infrastructure
5.1 Overview
This section provides a theoretical and practical framework to help guide the
development of community infrastructure.
In particular, the section discusses:
• Current emerging trends in community infrastructure
• Best-practice examples
• Principles
• Standards for consideration.
5.2 Community Infrastructure Approaches
There are various approaches to community infrastructure planning and provision.
These include:
• Hierarchical provision (using a regional, local and state framework) – which allow
provision to key market / community catchments and
• Integrated approach which seeks to combine different facilities and which can
leverage the benefits and synergies of different facilities.
Often these approaches are combined. The current study adopts a combined approach to
leverage the key benefits of each.
5.3 Community Infrastructure Principles
A set of principles have been developed to help guide the development of community
infrastructure.
These include:
• Hierarchy of facilities / settings – regional, district and local facilities each perform
a different role. As such, sizing and features will differ by the level of the
community
• Hubbing / co-location integration - combining facilities helps to leverage the
benefits of each and improves the product offering and financial viability of each.
Activation is also improved through co-location
28• Multiuse – A diversity of uses improves activation, diversity and the flexibility of
facilities. Multiuse facilities also make facilities more dynamic making them more
responsive to the needs and aspirations of the community
• Flexibility (change function over time) – changing community expectations
require facilities to be flexible and adaptable. Facilities that are responsive will be
used more intensively over their lifetime
• Targeted to local needs / demands – Each community is different and changes
over time. Understanding and responding to the unique and individual
circumstances of the community increases the appeal of community infrastructure
• Activity generators (day / night) / active programming – Social and community
infrastructure are places of action and activity. These include both passive and
active forms of recreation and leisure. People are increasingly attracted to places
where they can be active and experience new things and infrastructure that
meets these needs will be used more intensively
• Access (disability access and transport) – Providing easy access to facilities
(through both better disabled access and transport) helps to ensure that a wider
range of people are attracted to and able to visit the facilities
• Visibility (highly visible location) – visible facilities are be more likely to be used
and are better able to compete with other forms of leisure, recreation and social
infrastructure
• Safety / security (passive surveillance) – the community expects that they and
their children will be safe in their own facilities. Ensuring that this is the case (and
perceived to be) will maximise the possibility that these facilities are used
effectively and efficiently
• Avoid duplication – Minimising duplication will ensure that resources are utilised
effectively and that each facility is unique thereby offering a better and attractive
product and service to the community
• Contribute to health, wellbeing and capacity – Social / community infrastructure
fulfils a critically important role in serving the needs and aspirations of the
community. Health and well-being are two basic needs. Maximising ‘capacity’ (or
the potential of each person and the community as a whole) will ensure that
everyone can be the best they can be
• Promote social equity – A rapidly changing economy and society has meant that
the gulf between people and communities has widened in recent years. Social /
community infrastructure plays an important role in bridging this gap through a
variety of means including through the establishment of networks and
collaborative activity, decreasing isolation and promoting skills and education
29(through for example the use of the Internet and other technologies which helps
to reduce the digital divide).
• Seek sustainable approaches to management, funding and maintenance (capital
and operating) e.g. whole of life costs – Facilities that are sustainable in the long
term are more likely to remain as key community assets and provide a better
community service
• Create local competitive advantage, uniqueness and identity – Reflecting and
serving the local community is important in an age where competitive advantage,
uniqueness and identity are increasingly found in local things and where regions
and areas compete globally for knowledge, resources and workers. Dynamic and
responsive community / social infrastructure can help set a local community apart
and provide new opportunities at a state, national and international level.
5.4 Community Infrastructure Standards
In order to assess the demand for community infrastructure in the area MacroPlan has
developed community infrastructure standards that take into consideration:
• Community infrastructure standards from the Development Code produced by the
GCC (October 2006). The standards relate a range of community infrastructure
facilities to the current and emerging population
• Demand / population projections (also using specific groups where required, for
example 70+ cohorts or children aged 0-4) in the precinct
• Estimates of current and future supply of community /social infrastructure within
a 5km or 10km catchment and
• Previous lessons and experience in community infrastructure.
It is noted that the demand / supply balance uses different catchments (with the supply
catchment covering a larger area). Hence, care must be taken in interpreting the results
as the number of facilities provided by the economic model (the balance between supply
and demand) must take into account possible usage and travel patterns (which will be
determined in part by distance and the nature of the facility). For example, some
residents may consider facilities 5km too far. Hence, this may require a smaller facility
closer to a local population. This is most evident in the provision of public open space
where a small neighbourhood park can meet local needs within a 500m radius, while a
regional park will attract users from larger distances.
30The table overleaf outlines the specific number of community facilities that would be
required to cater to the proposed population of the Shell Cove Boat Harbour
development alone. When considered in conjunction with the broader area, key
recommendations can be developed for the subject site.
The following table highlights the community infrastructure requirements as determined
by simple provision ratios. As can be seen, due to the size of the development, there
are limited requirements when only considering the development site that include:
8.04 ha of open space that includes 1-2 neighbourhood parks
GCC Community Infrastructure Standards
Type of facility Number Required* Benchmark Size
Education
Public Primary Schools 0 1:1,500 new 3 ha / 2.3 ha (if joint use)
dwellings (approx.)
Public High Schools 0 1:4,500 new 6-10 ha
dwellings (approx.)
Tertiary 0
Health and Social Welfare
Community Health Centre 0 1:20,000 people 2,000 sqm (for 80,000
people)
Hospital 0 2 beds: 1000
people
Residential Aged Care 0 1:10,000 (centre)
88 beds: 1,000
people 70 + years
Youth Centres 0 1:20,000 people
Community Service Centre 0 1:20,000 people
Childcare facility 0 1 place: 5 children
0-4 years
After school care facility 0 1 place: 25 children
5-12 years
Culture
Branch Library 0 1:33,000 people 2,400 sqm
District Library 0 1:40,000 people 2,400 sqm
Performing Arts / Cultural 0 1:30,000 people 0.24 ha – 8 ha
Centre
Emergency Services
Ambulance 0 1 (Station): 105,000 To accommodate 12
population ambulances
Fire Station 0 1 (Station): 60,000 2,000 sqm min
population
Police Station 0 1 (Station): 108,000 4,000 sqm (for first 10
population years)
Community Centres
Local 0 1:6,000 people 1,500-2,400 sqm
District 0 1:20,000 people 2,000-2,500 sqm
Source: Growth Centres Commission (2006) & CoS urban areas standard
* Will be further refined through Precinct planning. May be refined through specific studies.
31GCC Community Open Space Standards
Open Space and Recreation
Overall Open Space 8.04 ha 2:83 ha: 1,000
people
Neighbourhood Open 1-2 1:2,000 people 1 ha
Space
Local Open Space 0 1:10,000 people 2 ha
District Open Space 0 1:100,000 people 5 ha
Local Sports Ground 0 1:10,000 people 1 ha
District Sports Ground 0 1:30,000 people 2 ha
Regional Sports Ground 0 1:200,000 people 5 ha
Local Tennis Centre 0 1:10,000 people 1 ha
District Tennis Centre 0 1:30,000 people 1 ha
Equestrian 0 1:30,000 people 2 ha
Lawn Bowls 0 1:30,000 people 1 ha
Netball / Basketball Local 0 1:10,000 people 1 ha
Netball / Basketball 0 1:30,000 people 2 ha
District
District Aquatic Centre 0 1:100,000 people 1 ha
Regional Aquatic / Indoor 0 1:300,000 people 2 ha
Sports Centre
Source: Growth Centres Commission (2006)
32Section 6: Current Supply and Opportunity Assessment
6.1 Overview
This section discusses the required social infrastructure in the precinct.
6.2 Methodology
The requirement for additional social infrastructure has been based on an economic
model which seeks to understand the balance between:
• Demand / population projections (using specific groups where required, for
example 70+ or children aged 0-4) in the precinct and
• Estimates of current and future supply of community /social infrastructure within
a 5km or 10km catchment.
In addition, a range of other qualitative and quantitative factors are utilised to
understand the nature, type and product requirement for social / community
infrastructure.
We note that the proponent, Frasers Property Group, seeks for modification to the Shell
Cove Boat Harbour Concept Plan Approval under Section 75W of the Environmental
Planning and Assessment Act 1979. The design as proposed has been modified since,
therefore we reassessed the potential social infrastructure impacts of the Shell Cove
development.
Summary table – MacroPlan SIA 2008 & MacroPlan SIA 2017
2008 Assessment 2017 Assessment
A primary school 8.04 ha of open space that includes
6 hospital beds 1-2 neighbourhood parks
High and low aged care facilities
Child and afterschool care
8.49ha of open space that includes 1-2
neighbourhood parks
Source: MacroPlan (2017)
336.3 Scope of Community/ Supply Facility
The following facilities (consistent with the GCC Development Code) have been
considered and assessed:
• Primary Schools
• High Schools
• Tertiary
• Health and Social Welfare
• Community Health Centre
• Hospital
• Aged Care Housing
• High Care (Nursing home)
• Low Care places (Hostel)
• Youth Centres
• Community Service Centre
• Childcare facility
• After school care facility
• Culture
• Branch Library
• District Library
• Performing Arts / Cultural Centre
• Emergency Services
• Ambulance
• Fire Station
• Police Station
• Community Centres
• Local District
• Open Space and Recreation
In many cases opportunities for integration and collocation have been recognised. This
ensures that one facility with multiple functions can be used for a variety of functions.
6.4 Emergency Infrastructure
6.4.1 NSW Fire Stations Current and Future Supply
There are currently 2 fire stations located in the 5km catchment radius and 3 located in
5-10km catchment radius.
34Recommendation
From 2008 to now there has been a 67% increase in numbers of NSW Fire Stations,
reflecting the increasing demand for Fire Services arising from the recent residential
development.
In our view, there is adequate supply of fire stations in the catchment radius.
However, further consultation will need to occur with appropriate authorities for
provision in the future as growth occurs.
Frasers has indicated that all new apartment and hotel buildings will have sprinkler
system which will contain fires before they burn over large areas (i.e. preventing fire
spread and growth).
6.4.2 NSW Ambulance Service Current and Future Supply
There is currently 1 ambulance service located in the 5km catchment radius and 1
located in 5-10km catchment radius.
Recommendation
From 2008 to now there has been a 100% increase in numbers of NSW Ambulance
Stations, reflecting the increasing demand for ambulance services arising from the
recent residential development, particularly the Dapto and Calderwood regions.
There is likely to be an adequate supply of ambulance stations in the catchment
radius, further consultation will need to occur with appropriate authorities for provision
in the future as growth occurs.
6.4.3 NSW Police Service Current and Future Supply
There are currently 1 police service located in the 5km catchment radius and 2 located in
5-10km catchment radius.
Recommendation
From 2008 to now there has been a 200% increase in numbers of NSW Police Stations,
reflecting the increasing demand for Police Service arising from the recent residential
development.
35In our view, there is adequate supply of police stations in the catchment radius.
However, further consultation will need to occur with appropriate authorities for
provision in the future as growth occurs.
6.5 Primary and Secondary School Infrastructure
6.5.1 Primary School Current and Future Supply
There are currently 16 primary schools located in the 5km catchment radius and 11
located in 5-10km catchment radius. The large number of primary schools is likely due
the high levels of young families in the catchment area.
Shell Cove Public School is the local Primary School, which is the closest to the
subject site within Shell Cove. Shell Cove Public School offers multiple outdoor play
areas including a basketball court, playground and expansive grassed areas.
Notably, Shellharbour Public School and Stella Maris Catholic Primary School, in
the township of the Shellharbour Village, are also in a close locality. The dwellings within
existing stage 8 and 9 and the Shell Cove Boat Harbour Precinct are primarily within the
local school catchment of Shellharbour Public School.
Prim ary Schools
As is
2016 2021 2026 2031 2036
Supply (0-5km s) 16 16 16 16 16
Supply (5-10km s) 11 11 11 11 11
Supply (total) 27 27 27 27 27
Required (1:1,500 new dw ellings) 21.9 23.4 24.8 26.2 27.4
Surplus/Shortage 5.1 3.6 2.2 0.8 -0.4
With additional dwellings
2016 2021 2026 2031 2036
Supply (0-5km s) 16 16 16 16 16
Supply (5-10km s) 11 11 11 11 11
Supply (total) 27 27 27 27 27
Required (1:1,500 new dw ellings) 21.9 23.5 24.9 26.2 27.5
Surplus/Shortage 5.1 3.5 2.1 0.8 -0.5
*with higher maximum number of dwelling from 1,238 to 1,556
36Recommendation
From 2008 to now there has been a 29% increase in numbers of primary schools,
reflecting the increasing demand for primary schools arising from the recent residential
development.
Shellharbour Public School and Stella Maris Catholic Primary School, in the
township of the Shellharbour Village, are also in a close locality. The dwellings in the
stage 8 and 9 at Shell Cove Boat Harbour Precinct are primarily within the local school
catchment of Shellharbour Public School.
In our view, there is adequate supply of primary schools in the catchment radius.
According to our assessment, there is already a high level of supply of primary schools
in the area.
The development site will not require a primary school according to MacroPlan’s
community infrastructure standards.
6.5.2 Secondary School Current and Future Supply
There are currently 4 secondary schools located in the 5km catchment radius and 4
located in 5-10km catchment radius. Shellharbour Anglican College is located across
the road from the western entrance of Shell Cove.
According to our analysis (below), there is a spare capacity of about 1,400 high school
students (senior school) across the catchment area.
School Enrolment Status and Total Capacity (2016)
No. of No. of
Total Gap Assessment
students Classroom
Capacity (surplus/shortage)
enrolled teachers
Lake Illawarra High School 600 33 660 60
Oak Flats High School 800 44 880 80
Warilla High School 1,101 63 1,260 159
Albion Park High School 767 41 820 53
Kiama High School 1,048 53 1,060 12
Shellharbour Anglican College 719 53 1,060 341
Illawarra Christian School 273 26 520 247
Corpus Christi Catholic High School 984 70 1,400 416
Source: MacroPlan (2017), Various annual reports from high schools (2016)
37High Schools
As is
2016 2021 2026 2031 2036
Supply (0-5km s) 4 4 4 4 4
Supply (5-10km s) 4 4 4 4 4
Supply (total) 8 8 8 8 8
Required (1:4,500 new dw ellings) 7.3 7.8 8.3 8.7 9.1
Surplus/Shortage 0.7 0.2 -0.3 -0.7 -1.1
With additional dwellings
2016 2021 2026 2031 2036
Supply (0-5km s) 4 4 4 4 4
Supply (5-10km s) 4 4 4 4 4
Supply (total) 8 8 8 8 8
Required (1:4,500 new dw ellings) 7.3 7.8 8.3 8.7 9.2
Surplus/Shortage 0.7 0.2 -0.3 -0.7 -1.2
*with higher maximum number of dwelling from 1,238 to 1,556
Recommendation
From 2008 to now there has been a 33% increase in numbers of high schools, reflecting
the increasing demand for high schools arising from the recent residential development.
In our view, there is currently adequate supply of high schools in the catchment
radius. According to our assessment, there is already a high level of supply of high
schools in the area to 2026.
Our spare capacity assessment for each secondary school across the catchment area
indicates that no new secondary school is needed in the short term since there is
enough spare capacity in the catchment area.
However, the Boat Harbour development will contribute to catchment demand
for an additional high school. According to our assessment, one high school might
be needed in the long term (2036 onwards) but further consultation will need to occur
with appropriate authorities for provision in the future as growth occurs.
We also note that there are 4 secondary schools located in the 5km catchment radius,
particularly Shellharbour Anglican College is located across the road from the
western entrance of Shell Cove.
386.6 Community Health Facility
6.6.1 Current and Future Supply
There are currently 1 Community Health Facilities located in the 5km catchment radius
and 1 located in 5-10km catchment radius.
Notably, Shell Cove Family Health is the local health practice located closest to the
subject site within Shell Cove. The community health facility offers a range of primary
care services including:
o Doctors – General Practice (8 – 10 general practitioners available)
o Primary Health Nursing
o Dietitians
o Exercise Physiology
o Physiotherapy
o Clinical Psychology
o Podiatry
o Pathology
Com m unity Health Facilities
As is
2016 2021 2026 2031 2036
Supply (0-5km s) 1 1 1 1 1
Supply (5-10km s) 1 1 1 1 1
Supply (total) 2 2 2 2 2
Required (1:20,000 people) 4.1 4.4 4.6 4.8 4.9
Surplus/Shortage -2.1 -2.4 -2.6 -2.8 -2.9
With additional dwellings
2016 2021 2026 2031 2036
Supply (0-5km s) 1 1 1 1 1
Supply (5-10km s) 1 1 1 1 1
Supply (total) 2 2 2 2 2
Required (1:20,000 people) 4.1 4.4 4.6 4.8 5.0
Surplus/Shortage -2.1 -2.4 -2.6 -2.8 -3.0
*with higher maximum number of dwelling from 1,238 to 1,556
We also do note that a development recently commenced for a single community health
centre at the former Kiama Hospital site; however, there is no further information
available just yet (anticipated to occur in early 2017).
39Recommendation
According to MacroPlan’s community infrastructure standards, there will not be a
need for a community health facility to be incorporated into the development site.
Provision ratios demonstrate a need for community health facilities in the 10km
catchment radius, but this demand should be met either within the Shell Cove region
(i.e. Shell Cove Family Health) within other local areas in the catchment radius by the
relevant authorities and other facilities (e.g. Shellharbour private and public hospitals
etc).
Shell Cove Family Health is the local health practice located closest to the subject site
within Shell Cove. The community health facility offers a range of primary care services
including:
o Doctors – General Practice (8-10 general practitioners available)
o Primary Health Nursing
o Dietitians
o Exercise Physiology
o Physiotherapy
o Clinical Psychology
o Podiatry
o Pathology
Furthermore, there is a development recently commenced for a single community
health centre at the former Kiama Hospital site; however, there is no further
information available just yet (anticipated to occur in early 2017).
6.7 Regional Health Facilities
6.7.1 Current and Future Supply
There are currently 2 hospitals located in the 5km catchment radius and 1 located in 5-
10km catchment radius.
40You can also read