The Market for Acquiring Card Payments from Small and Medium-Sized Canadian Merchants
←
→
Page content transcription
If your browser does not render page correctly, please read the page content below
Staff Discussion Paper/Document d’analyse du personnel —
2020-5
Last updated: June 4, 2020

The Market for Acquiring
Card Payments from Small
and Medium-Sized
Canadian Merchants
by Angelika Welte and Jozsef Molnar

Currency Department
Bank of Canada, Ottawa, Ontario, Canada K1A 0G9
awelte@bank-banque-canada.ca

Bank of Canada staff discussion papers are completed staff research studies on a wide variety of subjects relevant to
central bank policy, produced independently from the Bank’s Governing Council. This research may support or
challenge prevailing policy orthodoxy. Therefore, the views expressed in this paper are solely those of the authors and
may differ from official Bank of Canada views. No responsibility for them should be attributed to the Bank.
ISSN 1914-0568                                                                                  ©2020 Bank of Canada
Page i

Acknowledgements
We thank Walter Engert, Ben Fung, Fumiko Hayashi, Kim P. Huynh, Sajjad Jafri, Charles Kahn
and Alex Shcherbakov for helpful discussions, comments and suggestions. Jozsef Molnar
acknowledges the hospitality of the Bank of Canada for his one-year assignment when this
paper was written.
Page ii

Abstract
This note uses industry data and a unique dataset of small and medium-sized merchants to
provide insights into the acquirer-merchant market in Canada. Three main findings are
presented. First, smaller merchants pay their acquirer more for every dollar of card payment
than larger merchants. Second, this finding is mainly explained by high fixed costs. Third, the
acquiring market in Canada is concentrated and has remained fairly stable since 2010.

Topics: Financial services; Market structure and pricing; Payment clearing and settlement
systems
JEL codes: C, C2, D, D2, E, E4, E42

Résumé
Dans cette note, nous utilisons des données sectorielles et un ensemble de données unique
provenant de commerçants de petite ou moyenne taille pour mieux comprendre le marché
des commerçants et des acquéreurs au Canada. Nous présentons trois grandes constatations.
Premièrement, les petits commerçants versent davantage d’argent à leur acquéreur pour
chaque dollar de paiement par carte que les commerçants de moyenne taille. Deuxièmement,
cette situation s’explique surtout par des coûts fixes élevés. Troisièmement, le marché de
l’acquisition au Canada est concentré, et il est demeuré assez stable depuis 2010.

Sujets : Services financiers; Structure de marché et fixation des prix; Systèmes de compensation
et de règlement des paiements
Codes JEL : C, C2, D, D2, E, E4, E42
Page 1

Introduction
The Bank of Canada is the sole issuer of bank notes in Canada and has an ongoing interest in
the evolution of retail payments. Card payments are displacing cash at the point of sale (POS),
and the role of the Bank of Canada in overseeing retail payments might be expanding. Given
these changes, the economics of the card ecosystem has become an area of research for the
Bank. 1 The participants in the card ecosystem are the card networks, cardholders, issuers,
merchants and acquirers. Acquirers are payment service providers that offer merchants access
to the card networks. 2 The Bank’s previous research has focused on cardholders, merchants
and issuers (Kosse et al. 2017). The purpose of this note is to describe the acquirer-merchant
relationship and the acquiring market structure in Canada. In 2018, acquirers provided debit
card services to almost 500,000 merchants and credit card services to about 1 million
merchants in Canada. 3 Acquirers enable merchants to accept card payments; thus, they play a
key role in card payments.
Although the literature (Rochet and Tirole 2002, for example) and industry experts
(Van Duynhoven 2010) seem to imply that the Canadian acquiring market is efficient and
even competitive, empirical work on fees merchants pay to acquirers and on market structure
in Canada is lacking. A report by the European Commission (2006) looks at the acquiring
market in the EU-25 group of countries before the creation of the Single Euro Payments Area.
Kjos (2007) discusses the US acquiring market, and Ho, Xu and Zhang (2019), using data on
Chinese merchants, study a monopolistic acquiring market.
Kosse et al. (2017) compute resource costs of providing cash and card payments in Canada.
They use a representative sample of small and medium-sized businesses (SMBs) that
responded to the 2015 Retailer Survey on the Cost of Payment Methods (RSCPM). They
assume that acquirers’ costs are equal to the fees they charge merchants. These fees blend
fees remitted to other payment system participants with the acquirers’ own fees. In
subsequent work, Fung et al. (2018) find heterogeneity in merchant fees. These studies
motivate us to analyze acquirer prices by size of business.
Three main findings contribute to our understanding of the Canadian acquiring market:
1.     Based on the representative sample of SMBs in Kosse et al. (2017), we find that
       smaller merchants pay their acquirer more for every dollar of card payment than
       larger merchants.
2.     Monthly fixed fees paid to the acquirer are proportionally more significant for
       merchants with lower card sales.
3.     Four large acquirers process about 85 percent of card transactions in Canada. While
       we discuss potential drivers of the observed market structure, further research and

1
    For more on this, see Annex 4 in the Government of Canada’s Budget 2019.
2
    In this note, “acquirer” also includes independent sales organizations (ISOs), unless the distinction is important.
     ISOs can act as sales agent for full services or offer partial services to merchants who also have an agreement with
     an acquirer. ISOs do not have direct access to the card network. See “Payment card industry: the basics for
     merchants.”
3
    See Interac and Canadian Bankers Association. Our data focus on small and medium-sized POS merchants, which
     explains why debit and credit card acceptance rates are both in the range of 60 to 70 percent. In contrast, the
     network data imply that credit cards are accepted by twice as many merchants as are debit cards.
Page 2
empirical evidence, which are beyond the scope of this note, are needed to assess
the efficiency of the Canadian acquiring market.
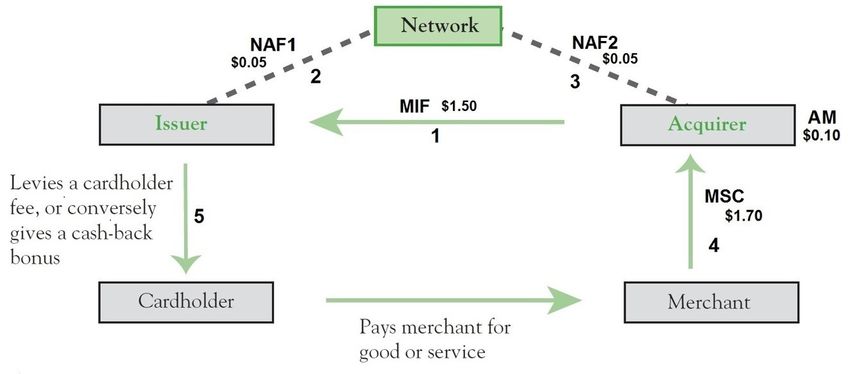
The role of acquirers in a four-party card system
Most card payments in Canada go through one of two major credit card networks, Visa and
MasterCard, or the domestic debit card network, Interac. These card payment systems use a
four-party model, where the acquiring, issuing and network operations are separate
(Figure 1). 4
Acquirers in the four-party system generally offer three types of service:
• signing up merchants for card networks and supplying them with the necessary
equipment;
• authorizing, processing and settling card payments and providing dispute resolution;
and
• providing merchants with monthly statements and services such as consulting or
integration with accounting systems. 5
Figure 1: Four-party card payment system
Note: Adapted from Tirole (2011). Amounts and fees are illustrative and reflect only transaction-level
charges. MIF is the merchant interchange fee; NAF is the network access fee; AM is the acquirer margin;
and MSC is the merchant service charge.
4
An example of a three-party system is American Express, in which the network acquires merchants and issues
payment cards.
5
A fourth service that can be provided in a four-party card system is the provision of consumer credit. In Canada,
Caisse Desjardins provides consumer financing for retail purchases through acquired businesses under the
Accord D program.Page 3
Canadian acquirers typically charge merchants monthly. The charges consist of fixed and
transaction-based fees. The latter are called merchant service charges (MSCs). 6 This price
structure, a two-part tariff, is common for service industries (Tirole 1988). Figure 1 shows how
the MSC is distributed across the participants in the card payment system. The MSC usually
has three components:
• the multilateral interchange fee (MIF) paid to the card issuer;
• the card network access fee (NAF), which the acquirer must remit to the network;
• the acquirer margin (AM), which is the MSC net of NAF and MIF. 7, 8
For most credit card payments, all three components are a percentage of the
transaction amount. For most PIN debit card transactions, the MSC is a fixed fee per
transaction and the MIF is equal to zero. 9 In sum, the merchant’s cost is the total of
fixed charges and the MSC, while the acquirer’s revenue (net of MIF and NAF) is the
total of fixed charges and the AM.
The 2015 RSCPM data are a representative sample of small and medium-sized brick-and-
mortar merchants that accepted payments at a physical POS. The data show that economies
of scale exist for these merchants. With the two-part tariff structure consisting of a fixed
monthly charge and per-transaction MSC, merchants with higher sales have a lower acquiring
cost per dollar.
Table 1 breaks down acquirer charges by sales. We find that total acquirer charges in 2014
were around $539 per month on average, representing 1.8 percent of the processed card
sales. Of those charges, on average, fixed charges account for $56 a month, or just under
0.5 percent of the total processed card sales. MSCs account for $483 or 1.3 percent of the
total processed card sales. SMBs with less than $250,000 in annual sales are considered small,
those with sales between $250,000 and $850,000 are considered medium, and those with
sales above $850,000 are considered large. 10 Small businesses have the highest relative cost
(3.8 percent of processed card sales), while large businesses have the lowest relative cost
(1.3 percent). This difference is explained mainly by the share of fixed charges. For a typical
small business, fixed charges make up about one-third of their monthly charges ($47 out of a
total of $131), while they are just 4 percent for a larger SMB ($68 out of a total of $1,594).
Almost half of businesses with annual sales below $250,000 report higher fixed charges than
variable fees (MSCs) in a typical month. In contrast, only 17 percent of mid-range SMBs and
6
This price structure has been confirmed by more than 100 merchant statements submitted by respondents to the
2015 RSCPM.
7
See Moneris. Different systems refer to the NAF in different ways: Visa calls it the Acquiring Assessment Fee,
MasterCard uses the term Acquiring Network Assessment Fee, and Interac uses the term Switch Fee.
8
Before 2015, the average MIF for a consumer credit card was 1.7 percent, and MasterCard MIFs were somewhat
higher than Visa MIFs (Hayashi, Cuddy and Hanson 2014). MasterCard contactless card payments below a certain
threshold have a fixed-fee MIF instead of a percentage. According to Moneris, MasterCard set its NAF at
0.077 percent and Visa at 0.08 percent for processing Canadian (“domestic”) credit cards.
9
We focus here on Interac debit card transactions. (Contactless Interac Flash transactions, which are growing quickly,
have an interchange fee.)
10
The boundaries for small, medium and large businesses line up with revenue quartiles published by Innovation,
Science and Development Canada for SMBs in the retail, restaurant and service industries.Page 4
6 percent of the larger SMBs report this. Therefore, fixed charges are a significant factor for
smaller SMBs but are less important for larger ones.
The relative impact of fixed charges could explain why 41 percent of the small brick-and-
mortar businesses in our sample accept only cash. In our sample, the variable fees (MSCs), as
a share of card sales, are also higher for the smaller SMBs, at 1.8 percent, compared with
1.2 percent for the larger SMBs. We do not break down the MSC further into its three
components. However, Cohen (2010) states that the AM varies with merchants’ turnover.
Further, interchange fees (MIFs set by the network) vary across merchant categories and with
the technology used for processing transactions. 11 On one hand, the effect of these variations
appears to be that the combined MSCs for debit and credit cards are higher for smaller
merchants in the data. On the other hand, a different mix of debit and credit card transactions
or lower average sales amounts at smaller businesses could also explain the difference in
relative MSCs.
Table 1: Breakdown of acquirer charges borne by small and medium-sized
businesses
Monthly acquirer charges Percent of card sales
Merchant Fixed
revenue charges
Fixed Total exceed Fixed Total
charges MSC charge MSC charges MSC charge Cash only
< 250K $47 $84 $131 0.47 2.04 1.78 3.82 0.41
250K–850K $57 $322 $379 0.17 0.28 1.22 1.51 0.04
>850K $68 $1,526 $1594 0.06 0.06 1.20 1.26 0.04
All $56 $483 $539 0.26 0.50 1.34 1.84 0.24
Note: Rows represent business categories by total sales in cash and cards. The first three columns report
acquirer charges in dollars. The fourth column reports the share of merchants that bear fixed charges
higher than MSCs. The next three columns report charges as a percentage of processed card sales. The
last column reports the share of businesses that accept cash only and do not accept debit or credit
cards. The table is based on 801 respondents; however, sample sizes vary in each cell. Estimates are
computed after dropping the highest 5 percent of entries from the respective subsamples and taking
the weighted sample mean. We drop the highest 5 percent since these businesses had low card
volumes in the reporting period, resulting in higher proportional charges. Qualitatively, including all
businesses does not change the relative size of the estimates when comparing across revenue
categories. Untrimmed results are available upon request. Survey weight used (Chen and Shen 2017).
11
MIFs are set by the network and also vary with merchant sales. In 2014, lower MIFs were available to merchants
with at least $400 million in sales (MasterCard) or least $850 million in sales (Visa). The merchants in our sample
are below this threshold. Our merchant data are for the year 2014. As announced by the Department of Finance,
Visa and MasterCard adjusted their interchange fees with the aim of “levelling the playing field in the latter half of
2014 and in 2018.Page 5
Market structure
This section describes market shares in the Canadian acquiring market. The market shares are
computed from industry data and from the 2015 RSCPM. 12 While industry data paint a broad
picture over time, the RSCPM data shed light on how the overall market shares might be
driven by, for example, merchants’ locations or their other banking choices.
Before describing the acquiring market structure, we provide some context for the acquiring
market in Canada. While acquirers in Canada need not be banks, most acquirers have
historical ties to banks or other deposit-taking institutions, and those links can influence
merchants’ choice of acquirer. 13 Until 2008, competition authorities required a non-duality
framework, meaning one financial institution could not be a member of both Visa and
MasterCard associations. 14 Financial institutions generally issued and acquired for the credit
card network they were a member of. The non-duality rule was to prevent a single financial
institution from dominating the issuing or acquiring markets. Before the non-duality rule was
dropped in 2008, some Canadian banks had already transferred their acquiring operations to
other, non-bank, entities. In 2000, the Royal Bank of Canada (RBC) and the Bank of Montreal
(BMO), under joint investment, created Moneris Solutions, while the Canadian Imperial Bank
of Commerce (CIBC) sold its acquiring operations and bought part of the acquirer Global
Payments. In 2002, Scotiabank sold its acquiring business to Chase Paymentech Solutions. As
of 2019, CIBC and Scotiabank refer their business customers to Global Payments and Chase
Paymentech Solutions, respectively. 15 A similar relationship exists between National Bank of
Canada and the acquirer First Data Corporation. When the RSCPM sample was collected,
TD Canada Trust and Desjardins Group still ran their own acquiring businesses. In November
2019, Global Payments bought Desjardins Group’s Canadian acquiring business. As part of
this transfer, Desjardins agreed to refer its clients exclusively to Global Payments for a period
of 10 years. 16
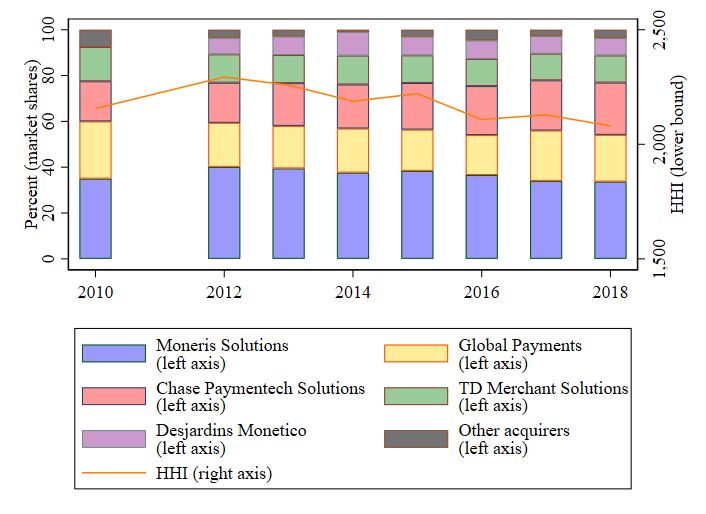
Chart 1 shows that from 2010 to 2018 five companies provided most acquiring services in
Canada in terms of the number of transactions. Based on these estimates, from 2010 to 2018
Moneris Solutions was the largest acquirer in Canada, with a market share around 30 to
40 percent. Global Payments and Chase Paymentech Solutions followed with around
20 percent of the market each, and TD Merchant Solutions had 10 to 15 percent. Desjardins
was the fifth-largest acquirer with a market share just under 10 percent. All other acquirers
contributed smaller shares. These top five acquirers covered about 85 to 90 percent of card
transactions in Canada and maintained stable market shares from 2010.
12
See Kosse et al. (2017) for a detailed description of the study design.
13
Acquirers’ relationships with merchants, networks and issuers fall under the Code of Conduct for the Credit and
Debit Card Industry in Canada. The code of conduct was set up in 2010 and updated in 2015.
14
See the Competition Bureau.
15
See CIBC and Scotiabank.
16
See, for example, this Global Payments news release.Page 6
Chart 1: Acquirers’ market shares, 2010 to 2018
Note: This figure was generated from multiple data sources: for 2010, it draws on a report by Deloitte
(2010); for subsequent years, it draws on The Nilson Report as well as data reported by the Canadian
Bankers Association and Interac. No data were available for 2011. The following assumptions were made
to compute market shares for Canada: The total volume of Visa and MasterCard transactions is from
credit card statistics compiled by the Canadian Bankers Association. Data for Amex transactions are
from The Nilson Report, and debit-transaction volumes are reported by the Interac association. Moneris,
Global Payments and TD Canada volumes are global volume minus US volume, Europe volume and
Asia-Pacific volume. Chase Paymentech Solutions volume is assumed to grow at the same rate as Chase
US because no separate numbers are available. Desjardins is taken as reported by The Nilson Report. To
compute the share, estimated processed volume for each acquirer (from The Nilson Report) is divided
by the estimated total volume of card transactions (Canadian Bankers Association, Interac and Amex).
The Herfindhal-Hischmann Index (HHI) is computed as the sum of squared market shares (in percent).
The highest possible HHI is 10,000 and corresponds to a monopoly.
Chart 2 shows the estimated market shares of acquirers in 2014 for SMBs according to three
different measures from the RSCPM data: number of merchants (SMBs), number of
transactions and transaction value. In these data, the top five acquirers also account for 85 to
90 percent of the transactions, but the share of Desjardins and smaller acquirers outside the
top five is larger than in the Nilson data discussed above. 17
17
Other, smaller acquirers in these data include Elavon and First Data.Page 7
Chart 2: Acquirers’ market shares in 2014 (RSCPM)
Note: The chart shows market shares of acquirers. Market shares are expressed in terms of the number
of small and medium-sized businesses, the number of processed transactions and the value of
processed transactions. Source: 2015 RSCPM data, survey weight used (Chen and Shen 2017).
Several factors could explain the differences between the two sources. First, the RSCPM
sample covers SMBs with a physical POS that operate in three industries: retail, food and
accommodation services, and personal services. If an acquirer focuses on other industries,
large businesses and chains, or online merchants, the RSCPM will underestimate its share.
Finally, the accuracy of the market shares in Chart 1 (computed from The Nilson Report data)
is limited because we have to estimate the volumes processed for Canada. The Nilson Report
does not always report separate numbers for Canada even though some acquirers have
multinational operations.
The recent transfer of Desjardins’s acquiring portfolio to Global Payments further emphasizes
the role of the remaining four large acquirers. The joint market share of the four largest firms
provides a straightforward measure of concentration. Our data sources suggest a
concentrated and stable acquiring market by Canadian standards, since four companies
supply more than two-thirds of acquiring services. 18 A different concentration measure, the
Herfindhal-Hischmann Index (HHI), also indicates that the market is concentrated. 19
18
Competition Bureau Canada’s Merger Enforcement Guidelines characterize a market as concentrated if the four
largest firms have more than 65 percent of the market.
19
The HHI is computed as the sum of the squared market shares in terms of transactions and then multiplied by
10,000. The HHI was used by the European Commission (2006) to study the structure of the acquiring market in
various European Union member states.Page 8 The RSCPM and other surveys have found that cash and card use vary across regions in Canada. For example, businesses and consumers rely more on cash in Quebec than in other regions (Henry, Huynh and Welte 2018). We also find regional variation in market concentration. The acquiring market appears to be most concentrated in the Prairies and Quebec and least concentrated in Ontario (Chart 3). Chart 3: Concentration in the acquiring market and cash preference Note: This chart plots the share of cash-only businesses against the Herfindhal-Hischmann Index (HHI) for five regions of Canada: Ontario (ON), British Columbia (BC), Atlantic provinces (AT), Quebec (QC) and Prairie provinces (PR). The orange line shows how much of the increase in the cash share is correlated with the increase in the HHI. Potential drivers of market structure A concentrated market has often been associated with high fixed set-up and operating costs (Tirole 1988), brand loyalty (consumer “stickiness”) or regulation (Bain 1959). These features, in turn, could generate barriers to entry that lead to a concentrated market structure. In this section, we explain how the costs of doing business and brand loyalty appear to be relevant factors for the acquiring market in Canada. Acquirers incur ongoing fixed costs and variable costs (Cohen 2010). Fixed operating costs are incurred regardless of how many merchants are acquired; that is, these costs prevail whether the acquirer signs up 10 or 10,000 merchants. Variable costs, however, vary directly with the number of merchants acquired and with the number and value of transactions processed.
Page 9

Acquirers bear large fixed costs for setting up, running and modernizing their payment
infrastructure. Furthermore, there are costs for every signed-up merchant. These include
customer service and recruitment, preparation and provision of statements, and maintenance
and technical support for POS terminals. These costs appear as fixed charges to the merchant
(as statement fees or equipment rental costs), but they are variable for the acquirer according
to the number of merchants served. Variable costs for the acquirers also include the fees they
pay to the card issuers (MIF) and card networks (NAF). The acquirer does not set these fees
and must remit them to card issuers and networks. 20 Other variable costs come from disputed
card transactions and “float fees” related to MIF and AM. These pose financial risks for
acquirers that increase with the transaction volume and amount. According to guidelines
published by Mastercard and Visa, the acquirer might have to cover a disputed, previously
authorized transaction when the merchant is found liable but does not have the funds to
cover the loss. 21 Financial risks due to float fees are incurred because the acquirer deposits
funds into the merchant’s account shortly after a purchase but receives the MSC only later,
typically after the monthly statement has been issued.
Merchant charges in a concentrated and stable acquiring market are not necessarily higher
than they would be in a more fragmented market. Similar to Allen and Engert’s (2007) work
on concentration and efficiency in the Canadian banking sector, we see three main reasons
why merchant charges would not decrease in a less concentrated market. First, in the
presence of high fixed costs, the market would also face trade-offs between concentration
and efficiency. While a less concentrated market with many small acquirers could be more
competitive, prices charged to merchants would not necessarily be lower because each small
acquirer would have a large fixed cost to distribute among fewer subscribing merchants.
Second, stability in the acquiring market also means that existing acquirers are reliable.
Merchants usually want to be sure that transactions settle without problems or frictions and
that they can access their funds as soon as possible after supplying the good or service to the
cardholder. Third, even in a concentrated market, large acquirers might not be able to charge
excessive prices or provide poor service if there is a credible threat from existing competitors,
or from potential entrants (“contestability”), where a new firm would take up the dissatisfied
consumers.
In summary, since participating in the acquiring market requires a large investment, to
operate profitably an acquirer must attract and retain many merchants and large transaction
volumes. High fixed costs, therefore, could be part of the explanation for why the acquiring
market in Canada and elsewhere is concentrated and stable.
Indeed, the structure of the Canadian acquiring market is similar to that of acquiring markets
in other countries with mature card payment systems. The Nilson Report states that the five
largest acquirers in the US market accounted for about 80 percent of the transactions
processed in 2018 and that their share had increased from 70 percent in 2008. Likewise, the
Australian market has been dominated by four acquirers (Katz 2001 and The Nilson Report).
Evans and Schmalensee (2005) conclude that the US acquiring market is concentrated and yet
competitive. First, they argue that the AM portion of the MSC is generally much smaller than
the MIF portion and has been falling over time. For Canadian merchants, the AM is also much
lower than the MIF, but our data show that conclusions about acquirer pricing need to

20
     For more details, see Moneris: “Interchange 101: What It Is and How It’s Determined.”
21
     See MasterCard’s “Chargeback Guide“ and Visa’s “Dispute Management Guidelines for Visa.”
Page 10
consider both AM and fixed charges. Thus, it is not clear how and whether Evans and
Schmalensee’s reasoning can be applied to the Canadian market.
The second part of their argument is that merchants can obtain quotes from several acquirers
and switch quite easily. The cost of switching in the Canadian acquiring market is an open
question. To address it, we would need to understand how often and under what
circumstances Canadian merchants switch acquirers. The Code of Conduct for the Credit and
Debit Card Industry in Canada specifies that merchants’ fixed-term contracts with acquirers
can be extended only for a period of six months after the initial fixed term, thus giving
merchants the option to switch after the initial contract expires. 22 However, this rule came
into effect only in 2015, after the 2015 RSCPM was conducted.
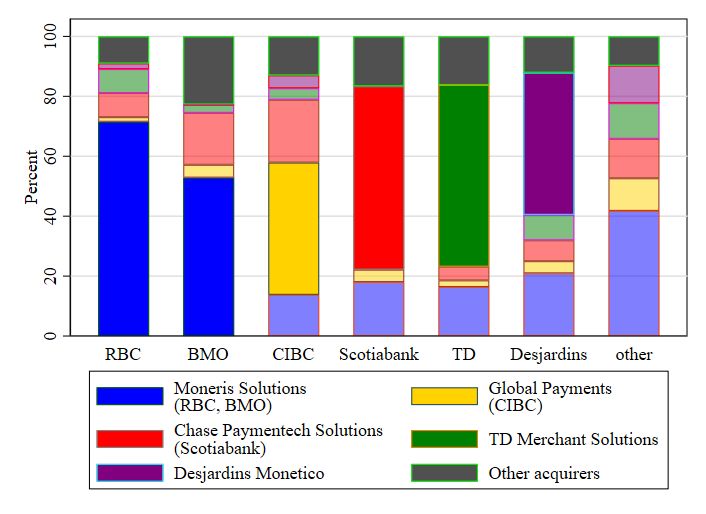
At the same time, we find that at least half the merchants in our dataset appear to bundle
acquiring services with their main bank account, which could make switching more difficult.
Chart 4 shows the percentage of merchants in our study whose acquirer is related to their
main bank. We see that each financial institution’s affiliated acquirer is the dominant acquirer
for each financial institution’s customers. Put differently, the share of the affiliated acquirer is
larger in each column than it is overall, and these differences are statistically significant. 23 For
example, around 55 percent of combined RBC and BMO customers use Moneris as their
acquirer, while only 20 percent of the clients of other banks use Moneris. This means that a
business banking with RBC or BMO is more than twice as likely to use Moneris as its acquirer
than are businesses that bank with other financial institutions.
22
See Code of Conduct for the Credit and Debit Card Industry in Canada.
23
This is based on a chi square test, available upon request.Page 11
Chart 4: Acquirers’ market shares in RSCPM conditioned on merchant’s main
bank
Note: The chart shows market shares of acquirers among the clients of a particular financial institution.
Market shares are expressed in terms of the number of processed transactions. Source: 2015 RSCPM
data, survey weight used (Chen and Shen 2017).
While large merchants could sponsor a new, lower-cost entrant, typically the larger merchants
also negotiate favourable rates with their existing acquirer. 24 Smaller merchants, however,
may have limited bargaining power in the acquirer-merchant relationship. One way for an
acquirer to attract small merchants and for smaller merchants to obtain more favourable
pricing would be exclusive member pricing for small business and industry associations.
Examples include the partnerships between Chase Paymentech and the Canadian Federation
of Independent Business and between Elavon and Costco. 25
Square is a relatively new entrant in the Canadian payment processing market. It offers
services without monthly fixed charges; that is, the merchant pays only the (variable) MSC.
Square uses the infrastructure of other acquirers to route its transactions. 26 As advertised on
the Square website, its fees are 2.65 percent of PIN credit card transactions and 10 cents per
Interac debit card transaction. 27
24
See, for example, paragraph (35) in De Armas (2010).
25
For more details, see Canadian Federation of Independent Business and Costco.
26
See Square’s legal terms.
27
See Square’s pricing.Page 12
As this market is two-sided (Rochet and Tirole 2002, Fung, Huynh and Kosse 2017), the
economic interpretation of the acquirer-merchant market must also consider the issuer-
cardholder side. On the one hand, as Chart 3 shows, the share of cash-only businesses seems
to increase with concentration. In this regard, the Prairies and Quebec have the highest
concentration in these data and the highest cash-only (lowest card acceptance) rates. Ontario
has the lowest concentration with the highest card acceptance rate. Given these results, the
acquiring market might be seen as less competitive in the Prairies and Quebec. This could
lead to high acquiring fees that might discourage smaller merchants from accepting cards.
On the other hand, influences on the cardholder side of the market could also explain this
pattern. Huynh, Nicholls and Shcherbakov (2019) show empirically that merchant acceptance
responds to consumer payment preferences, and Henry, Huynh and Welte (2018) find that
consumers in Quebec have a greater relative preference for cash over cards. In this case, the
demand for acquiring services could be lower in Quebec, and acquirers might choose not to
invest as much, given local preferences. Also, note that British Columbia and the Prairies have
similar levels of card acceptance, but the acquiring market in British Columbia is significantly
less concentrated than in the Prairies. Clearly, more data from both the acquirer-merchant
and issuer-consumer sides are needed to assess the statistical and economic relationship
between concentration and cash preference.
Concluding remarks
This note describes the card acquiring market in Canada. We use the 2015 RSCPM and
industry sources to shed light on market shares, prices and costs. We find that five
participants supplied the majority of acquiring services between 2010 and 2018. The market
appears to be stable and mature, and new entrants would face challenges, including
economies of scale and merchants’ preference to bundle acquiring with other banking
services. Furthermore, acquirers use two-part tariff pricing, and fixed acquirer charges might
affect card acceptance for small merchants to the same extent as transaction-level charges.
This work complements Fung et al.’s (2018) work on the latter type of charges. Finally, in the
data, market structures and card acceptance differed across regions.
We point out several areas for future research. First, the analysis is based on survey data for
2014. Since the Code of Conduct for the Credit and Debit Card Industry in Canada was
updated in 2015 and interchange fees were voluntarily reduced after the period covered by
the survey, the fee structure may have changed. 28 The exit of Desjardins from the acquiring
market might also affect the market structure. We need more recent data to understand how
and whether these developments also changed the market shares and pricing of acquirer
services.
Second, this analysis of acquirer fees applies to small and medium-sized businesses. Each
large business or chain would contribute a considerable number of transactions to the market
share of their chosen acquirer. Based on our analysis, large firms probably pay less per dollar
of processed card payment than the businesses in our sample. However, simple numerical
extrapolation would likely not be accurate. Jiongo (2017) discusses this issue further. A related
caveat is that smaller businesses have high fixed costs compared with their revenue for cost
items other than payment processing. 29 Also, although economic theory usually discusses
28
See this backgrounder from the Department of Finance Canada.
29
See, for example, the financial performance indicators published by Innovation, Science and Economic
Development Canada.Page 13 two-part tariffs in relation to market power, many service industries use this type of pricing, and the relationship between pricing structure and competition is an active area of research (Lambrecht et al. 2012). Combining insights from this area with research on two-sided card payment systems would therefore be valuable. Further, and perhaps more relevant in terms of the economic interpretation, a concentrated and stable acquiring industry could function in an efficient and reliable manner. Card ecosystems around the world have seen the involvement of public authority (Hayashi and Maniff 2019). However, we caution that our analysis cannot assess the efficiency and degree of competition in the Canadian acquiring industry. We leave this assessment as an open research question.
Page 14

References

Allen, J. and W. Engert. 2007. “Efficiency and Competition in Canadian Banking.” Bank of
Canada Review (Summer): 33–45.

Bain, J. S. 1959. Industrial Organization. New York: Wiley.

Chen, H. and R. Shen. 2017.” The Bank of Canada 2015 Retailer Survey on the Cost of
Payment Methods: Calibration for Single-Location Retailers.” Bank of Canada Technical
Report No.109.

Cohen, J. 2010. “Witness Statement of Jordan Cohen.” Available at https://decisions.ct-
tc.gc.ca/ct-tc/cdo/en/item/463342/index.do.

De Armas, M. 2010. “Witness Statement of Mario De Armas.” Available at https://decisions.ct-
tc.gc.ca/ct-tc/cdo/en/item/463361/index.do.

Deloitte. 2010. “Canadian Payments Landscape.” Prepared for the Task Force for the Payments
System Review.

European Commission. 2006. “Interim Report I: Payment Cards—Sector Inquiry under Article
17 Regulation 1/2003 on Retail Banking.” Available at
https://ec.europa.eu/competition/sectors/financial_services/inquiries/interim_report_1.pdf.

Evans, D. S. and R. Schmalensee. 2005. Paying with Plastic: The Digital Revolution in Buying
and Borrowing. Second edition. Cambridge: MIT Press.

Fung, B., K. P. Huynh and A. Kosse. 2017. “Acceptance and Use of Payments at the Point of
Sale in Canada.” Bank of Canada Review (Autumn): 14–26.

Fung, B., K. P. Huynh, K. Nield and A. Welte. 2018. “Merchant Acceptance of Cash and Credit
Cards at the Point of Sale.” Journal of Payments Strategy & Systems 12 (2): 150–165.

Hayashi, F., E. Cuddy and J. Hanson. 2014. “Credit and Debit Card Interchange Fees in Various
Countries: August 2014 Update.” Payments System Research Department, Federal Reserve
Bank of Kansas City.

Jiongo, V. D. 2017. “The Bank of Canada 2015 Retailer Survey on the Cost of Payment
Methods: Estimation of the Total Private Cost for Large Businesses.” Bank of Canada Technical
Report No. 110.

Hayashi, F. and J. L. Maniff. 2019. “Public Authority Involvement in Payment Card Markets:
Various Countries. August 2019 Update.” Payments System Research Department, Federal
Reserve Bank of Kansas City.

Henry, C. S., K. P. Huynh and A. Welte. 2018. “2017 Methods-of-Payment Survey Report.”
Bank of Canada Staff Discussion Paper No. 2018-17.
Page 15

Ho, C.-Y., L. L. Xu and D. Zhang. 2019. “Acquirer-Merchant Bargaining in the Payment Card
Industry.” Working paper.

Huynh, K. P., G. Nicholls and O. Shcherbakov. 2019. “Explaining the Interplay Between
Merchant Acceptance and Consumer Adoption in Two-Sided Markets for Payment Methods.”
Bank of Canada Staff Working Paper No. 2019-32.

Katz, M. 2001. “Reform of Credit Card Schemes in Australia II.” Report commissioned by the
Reserve Bank of Australia.

Kjos, A. 2007. “The Merchant-Acquiring Side of the Payment Card Industry: Structure,
Operations, and Challenges.” Payment Cards Center discussion paper. Federal Reserve Bank
of Philadelphia.

Kosse, A., H. Chen, M.-H. Felt, V. D. Jiongo, K. Nield and A. Welte. 2017. “The Costs of Point-
of-Sale Payments in Canada.” Bank of Canada Staff Discussion Paper No. 2017-4.

Lambrecht, A., K. Seim, N. Vilcassim, A. Cheema, Y. Chen, G. S. Crawford, K. Hosanagar, R.
Iyengar, O. Koenigsberg, R. Lee, E. J. Miravete, and O. Sahin. 2012. “Price Discrimination in
Service Industries.” Marketing Letters 23 (2): 423–438.

The Nilson Report. 2013–2019. Issues 1013,1029,1036, 1049,1059, 1065, 1071,1073,1082,
1087, 1094, 1095, 1105,1110,1116, 1117, 1127,1132, 1139, 1149, 1153, 1159 and 1161.

Rochet, J.-C. and J. Tirole. 2002. “Cooperation among Competitors: Some Economics of
Payment Card Associations.” RAND Journal of Economics 33 (4): 549–570.

Tirole, J. 1988. The Theory of Industrial Organization. Cambridge: MIT Press.

Tirole, J. 2011. “Payment card regulation and the use of economic analysis in antitrust.”
Competition Policy International 7 (1): 136–158.

Van Duynhoven, J. 2010. “Witness Statement of Jeff Van Duynhoven.” Available at
https://decisions.ct-tc.gc.ca/ct-tc/cdo/en/item/463437/index.do (accessed April 29, 2020).
You can also read