Bay County Retirement Plans - VEBA Trust

Page created by Robert Hopkins
 
CONTINUE READING
Bay County Retirement Plans - VEBA Trust
Bay County Retirement Plans – VEBA Trust
Dimensional Fund Advisors US Small Cap Portfolio

March 12, 2019
Graham Dorland, CFA, CAIA – Regional Director

This information is provided for registered investment advisors and institutional investors and is not intended for public use.
Dimensional Fund Advisors LP is an investment advisor registered with the Securities and Exchange Commission.
Consider the investment objectives, risks, and charges and expenses of the Dimensional funds carefully before investing. For this and other information about the
Dimensional funds, please read the prospectus carefully before investing. Prospectuses are available by calling Dimensional Fund Advisors collect at (512) 306-7400
or at us.dimensional.com/prospectus.
Dimensional funds are distributed by DFA Securities LLC.

                                                                                                                                                                      #17625-1011
Bay County Retirement Plans - VEBA Trust
Dimensional at a Glance
As of December 31, 2018

                                         37                                      $517B                                          1,300+                                                   One
                                      Years Since                                Global Assets                                  Employees Globally                                         Investment
                                       Founding                                Under Management                                   in 13 Offices                                            Philosophy

Assets in US dollars.
“Dimensional” refers to the Dimensional separate but affiliated entities generally, rather than to one particular entity. These entities are Dimensional Fund Advisors LP, Dimensional Fund Advisors Ltd., DFA Australia Limited, Dimensional Fund
Advisors Canada ULC, Dimensional Fund Advisors Pte. Ltd., Dimensional Japan Ltd., and Dimensional Hong Kong Limited. Dimensional Hong Kong Limited is licensed by the Securities and Futures Commission to conduct Type 1 (dealing in
securities) regulated activities only and does not provide asset management services.                                                                                                                                                                  2
                                                                                                                                                                                                                                                     #67118-1118
Bay County Retirement Plans - VEBA Trust
Why Dimensional

   Client Experience                Philosophy

                        A BETTER
                       INVESTMENT
                       EXPERIENCE

      Body of Work                  Implementation

                                                       3
                                                     #67118-1118
Bay County Retirement Plans - VEBA Trust
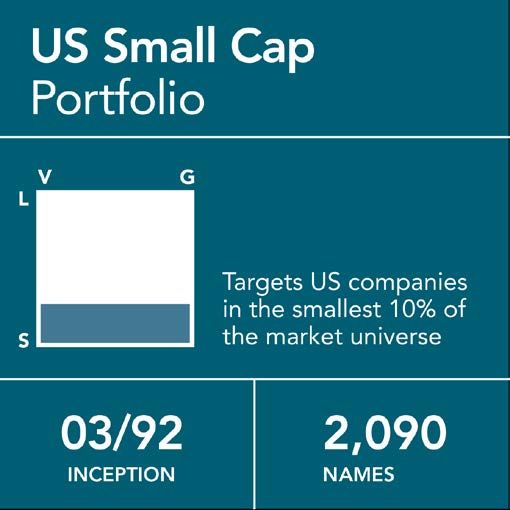
The Power of Markets

                      All                                                                             $407.8B
                      Available                                                                        World Equity
                                                                                                                                                                                  PRIC ES
                                                                                                       Trading Volume
                      Information
                                                                                                       (2017 Daily Average)

                                                                                     “Markets work the way you’d hope they would.“
                                                                                         David Booth
                                                                                         Executive Chairman and Founder

In US dollars. Source: Dimensional, using data from Bloomberg LP. Includes primary and secondary exchange trading volume globally for equities. ETFs and funds are excluded. Daily averages were computed by calculating the trading volume
of each stock daily as the closing price multiplied by shares traded that day. All such trading volume is summed up and divided by 252 as an approximate number of annual trading days.                                                         4
                                                                                                                                                                                                                                              #67118-1118
Bay County Retirement Plans - VEBA Trust
A Heritage of Leading Research
The bar for research at Dimensional has been set by the best in the field

 Eugene                                 Kenneth                                Robert                                 Robert                                             Merton                  Myron
 Fama                                   French                                 Merton                                 Novy-Marx                                          Miller                  Scholes

 University of Chicago                  Dartmouth College                      MIT                                    University of Rochester                            University of Chicago   Stanford University
 Dimensional Director and               Consultant, Dimensional,1              Director, Dimensional                  Consultant,                                        Independent Director,   Independent Director,
 Consultant, Dimensional,1              1986–present                           US Mutual Funds,                       Dimensional,1                                      Dimensional US Mutual   Dimensional US Mutual
 1981–present                                                                  2003–2009                              2014–present                                       Funds, 1981–2000        Funds, 1981–present
                                        Co-Chair of the Investment
                                        Research Committee,                    Resident Scientist,
                                        Dimensional,1                          Dimensional Holdings Inc.,
                                        2006–present                           2010–present
                                        Dimensional Director,
                                        2006–present

                        “At Dimensional, we don’t jump on every new idea that comes along.
                         We’re looking for what will stand up over a long period of time.”
                            Eugene Fama
                            Nobel laureate, 2013

1. Dimensional Fund Advisors LP.
"Dimensional Directors" refers to the Board of Directors of the general partner of Dimensional Fund Advisors LP, an affiliate of Dimensional Fund Advisors Canada ULC.                                                     5
                                                                                                                                                                                                                         #67118-1118
A Different View of Markets

               TRADITIONAL INDEXERS
  Track
               Focus on matching the returns
  the Market
               of an index, restricting which
               securities to hold and when        “You don’t have to outguess
               to trade.                           the market to beat it.”
                                                   David Booth

                                                                 DIMENSIONAL
                                                    Start with
                                                                 Draws insights from empirical
                                                    the Market
                                                                 research to emphasize
                                                                 areas of the market with
                                                                 higher expected returns.
               STOCK PICKERS AND
  Outguess     QUANTITATIVE MANAGERS
  the Market
                                                                 Adds value through
               Rely on predictions and/or                        implementation that has been
               backtested simulations to                         tested, repeated, and refined
               find mispricing or time markets.                  for more than three decades.

                                                                                                   6
                                                                                                 #67118-1118
Implementation Requires Expertise
Taking knowledge and information and implementing it in a real test, not in a backtest, is what counts

                                                                                              Global Research Team

DAVID BOOTH                    GERARD K. O’REILLY, PhD        DAVE BUTLER                     MARLENA LEE, PhD         SAVINA RIZOVA, PhD    PETE DILLARD
Executive Chairman             Co-Chief Executive Officer     Co-Chief Executive Officer      Co-Head of Research      Co-Head of Research   Chief Data Officer and Head of
and Founder                    and Chief Investment Officer                                                                                  Investment Analytics and Data

Global Portfolio Management and Trading Team
                                                                                             84                                              146
                                                                                                                                           Portfolio
                                                                                             Research
                                                                                                                                         Management
                                                                                           Professionals

                                                                                                                                                                25
                                                                                                                                         Professionals

                                                                                                               19                                             Trading
                                                                                                                    PhDs
                                                                                                                                                            Professionals

JOSEPH CHI                 JED FOGDALL              RYAN WILEY
Co-Head of Global          Co-Head of Global        Head of
Portfolio Management       Portfolio Management     Global Equity Trading

As of December 31, 2018.                                                                                                                                                        7
                                                                                                                                                                              #67118-1118
Dimensional Investing

      “It’s 10% having a good idea and 90% implementing that idea and
       making it work. Dimensional has been making it work for decades.”
       Robert Merton
       Nobel laureate, 1997

                                                                             8
                                                                           #67118-1118
Philosophy & Process— US Small Cap Portfolio
Designing Robust Portfolios

           GOALS                                                                                                                            CONSIDERATIONS

                                                                                                                                            • Sorting variables
               Increase Expected Returns                                                                                                    • Breakpoint definitions
                                                                                                                                            • Integration of premiums
                                                                                                                                            • Weighting schema
               Manage Risks                                                                                                                 • Degree of emphasis on premiums
                                                                                                                                            • Diversification across names,
                                                                                                                                              sectors, and countries
               Control Costs                                                                                                                • Level of turnover
                                                                                                                                            • Liquidity and expected trading costs

Design considerations listed are representative examples of decisions made in designing portfolios and are not intended to be exhaustive.                                              10
                                                                                                                                                                                     #67315_0219
Drivers of Long-Term Asset Allocation

                                                                                                                                                                 To be considered a
       Company                                                   Relative                                                    Profitability2                      dimension of expected
       Size                                                                                                                                                      return, a premium must be:
                                                                 Price1
                                                                                                                                                                 • Sensible
       S M AL L C AP P RE MI UM                                   VAL UE P RE MI UM                                          P RO F I T ABI L I T Y P RE MI UM
                                                                                                                                                                 • Persistent
       small vs. large                                            value vs. growth                                           high vs. low profitability
       companies                                                  companies                                                  companies
                                                                                                                                                                 • Pervasive

                                                                                                                                                                 • Robust

                                                                                                                                                                 • Cost-effective

1. Relative price as measured by the price-to-book ratio; value stocks are those with lower price-to-book ratios.
2. Profitability is a measure of current profitability, based on information from individual companies’ income statements.                                                                      11
                                                                                                                                                                                              #67315_0219
Dimensions of Expected Returns
Illustrative index performance: Annualized compound returns (%) in US dollars

                                                 US STOCKS                                      DEVELOPED EX US MARKETS STOCKS                                            EMERGING MARKETS STOCKS

                                           SMALL                LARGE                                           SMALL                LARGE                                          SMALL                LARGE

                              1928–2017                                                       1970–2017                                                            1989–2017

                                           12.16                                                                14.79                                                               12.23
                                                                 9.87                                                                  9.62                                                              10.47

Size
                                        Dimensional           S&P 500                                        Dimensional           MSCI World                                     Dimensional           MSCI
                                        US Small              Index                                          Intl. Small           ex USA Index                                   Emerging              Emerging
                                        Cap Index                                                            Cap Index             (gross div.)                                   Markets Small         Markets Index
                                                                                                                                                                                  Cap Index             (gross div.)

                                             LOW                 HIGH                                            LOW                  HIGH                                           LOW                  HIGH

                              1928–2017                                                       1975–2017                                                            1989–2017
                                           12.75                                                                13.96                                                               13.60
                                                                 9.21                                                                  8.81                                                              10.19

Relative
Price                                   Fama/French           Fama/French                                     Fama/French           Fama/French                                    Fama/French          Fama/French
                                        US Value              US Growth                                       International         International                                  Emerging             Emerging
                                        Research              Research                                        Value Index           Growth Index                                   Markets Value        Markets Growth
                                        Index                 Index                                                                                                                Index                Index

                                            HIGH                 LOW                                             HIGH                  LOW                                           HIGH                 LOW

                              1964–2017                                                       1990–2017                                                            1996–2017
                                           12.46
                                                                 8.35                                                                                                                9.35
                                                                                                                 6.95
                                                                                                                                                                                                          4.00
Profitability                                                                                                                          2.59

                                        Dimensional           Dimensional                                    Dimensional           Dimensional                                    Dimensional            Dimensional
                                        US High               US Low                                         International High    International Low                              Emerging               Emerging
                                        Profitability Index   Profitability Index                            Profitability Index   Profitability Index                            Markets High           Markets Low
                                                                                                                                                                                  Profitability Index    Profitability Index

Profitability is measured as operating income before depreciation and amortization minus interest expense scaled by book.
Indices are not available for direct investment. Past performance is not a guarantee of future results. Index returns are not representative of actual portfolios and do not reflect costs and fees associated with an actual
investment. Actual returns may be lower. See “Index Descriptions” in the appendix for descriptions of Dimensional and Fama/French index data. Eugene Fama and Ken French are members of the Board of Directors of the general
partner of, and provide consulting services to, Dimensional Fund Advisors LP. S&P data copyright 2019 S&P Dow Jones Indices LLC, a division of S&P Global. All rights reserved. MSCI data © MSCI 2019, all rights reserved.       12
                                                                                                                                                                                                                                #67315_0219
US Small Cap Portfolio
Using an integrated approach to add value across all aspects of the investment process

                                                                                 • Structured based on systematic
                                                                                   expected premiums:

                                                                                    – Market

                                                                                    – Company size

                                                                                    – Relative price (value)

                                                                                    – Profitability

                                                                                 • Offers broad sector and
                                                                                   security diversification

                                                                                 • Balances competing premiums and
                                                                                   manages implementation costs by
                                                                                   using a disciplined and patient
                                                                                   trading strategy

Names as of December 31, 2018. Holdings are subject to change.                                                       13
                                                                                                                     #17868-1011
Portfolio Construction:
Security Selection
US Small Cap Portfolio

                     RELATIVE PRICE                                                                                                                              • Focus on small cap securities
               LOW                                    HIGH

                                                                                                                                                                 • Exclude companies with lowest
       LARGE

                                                                                                                                                                   profitability and highest relative
                                                                                                                                                                   price
SIZE

                                                               Stocks
                                                               below 10%
                                                                                    PROFITABILITY1

                                                               market                                HIGH
       SMALL

                                                               cap

                                                                                                     LOW
                                                                                                            LOW                        HIGH
                                                                                                                   RELATIVE PRICE

                                                Weighted Average                         Aggregate                     Weighted Average
As of 12/31/2018                               Market Cap (millions)                 Price-to-Book                           Profitability
US Small Cap Portfolio                                           $2,001                                     1.62                        0.26

Russell 2000 Index                                               $2,042                                     1.79                        0.17

1. Profitability is measured as operating income before depreciation and amortization minus interest expense scaled by book.
Holdings are subject to change. Frank Russell Company is the source and owner of the trademarks, service marks, and copyrights related to the Russell Indexes.                                            14
                                                                                                                                                                                                        #17869-1011
Daily Order Generation
Many inputs inform which stocks we want to hold each day

             Potential                                                 Balance Tradeoffs Between                                                          Meaningful Order
             Order Candidates                                          Competing Premiums and Costs                                                       Candidates

             Long-Term                                                  Current                                    Short-Term          Intra-day          Traders receive
             Eligibility                                                Holdings                                   Considerations      Costs              order candidates
             • Company size                                             • Size, value,                             • Momentum          • Liquidity        that should
                                                                          and profitability                                                               improve expected
             • Relative price                                                                                      • Securities        • Ticket charges   returns and allow
                                                                          positioning
                                                                                                                     lending
             • Profitability                                                                                                           • Stamp duties     for flexibility to
                                                                        • Security, sector,
                                                                                                                   • Corporate                            help reduce costs.
             • Portfolio-specific                                         and country                                                  • Minimum
                                                                                                                     actions
               guidelines                                                 weights                                                        trade size
                                                                                                                   • Index
                                                                        • Cash balance
                                                                                                                     reconstitutions

Listed inputs to the order generation process are representative examples and are not intended to be exhaustive.                                                                 15
                                                                                                                                                                               #67315_0219
Balancing Differences Between
Long- and Short-Term Expected Returns

Stock A                                                                            Stock B
• Migrates from growth to value                                                    • Migrates from growth to value
• Down momentum and expensive to borrow

                                             EXPECTED                                                                    EXPECTED
                                             PREMIUMS                                                                    PREMIUMS

                                        Short-term Long-term                                                        Short-term Long-term

                                                                                  RELATIVE PRICE
RELATIVE PRICE

                                                                   Value                                                                   Value

                                                                   Down
                                                                   Momentum
                                  A                                                                         B

                                                                   Expensive to
                                                                   Borrow

                                          Delay          Order                                                        Order
                                           Buy         Candidate                                                     Candidate

                 Past         Current             Future                                           Past   Current            Future

For illustrative purposes only.                                                                                                                      16
                                                                                                                                                   #67315_0219
Performance
As of February 28, 2019

                                                                                                                                                                                                                               Since 4/92
                                                                                                                                                                                                                                 Portfolio
                                                                                                     Year to                                                                                                                      1st Full
Annualized Returns1 (%)                                                                                Date                    1 Year                  3 Years                 5 Years                10 Years                     Month

   US SMALL CAP PORTFOLIO                                                                            15.93                      3.18                  13.60                      6.92                   17.94                      10.47
   Russell 2000 Index                                                                                17.03                      5.58                  16.67                      7.36                   16.60                        9.39

                                        Calendar Year                                                               US SMALL CAP                                                       Russell 2000
                                        Returns (%)                                                                   PORTFOLIO                                                               Index

                                        2009                                                                                     36.34                                                         27.17
                                        2010                                                                                     30.70                                                         26.85
                                        2011                                                                                      -3.15                                                        -4.18
                                        2012                                                                                     18.39                                                         16.35
                                        2013                                                                                     42.21                                                         38.82
                                        2014                                                                                       4.44                                                          4.89
                                        2015                                                                                      -3.29                                                        -4.41
                                        2016                                                                                     23.53                                                         21.31
                                        2017                                                                                     11.52                                                         14.65
                                        2018                                                                                   -13.13                                                        -11.01

Performance for the portfolio is reported net of all advisory fees and includes reinvestment of dividends and other earnings.
Performance data shown represents past performance and is no guarantee of future results. Current performance may be higher or lower than the performance shown. The
investment return and principal value of an investment will fluctuate so that an investor’s shares, when redeemed, may be worth more or less than their original cost. To obtain the
most current month-end performance data, visit us.dimensional.com.
1. Returns for periods shorter than one year are not annualized.
Frank Russell Company is the source and owner of the trademarks, service marks, and copyrights related to the Russell Indexes. Indices are not available for direct investment. See “Appendix: Standardized Performance Data and Disclosures”
to learn how to obtain complete information on performance, investment objectives, risks, advisory fees, and expenses of Dimensional’s funds.                                                                                                     17
                                                                                                                                                                                                                                                #17595-1011
Fees

                                                                                                                                                        Total (Gross)
                                                                                                Net Expense                                                 Expense                                    Management
                                                                                                  Ratio1 (%)                                              Ratio1 (%)                                       Fee1 (%)

US Small Cap Portfolio                                                                                              0.37                                                  0.37                                             0.35

1. Fee and expense information as of the prospectus date 02/28/19.
Certain Portfolios have entered into fee waiver and/or expense assumption arrangements with the Advisor. In these cases, the Advisor has contractually agreed, under certain circumstances, to waive certain fees and/or assume certain
expenses of the Portfolio. Unless otherwise stated in the prospectus, the Advisor may amend or discontinue these arrangements at any time, one year from the date of the prospectus. The net expense ratio reflects the total annual fund
operating expenses of the Portfolio after taking into account any such fee waiver and/or expense assumption arrangements. Please read the Portfolio's prospectus for details and more information.                                            18
                                                                                                                                                                                                                                            #17868-1011
Evaluating Dimensional Across Strategies
Flagship equity funds, relative 15-year performance as of December 31, 2018

                          Dimensional                  Average Index                     Funds No Longer                        Proportion of Surviving Funds                           Proportion of Surviving Funds
                          Placement                    Fund Placement                    in Existence                           Placing Behind Dimensional                              Placing Ahead of Dimensional
                                                       (where rank exists)1

Category
Placement
      Higher

      Lower

   Funds
   No Longer
   in Existence

   Dimensional        US Large         US Large          US Micro         US Small         US Small        International International International Large Cap                    Emerging         Emerging         Emerging         Real Estate
   Fund Name          Cap Value        Company             Cap              Cap            Cap Value         Small Cap       Small         Value     International                 Markets          Markets          Markets          Securities
                      Portfolio I      Portfolio         Portfolio I      Portfolio I      Portfolio I         Value       Company       Portfolio I   Portfolio I                Portfolio I      Small Cap          Value          Portfolio I
                                                                                                             Portfolio I   Portfolio I                                                             Portfolio I      Portfolio I
 Dimensional
  Placement/              47/             100/              85/               61/              41/               2/               9/               11/              76/               21/               3/               7/               23/
   Number of             1,008            1,408             440               440              248               44               30               170              452               186              186              186               176
Funds at Start

1. Average Index Fund Placement is provided where index fund(s) with a 15-year Morningstar Total Return Absolute Rank exist in the category as of December 31, 2018.
Dimensional placement is the Morningstar 15-Year Total Return Absolute Category Rank sourced from Morningstar. Number of funds starting the period is the number of share classes, within the respective Morningstar Category, with return
histories as of the start of the 15-year period ending December 31, 2018. The Morningstar category data is provided at the individual fund share class level. Multiple share classes of a fund typically have a common portfolio but impose different
expense structures. Proportion of Surviving Funds Placing Ahead (Behind) of Dimensional is the proportion of ranked funds with a higher (lower) Morningstar 15-Year Total Return Absolute Category Rank than the corresponding Dimensional
fund. The Average Index Fund Placement is the average, as determined by Dimensional, of the Morningstar 15-Year Total Return Absolute Category Rank for index funds within the respective Morningstar category as of December 31, 2018. All
funds are US-domiciled. Funds may have experienced negative performance over the time period. Past performance is no guarantee of future results. Visit us.dimensional.com for standardized performance information for
Dimensional’s funds. See “Relative Performance for Standardized Periods” in the appendix for further information.                                                                                                                                         19
                                                                                                                                                                                                                                                        #67118-1118
Appendix
Characteristics
As of December 31, 2018

                                                                                                                                     US SMALL CAP                 Russell 2000
                                                                                                                                       PORTFOLIO                         Index
             MARKET CHARACTERISTICS

             Total Value of Eligible Universe (millions)                                                                               $1,755,122                $1,777,119
             Number of Holdings                                                                                                                  2,090                2,032
             SIZE CHARACTERISTICS

             Wtd. Average Market Cap (millions)                                                                                                $2,001                $2,042
             Median Market Cap (millions)                                                                                                          $641                $711
             VALUATION CHARACTERISTICS

             Aggregate Price-to-Book                                                                                                                1.62                1.79
             Wtd. Average Dividend-to-Price                                                                                                     1.41%                 1.58%
             PROFITABILITY CHARACTERISTICS

             Wtd. Average Profitability1                                                                                                            0.26                0.17

1. Operating income before depreciation and amortization minus interest expense scaled by book.
Holdings are subject to change. Frank Russell Company is the source and owner of the trademarks, service marks, and copyrights related to the Russell Indexes.                   21
                                                                                                                                                                                 #17595-1011
Sector Allocations
As of December 31, 2018

                                                                                                                          US SMALL CAP                                                                Russell 2000
                                                                                                                            PORTFOLIO                                                                        Index

                        PORTFOLIO WEIGHTS (%)

                        Financials                                                                                                       20.1                                                                   17.1
                        Industrials                                                                                                      19.6                                                                   14.8
                        Consumer Discretionary                                                                                           14.9                                                                   12.2
                        Information Technology                                                                                           13.4                                                                   14.7
                        Health Care                                                                                                         9.1                                                                 15.5
                        Energy                                                                                                              5.0                                                                   3.5
                        Materials                                                                                                           4.7                                                                   3.7
                        Consumer Staples                                                                                                    4.5                                                                   2.9
                        Communication Services                                                                                              4.0                                                                   3.3
                        Utilities                                                                                                           3.9                                                                   3.8
                        Real Estate                                                                                                         0.6                                                                   0.6
                        REITs                                                                                                               0.0                                                                   7.8

Numbers may not total 100% due to rounding. Frank Russell Company is the source and owner of the trademarks, service marks, and copyrights related to the Russell Indexes. Real Estate Investment Trusts (REITs) are shown as a separate
category to illustrate their exclusion from certain funds. REITs are classified according to GICS Industry code. GICS was developed by and is the exclusive property of MSCI and S&P Dow Jones Indices LLC, a division of S&P Global.        22
                                                                                                                                                                                                                                           #17600-1011
Dimensional Brokerage Commissions Relative to Peers
ITG Post-Trade AnalyticsTM – Peer Trade Cost Analysis, One Year Ending December 31, 2017

      Dimensional
                                                                                                                                                                      • Trading costs negatively
                                                                                                                                                                        impact returns
                                                            25%                      50%                      75%
                                                                                                                                                                      • Lower commissions can contribute
United States
                                                                                                                                                                        to lower total trading costs
                                                                                  2.3 cps
                                                                                                                                                                      • Dimensional regularly monitors
                                                                                                                                                                        commissions to help keep rates low

Developed ex US1
                                                                                  10 bps

Emerging Markets2

                                                                                  14 bps

Past performance is not a guarantee of future results. Date range reflects most recent data available.
Ranking provided by ITG. Ranking from 1-100% where 1 is lowest commission rate and 100 is highest commission rate. United States rank on commission in cents/share. Non-US rank on % of traded value.
The data provided on this slide is copyrighted by Investment Technology Group, Inc. or its affiliates and may not be copied, displayed, or transmitted in any form without prior written permission. Many factors influence transaction cost including
order size, volatility, and spread. ITG’s peer universe includes a variety of firm types trading orders of all sizes in various market conditions. ITG’s Peer commission numbers represent a blend of both execution-only and fully bundled rates.
US Commissions are typically paid on a cents per share (cps) basis. Non-US commissions are typically paid as a percentage of gross traded value and quoted in basis points (bps) or 1/100 of a percent.                                                    23
                                                                                                                                                                                                                                                         #67315_0219
Dimensional Implicit Costs Relative to Peers
ITG Post-Trade AnalyticsTM – Peer Trade Cost Analysis, One Year Ending December 31, 2017

      Dimensional
                                                                                                                                                                      • Trading costs negatively
                                                                                                                                                                        impact returns
                                                            25%                      50%                      75%
                                                                                                                                                                      • Lower implicit costs contribute
United States
                                                                                                                                                                        to lower total trading costs
                                                                                  23 bps
                                                                                                                                                                      • Dimensional uses both third
                                                                                                                                                                        party and internally developed
                                                                                                                                                                        benchmarks to evaluate the
Developed ex US1                                                                                                                                                        implicit costs of trading.
                                                                                  28 bps

Emerging Markets2

                                                                                  38 bps

Past performance is not a guarantee of future results. Date range reflects most recent data available.
Ranking provided by ITG. Ranking from 1-100% where 1 is lowest implicit cost and 100 is highest implicit cost.
The data provided on this slide is copyrighted by Investment Technology Group, Inc. or its affiliates and may not be copied, displayed, or transmitted in any form without prior written permission. Many factors influence transaction cost including
order size, volatility, and spread. ITG’s peer universe includes a variety of firm types trading orders of all sizes in various market conditions. ITG’s Peer commission numbers represent a blend of both execution-only and fully bundled rates.         24
                                                                                                                                                                                                                                                         #67315_0219
Partial List of Clients

Corporate                                          Nonprofit Organizations                                           Public                                                      Taft-Hartley
Anthem, Inc.                                      Baptist Foundation of Alabama                                     City and County of Kalamazoo                                 Bakery & Confectionery Union and
AT&T Inc.                                         Gonzaga University                                                City of Baton Rouge                                           Industry International Pension Fund
Boeing Corporation                                Misericordia Home Endowment                                       County of Los Angeles Deferred                               Local Union #226
Kellogg Company                                   National Telecommunications                                           Compensation                                             National Electrical Benefit Fund
Merck                                               Cooperative Association                                         Florida State Board of Administration                        National Retirement Fund
Microsoft Corporation                             Public Policy Institute of California                             Illinois Municipal Retirement Fund                           Union Electrical Industry Master Trust
PepsiCo, Inc.                                     Surdna Foundation                                                 Los Angeles Department of
PPG Industries, Inc.                              Toledo Community Foundation                                           Water & Power System
TimkenSteel Corporation                           University of Miami                                               Los Angeles Fire and Police Pensions
Tribune Media Company                             Western Michigan University                                       Maryland State Retirement Agency
Verizon Communications, Inc.                        Foundation                                                      Mississippi Public Employees
Yum! Brands, Inc.                                                                                                       Retirement System
                                                                                                                    Municipal Fire & Police
                                                                                                                        Retirement System of Iowa
                                                                                                                    Nebraska Investment Council
                                                                                                                    Nova Scotia Health Employees'
                                                                                                                        Pension Plan
                                                                                                                    Teachers' Retirement Allowances Fund
                                                                                                                    Utah State Retirement Systems

As of January 9, 2019.
Clients in bold have been clients with Dimensional for 10 or more years. Some entities listed do not engage Dimensional directly, but invest in a commingled vehicle advised by Dimensional. This list is solely a partial list of clients of the
Dimensional group of companies and is generally representative of Dimensional’s institutional client base. Clients have given consent to be included and were not chosen based on performance-based criteria. This list should not be construed
as an expression of any client's experience with Dimensional, or a suggestion that one client's experience is in any way indicative of another client's future experience with Dimensional. Inclusion of a client’s name on the list should not be taken
as an indication that the client approves or disapproves of Dimensional or the advisory services provided to either the client and/or the commingled vehicle in which the client may be invested.                                                            25
                                                                                                                                                                                                                                                           #66075-1018
Relative Performance for Standardized Periods
Funds with more than 15 years of history as of December 31, 2018

                                                                                                          Prior Year                            Prior 5 Years                          Prior 10 Years                          Prior 15 Years
                                                                                            Dimensional                   Average   Dimensional                   Average   Dimensional                   Average   Dimensional                   Average
                                                                                             Placement/ Number of           Index    Placement/ Number of           Index    Placement/ Number of           Index    Placement/ Number of           Index
                                                             Morningstar Category                 Funds         Ranked       Fund         Funds        Ranked        Fund         Funds        Ranked        Fund         Funds        Ranked        Fund
Fund Name                                          Ticker    (US Fund)                          at Start¹ Investments² Placement³       at Start¹ Investments² Placement³       at Start¹ Investments² Placement³       at Start¹ Investments² Placement³
US Large Cap Value Portfolio I                     DFLVX     Large Value                   1,019/1,309         1,242         503     329/1,207            937         280     31/1,290            686         201     47/1,008            432         175
US Large Company Portfolio                         DFUSX     Large Blend                     316/1,484         1,398         472      81/1,455         1,069         250     139/1,663           804        235      100/1,408           528        194
US Micro Cap Portfolio I                           DFSCX     Small Blend                       305/827           767         207       176/701           540         157        66/662           392        150         85/440           223          74
US Small Cap Portfolio I                           DFSTX     Small Blend                       436/827           767         207       214/701           540         157        46/662           392        150         61/440           223          74
US Small Cap Value Portfolio I                     DFSVX     Small Value                       186/432           417         137       184/394           327         133        55/389           228          95        41/248           130          50
US Targeted Value Portfolio I                      DFFVX     Small Value                        221/432           417        137        150/394          327         133         60/389          228          95         26/248          130          50
Large Cap International Portfolio I                DFALX     Foreign Large Blend               253/788           737         215       163/689           506         174       141/688           379        170         76/452           201        103
International Value Portfolio I                    DFIVX     Foreign Large Value               205/336           313          72        67/328           225          73        28/312           149          36        11/170            76          51
International Small Cap Value Portfolio I          DISVX     Foreign Small/Mid Value              53/70           61          18         17/53            43          15         11/58            22          11           2/44            9              -
International Small Company Portfolio I            DFISX     Foreign Small/Mid Blend            41/115           110          28         20/84            67          27         28/69            50          23           9/30           22              -
Asia Pacific Small Company Portfolio I             DFRSX     Pacific/Asia ex-Japan Stk            47/88            83         28         58/108            59         33          13/63           29          18          13/47           21          11
Continental Small Company Portfolio I              DFCSX     Europe Stock                       105/133           119          42         4/108            70         28          5/100           52          32          3/103           43          30
Japanese Small Company Portfolio I                 DFJSX     Japan Stock                          40/53            50          22          7/37            25         13           8/54           14          10           3/38           10              8
Enhanced US Large Co. Portfolio I                  DFELX     Large Blend                      602/1,484         1,398        472      142/1,455         1,069        250       88/1,663          804         235      131/1,408          528         194
Emerging Markets Portfolio I                       DFEMX     Diversified Emerging Mkts         178/866           833         271       113/726           531         267        77/375           237        152         21/186           115          56
Emerging Markets Small Cap Portfolio I             DEMSX     Diversified Emerging Mkts         515/866           833         271        17/726           531         267         5/375           237        152          3/186           115          56
Emerging Markets Value Portfolio I                 DFEVX     Diversified Emerging Mkts          81/866           833         271       106/726           531         267        73/375           237        152          7/186           115          56
Tax-Managed International Value Portfolio          DTMIX     Foreign Large Value                196/336           313          72        82/328          225          73         36/312          149          36          9/170           76          51
Tax-Managed US Equity Portfolio                    DTMEX     Large Blend                      586/1,484         1,398        472      281/1,455         1,069        250      217/1,663          804         235      106/1,408          528         194
Tax-Managed US Marketwide Value Portfolio          DTMMX     Large Value                      875/1,309         1,242        503      375/1,207          937         280       25/1,290          686         201       33/1,008          432         175
Tax-Managed US Small Cap Portfolio                 DFTSX     Small Blend                        434/827           767        207        213/701          540         157        110/662          392         150        109/440          223          74
Tax-Managed US Targeted Value Portfolio            DTMVX     Small Value                        235/432           417        137        110/394          327         133         47/389          228          95         53/248          130          50
Real Estate Securities Portfolio I                 DFREX     Real Estate                        15/275           249          83        14/254           191          68        16/229           138          53        23/176            94          44
One-Year Fixed Income Portfolio I                  DFIHX     Ultrashort Bond                     51/191          186         101         83/159          122          67         44/111           59          57         22/102           45              -
Short-Term Government Portfolio I                  DFFGX     Short Government                    43/108           104         28         23/127            93         37         19/128           68          36         11/146           64          38
Short Term Municipal Bond I                        DFSMX     Muni National Short                106/208           202          62       106/198          162         108         82/163          108          71         61/147           79              -
Two-Year Global Fixed Income Portfolio I           DFGFX     World Bond                          30/324          308         138        140/341          244         146        128/214          138         100         78/137           82              -
Five-Year Global Fixed Income Portfolio I          DFGBX     World Bond                          35/324          308         138         60/341          244         146         94/214          138         100         57/137           82              -
Intermediate Government Fixed Income Portfolio I   DFIGX     Intermediate Government             27/259           235          51        27/273          194          67         52/291          150         111         11/284          116          63

Flagship equity funds are shown in bold.
1. Dimensional placement is the Morningstar 1-, 5-, 10-, or 15- year Total Return Absolute Category Rank sourced from Morningstar. Number of funds starting the period is the number of share classes, within the respective Morningstar Category,
with return histories as of the start of the 1-, 5-, 10-, or 15-year period ending in December 31, 2018.
2. Number of Ranked Investments is sourced from Morningstar for each category and is the number of funds that were ranked as of the end of the 1-, 5, 10-, or 15-year period ending December 31, 2018.
3. Average Index Fund Placement is provided where index fund(s) with a 1-, 5-, 10-, or 15-year Morningstar Total Return Absolute Rank exist in the category as of December 31, 2018. The Average Index Fund Rank is the average, as determined
by Dimensional, of the Morningstar 1-, 5-, 10-, or 15-Year Total Return Absolute Category Rank for index funds within the respective Morningstar category as of December 31, 2018.
The Morningstar category data is provided at the individual fund share class level. Multiple share classes of a fund typically have a common portfolio but impose different expense structures. The table includes Dimensional Funds ranked by
Morningstar and available on or before 15 years prior to December 31, 2018. Dimensional Funds currently available but previously restricted to clients of LWI Financial Inc. are excluded due to different historical fee structures. All funds are US-
domiciled. Funds may have experienced negative performance over the time period. Past performance is no guarantee of future results. Visit us.dimensional.com for standardized performance information for Dimensional’s funds.                               26
                                                                                                                                                                                                                                                      #59043-0118
Standardized Performance Data and Disclosures
Performance data shown represents past performance. Past                  Risks include loss of principal and fluctuating value. Investment value
performance is no guarantee of future results, and current                will fluctuate, and shares, when redeemed, may be worth more or less
performance may be higher or lower than the performance shown.            than original cost.
The investment return and principal value of an investment will
fluctuate so that an investor’s shares, when redeemed, may be worth       Small and micro cap securities are subject to greater volatility than
more or less than their original cost. To obtain performance data for     those in other asset categories.
Dimensional portfolios current to the most recent month-end, access
our website at us.dimensional.com.                                        International and emerging markets investing involves special risks,
                                                                          such as currency fluctuation and political instability. Investing in
Consider the investment objectives, risks, and charges and expenses       emerging markets may accentuate these risks.
of the Dimensional funds carefully before investing. For this and other
information about the Dimensional funds, please read the prospectus       Sector-specific investments focus on a specific segment of the market,
carefully before investing. Prospectuses are available by calling         which can increase investment risks.
Dimensional Fund Advisors collect at (512) 306-7400 or at
us.dimensional.com/prospectus. Dimensional funds are distributed by       Fixed income securities are subject to increased loss of principal during
DFA Securities LLC.                                                       periods of rising interest rates. Fixed income investments are subject to
                                                                          various other risks, including changes in credit quality, liquidity,
Dimensional Fund Advisors LP is an investment advisor registered with
                                                                          prepayments, call risk, and other factors. Municipal securities are subject
the Securities and Exchange Commission.
                                                                          to the risks of adverse economic and regulatory changes in their issuing
                                                                          states.

                                                                          Real estate investment risks include changes in real estate values and
                                                                          property taxes, interest rates, cash flow of underlying real estate assets,
                                                                          supply and demand, and the management skill and creditworthiness of
                                                                          the issuer.

                                                                          Sustainability funds use environmental and social screens that may limit
                                                                          investment opportunities for the fund.

                                                                          Commodities include increased risks, such as political, economic, and
                                                                          currency instability, and may not be suitable for all investors. The
                                                                          portfolio may be more volatile than a diversified fund because the
                                                                          portfolio invests in a smaller number of issuers and commodity sectors.

                                                                          The fund prospectuses contain more information about investment
                                                                          risks.

                                                                                                                                                          27
                                                                                                                                                        #66222-1218
Standardized Performance Data and Disclosures
                                                                                  AVERAGE ANNUAL TOTAL RETURNS1 (%)                                                                         FEES AND EXPENSES2 (%)

                                                                                                                                                                               Net        Total (Gross)                           Management
                                                                                                                                 Since           Inception                 Expense            Expense        Management           Fee after Fee
                                                                  Symbol               1 Year      5 Years     10 Years      Inception               Date                     Ratio               Ratio             Fee                 Waiver

US Equity Portfolios
Enhanced US Large Company Portfolio                               DFELX                 -5.45          8.21        13.32           8.15          7/2/1996                       0.15                0.23                 0.20               0.20
US Core Equity 1 Portfolio                                        DFEOX                 -7.79          6.89        13.19           7.65         9/15/2005                       0.19                0.19                 0.17               0.17
US Core Equity 2 Portfolio                                        DFQTX                 -9.62          5.84        12.77           7.24         9/15/2005                       0.22                0.22                 0.20               0.20
US High Relative Profitability Portfolio                          DURPX                 -5.12            —             —           7.06         5/16/2017                       0.25                0.27                 0.20               0.20
US Large Cap Equity Portfolio                                     DUSQX                 -6.23          7.50            —           9.95         6/25/2013                       0.17                0.17                 0.15               0.15
US Large Cap Growth Portfolio                                     DUSLX                 -1.99          9.03            —          12.72       12/20/2012                        0.19                0.19                 0.17               0.17
US Large Cap Value Portfolio                                      DFLVX                -11.65          5.83        13.17           9.60         2/19/1993                       0.27                0.37                 0.35               0.25
US Large Company Portfolio                                        DFUSX                 -4.43          8.42        13.07           5.53         9/23/1999                       0.08                0.08                 0.06               0.06
US Micro Cap Portfolio                                            DFSCX                -11.60          4.14        13.08          11.40       12/23/1981                        0.52                0.52                 0.50               0.50
US Small Cap Growth Portfolio                                     DSCGX                -12.34          4.12            —           9.80       12/20/2012                        0.38                0.38                 0.35               0.35
US Small Cap Portfolio                                            DFSTX                -13.13          3.87        13.39           9.79         3/19/1992                       0.37                0.37                 0.35               0.35
US Small Cap Value Portfolio                                      DFSVX                -15.13          2.17        12.05          10.74          3/2/1993                       0.52                0.52                 0.50               0.50
US Targeted Value Portfolio                                       DFFVX                -15.78          2.59        11.94          10.18         2/23/2000                       0.37                0.37                 0.35               0.35
US Vector Equity Portfolio                                        DFVEX                -13.24          4.01        12.10           6.58       12/30/2005                        0.32                0.32                 0.30               0.30

1. Performance information as of 12/31/18.
2. Fee and expense information as of the prospectus dated 02/28/19.
Certain portfolios have entered into fee waiver and/or expense assumption arrangements with the advisor. In these cases, the advisor has contractually agreed, under certain circumstances, to waive certain fees and/or assume certain
expenses of the portfolio. Unless otherwise stated in the prospectus, the advisor may amend or discontinue these arrangements at any time, one year from the date of the prospectus. The net expense ratio reflects the total annual fund
operating expenses of the portfolio after taking into account any such fee waiver and/or expense assumption arrangements. Please read the portfolio's prospectus for details and more information.                                                   28
                                                                                                                                                                                                                                                   #58386-0317
Index Descriptions

Dimensional US Small Cap Index was created by Dimensional in March 2007 and is                                                     Dimensional US Low Profitability Index was created by Dimensional in January
compiled by Dimensional. It represents a market-capitalization-weighted index of                                                   2014 and represents an index consisting of US companies. It is compiled by
securities of the smallest US companies whose market capitalization falls in the                                                   Dimensional. Dimensional sorts stocks into three profitability groups from high to
lowest 8% of the total market capitalization of the eligible market. The eligible                                                  low. Each group represents one-third of the market capitalization. Similarly, stocks
market is composed of securities of US companies traded on the NYSE, NYSE MKT                                                      are sorted into three relative price groups. The intersections of the three
(formerly AMEX), and Nasdaq Global Market. Exclusions: Non-US companies, REITs,                                                    profitability groups and the three relative price groups yield nine subgroups formed
UITs, and investment companies. From January 1975 to the present, the index also                                                   on profitability and relative price. The index represents the average return of the
excludes companies with the lowest profitability and highest relative price within                                                 three low-profitability subgroups. It is rebalanced twice per year. Profitability is
the small cap universe. Profitability is measured as operating income before                                                       measured as operating income before depreciation and amortization minus interest
depreciation and amortization minus interest expense scaled by book. Source:                                                       expense scaled by book. Source: CRSP and Compustat.
CRSP and Compustat. The index monthly returns are computed as the simple
                                                                                                                                   Dimensional International Small Cap Index was created by Dimensional in April
average of the monthly returns of 12 sub-indices, each one reconstituted once a
                                                                                                                                   2008 and is compiled by Dimensional. July 1981–December 1993: It Includes non-
year at the end of a different month of the year. The calculation methodology for
                                                                                                                                   US developed securities in the bottom 10% of market capitalization in each eligible
the Dimensional US Small Cap Index was amended on January 1, 2014, to include
                                                                                                                                   country. All securities are market capitalization weighted. Each country is capped at
profitability as a factor in selecting securities for inclusion in the index.
                                                                                                                                   50%. Rebalanced semiannually. January 1994–Present: Market-capitalization-
Dimensional US High Profitability Index was created by Dimensional in January                                                      weighted index of small company securities in the eligible markets excluding those
2014 and represents an index consisting of US companies. It is compiled by                                                         with the lowest profitability and highest relative price within the small cap universe.
Dimensional. Dimensional sorts stocks into three profitability groups from high to                                                 Profitability is measured as operating income before depreciation and amortization
low. Each group represents one-third of the market capitalization. Similarly, stocks                                               minus interest expense scaled by book. The index monthly returns are computed as
are sorted into three relative price groups. The intersections of the three                                                        the simple average of the monthly returns of four sub-indices, each one
profitability groups and the three relative price groups yield nine subgroups formed                                               reconstituted once a year at the end of a different quarter of the year. Prior to July
on profitability and relative price. The index represents the average return of the                                                1981, the index is 50% UK and 50% Japan. The calculation methodology for the
three high-profitability subgroups. It is rebalanced twice per year. Profitability is                                              Dimensional International Small Cap Index was amended on January 1, 2014, to
measured as operating income before depreciation and amortization minus interest                                                   include profitability as a factor in selecting securities for inclusion in the index.
expense scaled by book. Source: CRSP and Compustat.

The Dimensional Indices have been retrospectively calculated by Dimensional Fund Advisors LP and did not exist prior to their index inception dates. Accordingly, results shown during the periods prior to each index’s index inception date do
not represent actual returns of the index. Other periods selected may have different results, including losses. Backtested index performance is hypothetical and is provided for informational purposes only to indicate historical performance had
the index been calculated over the relevant time periods. Backtested performance results assume the reinvestment of dividends and capital gains.                                                                                                      29
Index Descriptions

Dimensional International Low Profitability Index was created by Dimensional in                                                  Dimensional Emerging Markets High Profitability Index was created by
January 2013 and represents an index consisting of non-US developed companies.                                                   Dimensional in April 2013 and represents an index consisting of emerging markets
It is compiled by Dimensional. Dimensional sorts stocks into three profitability                                                 companies and is compiled by Dimensional. Dimensional sorts stocks into three
groups from high to low. Each group represents one-third of the market                                                           profitability groups from high to low. Each group represents one-third of the market
capitalization of each eligible country. Similarly, stocks are sorted into three relative                                        capitalization of each eligible country. Similarly, stocks are sorted into three relative
price groups. The intersections of the three profitability groups and the three                                                  price groups. The intersections of the three profitability groups and the three
relative price groups yield nine subgroups formed on profitability and relative price.                                           relative price groups yield nine subgroups formed on profitability and relative price.
The index represents the average return of the three low-profitability subgroups.                                                The index represents the average return of the three high-profitability subgroups.
The index is rebalanced twice per year. Profitability is measured as operating                                                   The index is rebalanced twice per year. Profitability is measured as operating
income before depreciation and amortization minus interest expense scaled by                                                     income before depreciation and amortization minus interest expense scaled by
book. Source: Bloomberg.                                                                                                         book. Source: Bloomberg.

Dimensional International High Profitability Index was created by Dimensional in                                                 Dimensional Emerging Markets Small Cap Index was created by Dimensional in
January 2013 and represents an index consisting of non-US developed companies.                                                   April 2008 and is compiled by Dimensional. January 1989–December 1993:
It is compiled by Dimensional. Dimensional sorts stocks into three profitability                                                 Fama/French Emerging Markets Small Cap Index. January 1994–Present:
groups from high to low. Each group represents one-third of the market                                                           Dimensional Emerging Markets Small Cap Index composition: Market-capitalization-
capitalization of each eligible country. Similarly, stocks are sorted into three relative                                        weighted index of small company securities in the eligible markets excluding those
price groups. The intersections of the three profitability groups and the three                                                  with the lowest profitability and highest relative price within the small cap universe.
relative price groups yield nine subgroups formed on profitability and relative price.                                           Profitability is measured as operating income before depreciation and amortization
The index represents the average return of the three high-profitability subgroups.                                               minus interest expense scaled by book. The index monthly returns are computed as
The index is rebalanced twice per year. Profitability is measured as operating                                                   the simple average of the monthly returns of four sub-indices, each one
income before depreciation and amortization minus interest expense scaled by                                                     reconstituted once a year at the end of a different quarter of the year.
book. Source: Bloomberg.                                                                                                         Source: Bloomberg. The calculation methodology for the Dimensional Emerging
                                                                                                                                 Markets Small Cap Index was amended on January 1, 2014, to include profitability
Dimensional Emerging Markets Low Profitability Index was created by                                                              as a factor in selecting securities for inclusion in the index.
Dimensional in April 2013 and represents an index consisting of emerging markets
companies and is compiled by Dimensional. Dimensional sorts stocks into three
profitability groups from high to low. Each group represents one-third of the market
capitalization of each eligible country. Similarly, stocks are sorted into three relative
price groups. The intersections of the three profitability groups and the three
relative price groups yield nine subgroups formed on profitability and relative price.
The index represents the average return of the three low-profitability subgroups.
The index is rebalanced twice per year. Profitability is measured as operating
income before depreciation and amortization minus interest expense scaled by
book. Source: Bloomberg.

The Dimensional Indices have been retrospectively calculated by Dimensional Fund Advisors LP and did not exist prior to their index inception dates. Accordingly, results shown during the periods prior to each index’s index inception date do
not represent actual returns of the index. Other periods selected may have different results, including losses. Backtested index performance is hypothetical and is provided for informational purposes only to indicate historical performance had
the index been calculated over the relevant time periods. Backtested performance results assume the reinvestment of dividends and capital gains. Eugene Fama and Ken French are members of the Board of Directors of the general partner of,
and provide consulting services to, Dimensional Fund Advisors LP.                                                                                                                                                                                     30
Index Descriptions

Fama/French US Value Research Index: Provided by Fama/French from CRSP                                                           Fama/French International Growth Index: 2008–present: Provided by
securities data. Includes the lower 30% in price-to-book of NYSE securities (plus                                                Fama/French from Bloomberg securities data. Simulated strategy of MSCI EAFE +
NYSE Amex equivalents since July 1962 and Nasdaq equivalents since 1973).                                                        Canada countries in the higher 30% price-to-book range. 1975–2007: Provided by
                                                                                                                                 Fama/French from MSCI securities data.
Fama/French US Growth Research Index: Provided by Fama/French from CRSP
securities data. Includes the higher 30% in price-to-book of NYSE securities (plus                                               Fama/French Emerging Markets Value Index: 2009–present: Provided by
NYSE Amex equivalents since July 1962 and Nasdaq equivalents since 1973).                                                        Fama/French from Bloomberg securities data. Simulated strategy using IFC
                                                                                                                                 investable universe countries. Companies in the lower 30% price-to-book range;
Fama/French Total US Market Index: Provided by Fama/French from CRSP                                                             companies weighted by float-adjusted market cap; countries weighted by country
securities data. Includes all US operating companies trading on the NYSE, AMEX, or                                               float-adjusted market cap; rebalanced monthly. 1989–2008: Provided by
Nasdaq NMS. Excludes ADRs, investment companies, tracking stocks, non-US                                                         Fama/French from IFC securities data. IFC data provided by International
incorporated companies, closed-end funds, certificates, shares of beneficial                                                     Finance Corporation.
interests, and Berkshire Hathaway Inc. (Permco 540).
                                                                                                                                 Fama/French Emerging Markets Growth Index: 2009–present: Provided by
Fama/French International Value Index: 2008–present: Provided by Fama/French                                                     Fama/French from Bloomberg securities data. Simulated strategy using IFC
from Bloomberg securities data. Simulated strategy of MSCI EAFE + Canada                                                         investable universe countries. Companies in the higher 30% price-to-book range;
countries in the lower 30% price-to-book range. 1975–2007: Provided by                                                           companies weighted by float-adjusted market cap; countries weighted by country
Fama/French from MSCI securities data.                                                                                           float-adjusted market cap; rebalanced monthly. 1989–2008: Provided by
                                                                                                                                 Fama/French from IFC securities data. IFC data provided by International
                                                                                                                                 Finance Corporation.

Results shown during periods prior to each index’s index inception date do not represent actual returns of the respective index. Other periods selected may have different results, including losses. Backtested index performance is hypothetical
and is provided for informational purposes only to indicate historical performance had the index been calculated over the relevant time periods. Backtested performance results assume the reinvestment of dividends
and capital gains. Eugene Fama and Ken French are members of the Board of Directors of the general partner of, and provide consulting services to, Dimensional Fund Advisors LP.                                                                     31
Data Appendix

US-domiciled open-end mutual fund data is from Morningstar and Center          Index funds and fund-of-funds are excluded from the sample. Net assets for
for Research in Security Prices (CRSP) from the University of Chicago.         funds with multiple share classes or feeder funds are a sum of the individual
                                                                               share class total net assets. The return, expense ratio, and turnover for funds
Equity fund sample includes the Morningstar historical categories:             with multiple share classes are taken as the asset-weighted average of the
Diversified Emerging Markets, Europe Stock, Foreign Large Blend, Foreign       individual share class observations. Fund share classes are aggregated at the
Large Growth, Foreign Large Value, Foreign Small/Mid Blend, Foreign            strategy level using Morningstar FundID and CRSP portfolio number.
Small/Mid Growth, Foreign Small/Mid Value, Japan Stock, Large Blend,
Large Growth, Large Value, Mid-Cap Blend, Mid-Cap Growth, Mid-Cap              Each fund is evaluated relative to the Morningstar category index assigned
Value, Miscellaneous Region, Pacific/Asia ex-Japan Stock, Small Blend, Small   to the fund’s category at the start of the evaluation period. So, if, for
Growth, Small Value, and World Stock. For additional information regarding     example, a fund changes from Large Value to Large Growth during the
the Morningstar historical categories, please see “The Morningstar             evaluation period, then its return will still be compared to the Large Value
Category Classifications” at                                                   category index. Surviving funds are those with return observations for every
http://morningstardirect.morningstar.com/clientcomm/Morningstar_Catego         month of the sample period. Winner funds are those that survived and
ries_US_April_2016.pdf.                                                        whose cumulative net return over the period exceeded that of their
                                                                               respective Morningstar category index. Loser funds are funds that did not
Fixed income fund sample includes the Morningstar historical categories:       survive the period or whose cumulative net return did not exceed their
Corporate Bond, High Yield Bond, Inflation-Protected Bond, Intermediate        respective Morningstar category index.
Government, Intermediate-Term Bond, Muni California Intermediate, Muni
California Long, Muni Massachusetts, Muni Minnesota, Muni National             Index data provided by Bloomberg Barclays, MSCI, Russell, FTSE Fixed
Intermediate, Muni National Long, Muni National Short, Muni New Jersey,        Income LLC, and S&P. Bloomberg Barclays data provided by Bloomberg.
Muni New York Intermediate, Muni New York Long, Muni Ohio, Muni                MSCI data ©MSCI 2019, all rights reserved. Frank Russell Company is the
Pennsylvania, Muni Single State Intermediate, Muni Single State Long, Muni     source and owner of the trademarks, service marks, and copyrights related
Single State Short, Short Government, Short-Term Bond, Ultrashort Bond,        to the Russell Indexes. FTSE fixed income indices © 2019 FTSE Fixed
and World Bond. For additional information regarding the Morningstar           Income LLC. All rights reserved. S&P and Dow Jones data © 2019 S&P Dow
historical categories, please see “The Morningstar Category Classifications”   Jones Indices LLC, a division of S&P Global. All rights reserved.
at
http://morningstardirect.morningstar.com/clientcomm/Morningstar_Catego         Indices are not available for direct investment. Their performance does not
ries_US_April_2016.pdf.                                                        reflect the expenses associated with management of an actual portfolio.

                                                                               Mutual fund investment values will fluctuate, and shares, when
                                                                               redeemed, may be worth more or less than original cost. Diversification
                                                                               neither assures a profit nor guarantees against a loss in a declining
                                                                               market. There is no guarantee investment strategies will be successful.
                                                                               Past performance is no guarantee of future results

                                                                                                                                                              32
                                                                                                                                                           #58927-0617
Presenter’s Biography

Graham Dorland, CFA, CAIA
Regional Director

Graham Dorland is a Regional Director in Dimensional’s Institutional Services department. Based in the Austin office, Graham works
to develop and strengthen the firm’s relationships with institutional investors. Prior to joining Dimensional, he worked as an associate
director on the institutional sales team at Russell Investments, where he was responsible for client development of the firm’s OCIO
and multi-asset solutions.

Graham earned both an MBA and a bachelor’s degree in business from Eastern Washington University. He is a CFA® charterholder, a
Chartered Alternative Investment Analyst (CAIA), and is Series 7 and Series 63 licensed.

                                                                                                                                           33
You can also read