INVESTOR PRESENTATION | Q4 2019 - MARCH 2020
←
→
Page content transcription
If your browser does not render page correctly, please read the page content below
MARCH 2020                                DELIVERING VALUE TODAY,

                                          BUILDING FOR
                                          TOMORROW
        INVESTOR PRESENTATION | Q4 2019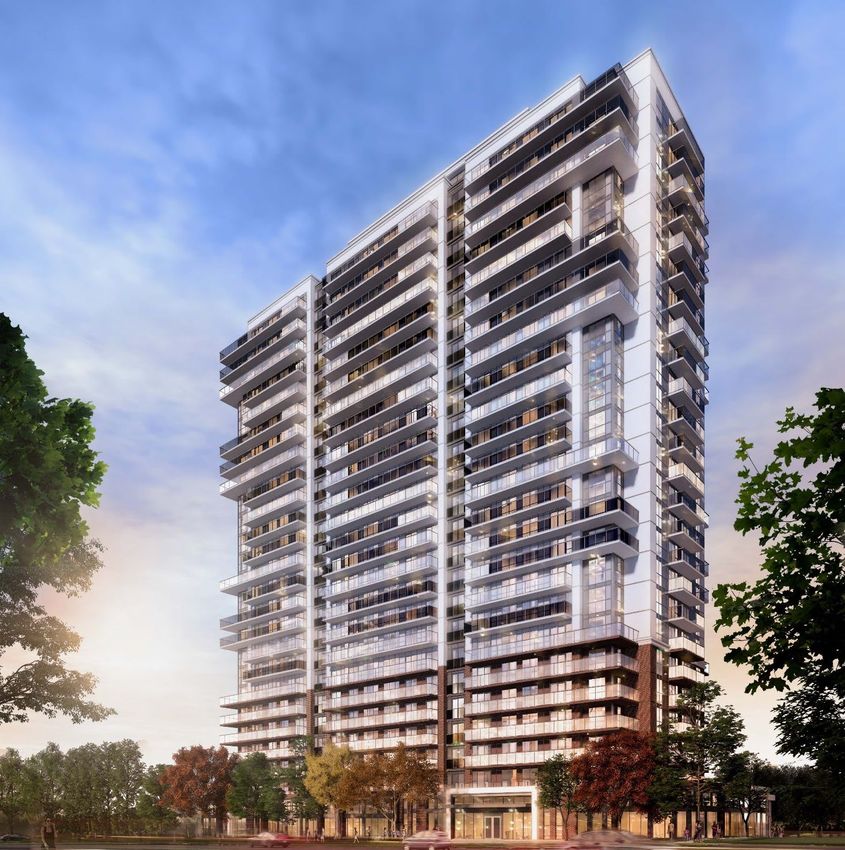
NON-GAAP MEASURES
RioCan’s consolidated financial statements are prepared in accordance with IFRS. Consistent with RioCan’s management framework, management uses certain financial
measures to assess RioCan’s financial performance, which are not generally accepted accounting principles (GAAP) under IFRS.

The following measures, Funds From Operations (“FFO”), Net Operating Income (“NOI”), Adjusted Earnings before interest, taxes, depreciation and amortization
(“Adjusted EBITDA”), Debt to Adjusted EBITDA, Same Property NOI, Interest Coverage, Debt Service Coverage, Fixed Charge Coverage, and Total Enterprise Value
as well as other measures discussed in this presentation, do not have a standardized definition prescribed by IFRS and are, therefore, unlikely to be comparable to similar
measures presented by other reporting issuers.

Non-GAAP measures should not be considered as alternatives to net earnings or comparable metrics determined in accordance with IFRS as indicators of RioCan’s
performance, liquidity, cash flow, and profitability. For a full definition of these measures, please refer to the “Non-GAAP Measures” in RioCan’s Management’s Discussion and
Analysis for the year ended December 31, 2019. RioCan uses these measures to better assess the Trust’s underlying performance and provides these additional measures so
that investors may do the same.

PEER DATA PRESENTATION
RioCan data and statistics are based on the year ended December 31, 2019 information. Certain slides contain a peer comparison that is based on the respective issuer’s
reported information as at December 31, 2019, where available, otherwise the most recent reported figures were reflected. Peer group includes: First Capital Realty Corp. (FCR),
SmartCentres REIT (SRU), Choice Properties REIT (CHP), CT REIT (CRT), and Crombie REIT (CRR). All information presented is at RioCan’s interest unless otherwise
noted. CAGR refers to compound annual growth rate of a specific metric over a period of time.

FORWARD LOOKING INFORMATION
Certain information included in this presentation contains forward-looking statements within the meaning of applicable securities laws including, among others, statements
concerning our objectives, our strategies to achieve those objectives, as well as statements with respect to management's beliefs, plans, estimates, and intentions, and similar
statements concerning anticipated future events, results, circumstances, performance or expectations that are not historical facts. Certain material factors, estimates or
assumptions were applied in drawing a conclusion or making a forecast or projection as reflected in these statements and actual results could differ materially from such
conclusions, forecasts or projections.

The forward looking information contained in this presentation is made as of the date hereof.

Additional information on the material risks that could cause our actual results to differ materially from the conclusions, forecast or projections in these statements and the
material factors, estimates or assumptions that were applied in drawing a conclusion or making a forecast or projection as reflected in the forward-looking information can be
found in our most recent annual information form and annual report that are available on our website and at www.sedar.com.

Except as required by applicable law, RioCan undertakes no obligation to publicly update or revise any forward-looking statement, whether as a result of new information,
future events or otherwise.                                                                                                                         Investor Presentation | RioCan | 2
ABOUT RIOCAN
    Diversified mix of high quality assets in high growth markets

     90.1% of Annualized Revenue from Canada’s Six Major Markets                                                         RioCan’s Reach:

                                                                                                    12.5%

             6.6%
                                                                                                                 4.7%             Retail

      4.9%                                          Edmonton

                                   Vancouver
                                                        Calgary
                                                                                                                              Residential

                                                                               Ottawa             Montreal
    Within 5 km of RioCan Properties1
                   2016       2019       Growth
                                                                                            Toronto              52.4%
Population      151,563    197,868            31%               9.0%
HH Income        98,529    115,111            17%

   Leading Toronto                   Downside protected                  Upside value creation      Strong balance                Office
   and major market                  property and tenant                 with development,          sheet with
   portfolio with highly             mix predominantly                   73% of 29M sf pipeline     investment grade
   experienced and                   comprised of necessity-             zoned/zoning               ratings: BBB/BBB
   deep management                   based retail and urban              submitted and ~100%        (high) ratings by
   team with a proven                mixed-use properties in             located in major           S&P / DBRS
   track record of driving           best-in-class locations             markets including
   success                                                               ~67% in the Greater
                                                                         Toronto Area                                          Mixed-Use
      1. Source: DemoStats – 2019 - Trends, ©2020 Environics Analytics                                                       Investor Presentation | RioCan | 3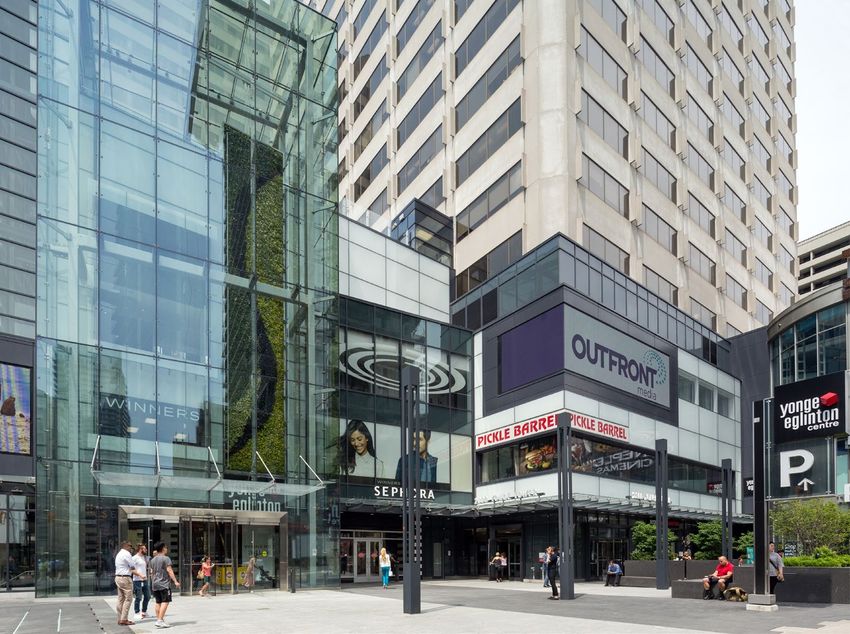
RIOCAN’S STRATEGIC PRIORITIES
Sustaining success and long term value

                                         Key Differentiators
       Leading Toronto and
                               Downside protected      Upside value creation       Strong
          major market
                             property and tenant mix    with development        balance sheet
             portfolio

                               Drive organic
     Continue to focus          growth with                                        Mitigate risk
                                                        Upside value
     on major markets,           downside                                      effectively through
                                                        creation with
        particularly             protected                                           prudent
                                                        development
          Toronto              property and                                       management
                                tenant mix

           Provide unitholders with reliable and growing total returns

                                                                                      Investor Presentation | RioCan | 4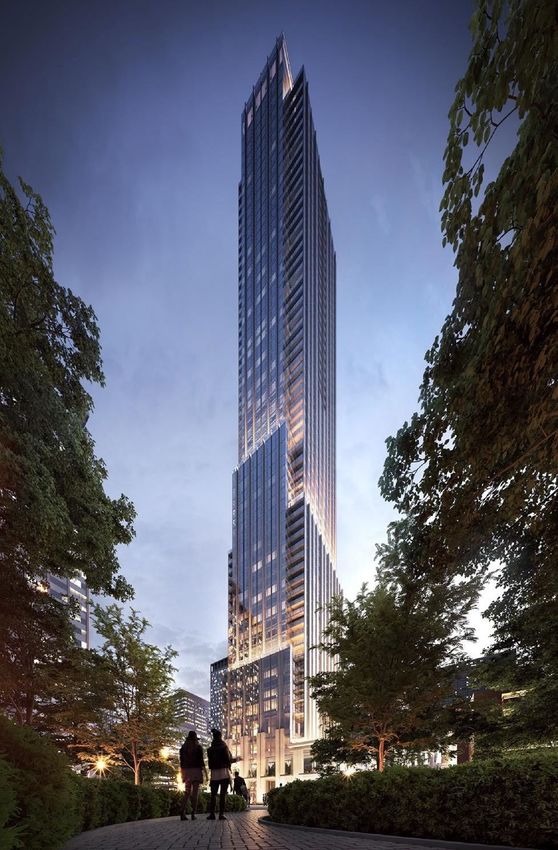
LEADING PORTFOLIO IN HIGH GROWTH URBAN CENTRES
                                                                                                                                                          Concentrate in
Outperforming our peers1                                                                                                                                  Major Markets

                         Leading Six Major                                                                           Leading Toronto
                         Market Presence1                                                                               Presence1

  90.1%        91.0%

                            70.8%
                                                                                               52.4%

                                          46.3%                                                              37.0%

                                                                                                                            21.0%

                                                       N/A          N/A                                               N/A           N/A           N/A

 1. As measured by % of revenues based on the respective issuer’s reported information as at December 31, 2019

                                                                                                                                    Investor Presentation | RioCan | 5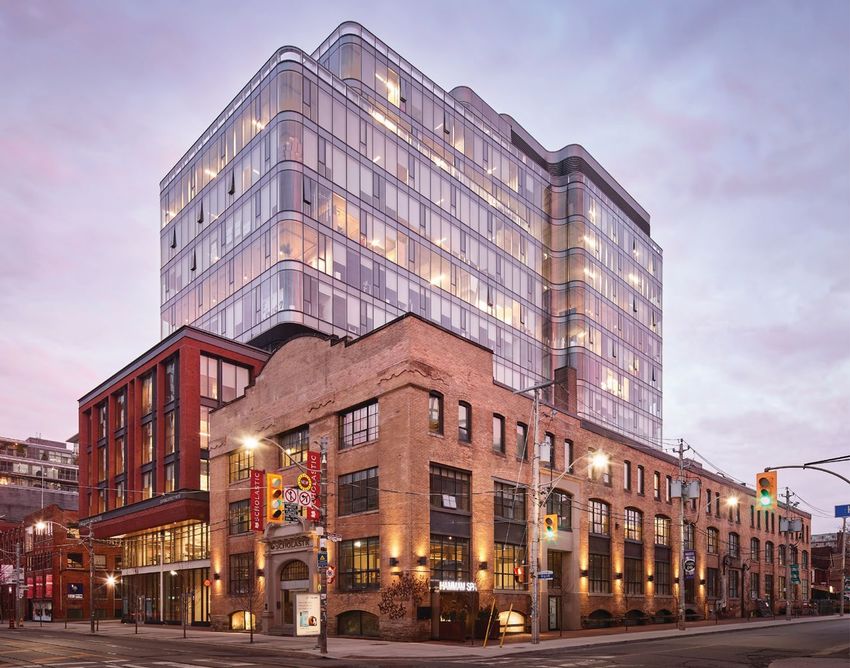
HIGH-PERFORMANCE GROWTH ORIENTED PORTFOLIO
Delivering high-quality income                                                                                                               Drive Organic
                                                                                                                                                Growth

                                                      Net Rent PSF CAGR since 2015: 3.7%
                                                                                                                    $19.75
100.0%                                                                                         $19.07                                     $20.00
                                                       $17.59             $17.75
                         $17.11                                                                                                           $18.00
95.0%
                                                                          96.6%                97.1%                97.2%                 $16.00
                                                       95.6%
                         94.0%
90.0%                                                                                                                                     $14.00
                                 1
                          2015                         2016               2017                 2018                 2019

   1. Target exited from Canada in 2015

                                  Avg. Population                                        Avg. Household Income
                                    Within 5km                                                 Within 5km
                                                                ~322k
                                                                                               +17%
                                                                                                                           ~$129k
                              +31%
                                                                                                        ~$115k
                                           ~198k                                    ~$99k
                 ~152k

                2016                       2019               2019                  2016                 2019             2019
               Portfolio                  Portfolio     GTA Development            Portfolio            Portfolio   GTA Development
                                                           Properties                                                  Properties
Source: Environics Analytics Data Stats
                                                                                                                     Investor Presentation | RioCan | 6
DIVERSIFIED PORTFOLIO PROVIDES CONSISTENT GROWTH
Primarily necessity-based and service-oriented property and tenant mix                                                                    Drive Organic
                                                                                                                                             Growth

                    Property Mix                                                             Tenant Mix
    62.9% OF RENT FROM MIXED-USE URBAN ASSETS                               74.5% OF RENT FROM NECESSITY-BASED
          AND GROCERY ANCHORED CENTERS                                         AND SERVICE-ORIENTED TENANTS

                                                                                 Entertainment/Hobby/Electronics/Books
                                                              Department Movie Theatres          3.1%
                                                               Stores &      4.4%
                                                               Apparel
                                                                 8.4%                                                               4%
                   Enclosed,
                     9.9%                                                                                                           since 2007
                                                                    8%
                                                                    since 2007                               Grocery /
                                 Mixed-Use / Urban,                                                         Pharmacy /
                                       22.0%                                                                  Liquor /
                                                                                                            Restaurants
                                                                                                               28.2%
     Open Air Center,                                                          Furniture &
         27.2%                                                                   Home
                                                                                  9.6%

                                                      62.9%                      Specialty                                                   74.5%
                                                                                 Retailers
                          Grocery Anchored                                                                    Personal
                                                                                  10.7%
                            Center, 40.9%                                                                     Services
                                                                                                               22.0%
                                                                                       Value Retailers
                                                                                           13.6%
                                                                                                                                    6%
                                                                                                                                    since 2007

                           No Single Tenant > 5% of Annualized Rental Revenue

                                                                                                                  Investor Presentation | RioCan | 7
OUR QUALITY OF INCOME HAS NEVER BEEN STRONGER
Operating metrics are producing high quality income Drive Organic
Growth
Total
Metric 2017 2019
Improvement
Major Market Presence (% of Revenue) 76.1% 90.1% +14.0%
GTA Presence (% of Revenue) 40.9% 52.4% +11.5%
Same Property NOI growth 2.1% 2.1% 1 +0.0% -
Average Net Rent PSF $17.75 $19.75 +11.3%
Committed Occupancy 96.6% 97.2% +0.6%
1. If SPNOI from completed properties under development are included, SPNOI increased by 3.3% when compared to the same period in 2018
2. Includes properties under development and residential inventory as of respective year end
3. Excluding the $1.4B of development costs on the balance sheet, debt-to-adjusted EBITDA would be 6.3x Investor Presentation | RioCan | 8
STRONG BALANCE SHEET WITH AMPLE LIQUIDITY
PRUDENT CAPITAL MANAGEMENT & FLEXIBLE CAPITAL STRUCTURE                                                                                       Manage Risk
                                                                                                                                               Effectively

                                                        Capital Structure Metrics

                                                                                                             Target     20191

     Debt to Adjusted EBITDA                                                                                 3.0x       3.50x
     Debt Service Coverage                                                                                   >2.25x      2.96x
     Fixed Coverage                                                                                          >1.10x      1.16x
     Unencumbered Assets                                                                                                $8.9B
                                                           CONSISTENTLY ABOVEN/A
                                                                             95%
     Unencumbered Assets to Unencumbered Debt                                                                 >2.0x      2.27x
     NOI % from Unencumbered Assets                                                                           >50%      58.5%
     Unsecured vs. Secured Debt                                                                          60% / 40%    60% / 40%
     Ratio of floating rate debt to total debt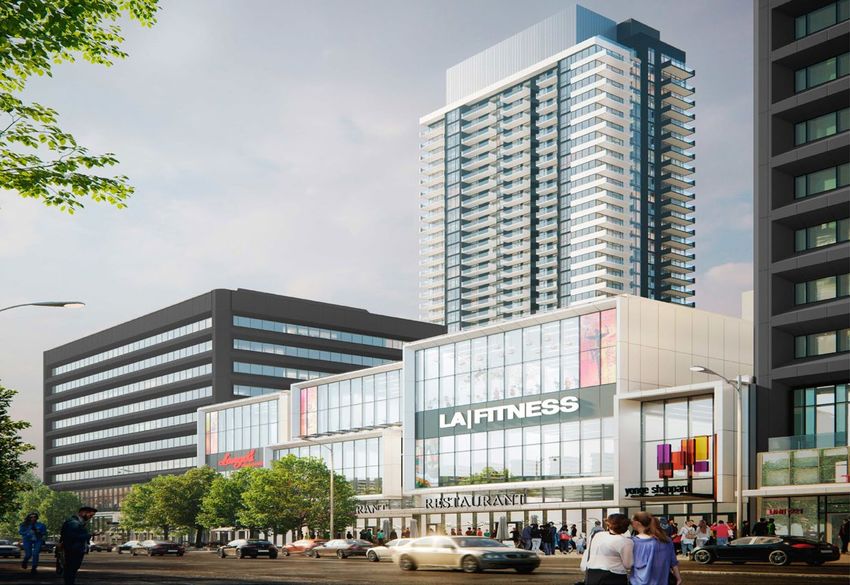
DISCIPLINED CAPITAL ALLOCATION STRATEGY
Continually improving our balance sheet and lowering Debt-to-Adjusted EBITDA                                                                                                   Manage Risk
                                                                                                                                                                                Effectively

                                                                                                   • Solid balance sheet with strong Debt-to-Adjusted
                                                                                                     EBITDA and leverage ratios relative to peers
                                                                                                   • Laddered debt maturity profile with mostly fixed-
                                                                                                     rate debt to manage interest rate risk
                                   Low                                                             • Access to multiple sources of capital
                                 Leverage
                                                                                                   • Liquidity and financial flexibility with ample
                                                                                                     availability on credit facilities and an $8.9B
                                                                                                     unencumbered assets pool, generating 58.5% of
               Multiple
                                                                                                     annualized NOI
               Capital
               Sources

                                                                                                       Debt-to-Adjusted                                Leverage                2

                                         Strong Growth                                                     EBITDA                                                      44.7%
                                                                                                                                        2          42.1%
                                                                                                                 1
                                                                                                                                8.15x
                                                                                                         8.06x

                                                                                                                                   RioCan          Peer Average

1. Excluding the $1.4B of development costs on the balance sheet, RioCan debt-to-adjusted EBITDA would be 6.3x
2. Peer group includes: FCR, SRU, CHP, CRT, and CRR; comparison is based on the respective issuer’s reported information as at December 31, 2019
                                                                                                                                                      Investor Presentation | RioCan | 10
DEEP EXECUTIVE BENCH
Extensive industry knowledge and unparalleled experience
Edward Sonshine O.Ont, Q.C Jonathan Gitlin Qi Tang John Ballantyne
Chief Executive Officer President & Senior Vice President Senior Vice President,
Chief Operating Officer & Chief Financial Officer Asset Management
Andrew Duncan Oliver Harrison Jeff Ross Jennifer Suess
Senior Vice President, Senior Vice President, Senior Vice President, Senior Vice President,
Development Operations Leasing & Tenant Coordination General Counsel & Corporate Secretary
Investor Presentation | RioCan | 11WHY INVEST IN CANADA
Concentrate in
Canada outperforms G7 countries across key metrics – strong population and economic growth Major Markets
Population Growth│G7 Countries │ 2019 - 2029 GDP Growth│G7 Countries │ 2019 - 2029
19.5%
17.1%
15.6%
10.7% 14.0%
6.9% 2.8% 2.7%
0.7% 9.4%
6.4% 5.7%
-1.7% -4.3%
Canada U.S. U.K. France Germany Italy Japan U.S. Canada U.K. France Germany Japan Italy
Employment Growth│G7 Countries │ 2019 - 2029 Benefits of Canada
6.4%
5.4%
4.3% 3.7%
Developed Educated
0.7% Political
Economy Workforce
-0.9% -3.3%
Stability
Canada France U.S. U.K. Italy Germany Japan
Streamlined Clean
Immigration Environment
Source: CBRE – Canadian Market Overview, Feb 2020 Investor Presentation | RioCan | 12CANADA vs. U.S.
Key differences in REIT investment fundamentals
Stronger Retail Operating
Environment
• Lower retail space per capita
(CAN: 15.9 sf vs US: 23.9 sf)1
• Fewer competing tenants per
category
• Lower e-commerce penetration
given higher distribution cost due to
Canada’s geographic diversity
More Significant Barriers to
Entry
• Limited supply of land for
development in key urban centers
• Tighter zoning by-laws mitigating
oversupply of retail space
• More conservative lending practices
limiting over building and over risk-
taking
Higher Retail Investor
Ownership in Canada2
• CAN: ~65% vs US: ~10% resulting in
higher demand for yield which
impacts capital structure
1. Source: CBRE Research, year-end 2019 Investor Presentation | RioCan | 13
2. Source: RBC Capital MarketTORONTO – AN EVOLVING WORLD CLASS CITY
Concentrate in
Recognized as one of the world’s most liveable cities with population growth far outpacing Major Markets
key North American Cities
LOW-COST, HIGH-QUALITY BUSINESS ENVIRONMENT
Toronto offers the highest quality for the lowest cost, when compared to other
prominent cities1
New York City
190
170
Toronto
150
Quality
Chicago
130
San Francisco
Atlanta
110 Boston
Philadelphia Washington DC
90
Pittsburgh
70
70 80 90 100 110 120 130 140
Cost
POPULATION CHANGE, 2011-2016
Over the period, Toronto added 433,537 people, growing faster than others
400,000
300,000
200,000
100,000
-
1. Source: fDi Benchmark (2017) – based on a operation with 5,000 employees (across various positions) and 500K SF of office space
Investor Presentation | RioCan | 14
2. Source: StatsCan 2016 Census, US Census Bureau American Community Survey 2016TORONTO FAVORABLE TO U.S. GATEWAY MARKETS
Concentrate in
RioCan well positioned with strong property and tenant mix in highly desirable locations Major Markets
♦Canada’s
Toronto stats
economic center
for various industries Highest population growth
Decreasing unemployment
Tremendous growth
prospects in office, retail
including finance, in Canada due to
rate, currently at 5.5%1 and residential rents
technology, education, immigration and migration
relative to key U.S. cities
arts, and life sciences
“Technology companies are
hiring more workers in Toronto,
attracted by the region’s diverse
population of 6.4 million, a deep
pool of skilled labor and cultural
similarities to major U.S. cities
such as San Francisco, New
York and Chicago.”
- Wall Street Journal
San Washington,
Toronto New York Boston Chicago Los Angeles
Francisco D.C.
Office vacancy 2 2.2% 7.6% 6.7% 13.8% 19.0% 3.7% 13.9%
Retail 2,3
2.6% 8.4% 6.9% 11.8% 7.10 4.1% 7.7%
vacancy / availability
Residential vacancy 2 1.5% 2.7% 3.2% 4.9% 3.7% 4.1% 4.0%
Population
1.8% 0.1% 0.7% -0.1% 0.2% 0.8% 1.0%
5-YR CAGR2
1. Source: StatsCan Table 14-10-0354 Regional unemployment rates used by the Employment Insurance Program,
three month moving average seasonally adjusted (January 2020)
2. Source: CBRE Research, Market Fundamentals and CBRE Econometric Advisors - Q4 2019 Investor Presentation | RioCan | 15
3. Toronto data is based on vacancy rate and US data based on availability rateSIGNIFICANT VALUE UPSIDE COMPARED TO PEERS
Despite sharing a similar tenant mix, RioCan is trading at lower multiple than key peers Drive Organic
Growth
Price to FFO Multiple
Source: TD Securities and Company Reports Investor Presentation | RioCan | 16VALUE CREATION THROUGH MIXED-USE DEVELOPMENT
Highest percentage of development pipeline zoned amongst peers with a strong focus Upside Value
in the Toronto market
Creation
~100% located in Canada’s ~98% of projects are Completed / Under Construction1 Construction to Start by 20211
six major markets; mixed-use residential • 2,700 residential rental units • 2,100 residential rental units
~67% located in the GTA projects • ~920 condo/townhouse units • 2,100 condo/townhouse units
Total Development Pipeline
(29.0M sf)
Zoning applications submitted,
6.5M sf, 23%
Highest
zoning
entitlements
among peers
Zoning
approved,
14.6M sf, 50%
Future estimated density,
7.9M sf, 27%
1. At 100% of the project Investor Presentation | RioCan | 17WHAT DRIVES TORONTO RESIDENTIAL RENTAL MARKET
Upside Value
Creation
POPULATION GROWTH RISING OWNERSHIP COSTS AND
PRIMARILY DRIVEN MORTGAGE STRESS TESTS SUPPLY / DEMAND IMBALANCE
BY IMMIGRATION PUSHING FAMILIES TO RENT
RENT GROWTH % OF POPULATION USING TRANSIT TO GET TO WORK
YoY Growth
60%
8.0% Annual Rent Growth
50%
Market '04 -'17 '18-'19
40%
6.0% Toronto +2.1% per year +7.0% per year
Vancouver +3.5% per year +6.1% per year 30%
20%
4.0%
10%
2.0% 0%
0.0%
2004 2006 2008 2010 2012 2014 2016 2018
YoY Rental Growth Rate
Source: CBRE Research, CMHC, October 2019 and Q1 2020 Source: Census 2016, StatsCan, US Census Bureau, American Community Investor Presentation | RioCan | 18
Survey, 1-year Estimates, S0801, Commuting Characteristics by SexUNLOCKING THE FULL POTENTIAL
OF HIGH DENSITY TRANSIT-ORIENTED LOCATIONS IN TORONTO Upside Value
Creation
RioCan’s selected developments mapped to Toronto’s rapid transit system
Demographics, 5km radius
Toronto Pearson Average population1: ~322K
International Airport
Average household income1: ~$129K
Post-secondary education: ~62%
Legend
Under Construction: 4.7M sf sf
2.3M
Completed Development: 0.8M
0.2M sf sf
Future Development: 16.2M sf
Total (at RioCan’s Interest): 19.3M sf
TTC – Existing
Union
Station
TTC – Under Development
TTC – Station
CN Tower
Billy Bishop Planned Rapid Transit Line
Toronto City Airport
1. Demographic data within 5km radius of RioCan’s development pipeline in the GTA
Source: DemoStats – 2019 - Trends, ©2020 Environics Analytics Investor Presentation | RioCan | 19WHAT DRIVES OTTAWA RESIDENTIAL RENTAL MARKET
Upside Value
Creation
CANADA’S CAPITAL WITH
GROWING TECHNOLOGY HUB LOW INVENTORY AND LAGGING
GROWING POPULATION AND CIVIL
(HOME OF SHOPIFY) SUPPLY
SERVICE SECTOR
LOW NEW RENTAL SUPPLY HIGH RENT GROWTH
New Supply as
Market New Supply Inventory
% of Inventory
Vancouver 5,590 110,753 5.0%
Calgary 1,863 40,689 4.6%
Edmonton 1,777 69,883 2.5%
Montreal 12,303 590,305 2.1%
Ottawa 1,133 63,768 1.8%
Toronto 3,372 315,630 1.1%
Source: CBRE Research, Canada Mortgage and Housing Corporation, Q1, 2020 Investor Presentation | RioCan | 20VALUE CREATION IN TRANSIT-ORIENTED LOCATIONS IN OTTAWA
RioCan’s selected developments mapped to Ottawa’s transit system Upside Value
Creation
Demographics, 5km radius
Average population1: ~166K
Average household income1: ~$99K
Post-secondary education: ~65%
Legend
Under Construction: 0.4M sf
Completed Development: 0.1M sf
Future Development: 2.2M sf
Total (at RioCan’s Interest): 2.7M sf
O Train System – Existing
O Train System Line Extension
Bus Rapid Transit
1. Demographic data within 5km radius of RioCan’s development pipeline in Ottawa
Source: DemoStats – 2019 - Trends, ©2020 Environics Analytics Investor Presentation | RioCan | 21PROVEN MIXED-USE EXPERIENCE AND VALUE CREATION
Upside Value
Creation
Total estimates for five recently completed development projects:
$574.9M $32.1M 5.6% $779.2M $230.4M
Total Estimated Estimated Yield on Estimated Total Estimated
Estimated Net Stabilized Total Costs Future Stabilized Incremental
Project Costs NOI Value 1 Value Creation2
Bathurst College Centre, Toronto
ePlace, Toronto King and Portland Centre, Toronto Frontier, Ottawa Sage Hill, Calgary
With direct links to two subway lines Top 10 most Influential Buildings
of the 2010s (Urban Toronto)
1. Excludes condo gains
2. Includes $26.2M of condo gains. Of the total estimated incremental value creation of $230.4M, $229.0M has been recognized through property fair
market values, applicable interim and fee income and applicable condo gains
Investor Presentation | RioCan | 22PROVEN MIXED-USE EXPERIENCE AND VALUE CREATION
Strong leasing velocity for our first two rental towers Upside Value
Creation
eCentral & eCondos, Toronto
• 401 units (86%) leased as of February 19, 2020
• Rents averaging $3.90 per sf (for market rent
units)
• Stabilization expected by Spring 2020
• $118.7M estimated incremental value creation
including inventory gains of $14.5M (100%) and
5.2% development yield
Frontier (Gloucester Phase One), Ottawa
• 220 units (97%) leased as of February 19, 2020
• Rents averaging $2.49 per sf
• Phase One is now stabilized
• Zoning approved for four residential towers (up to
840 units). Construction for 209-unit Phase Two is
underway
• $18.7M estimated incremental value creation (at
RioCan’s interest) and 5.8% development yield
Investor Presentation | RioCan | 23CONDO/TOWNHOUSE DEVELOPMENT AND VALUE CREATION
Upside Value
Creation
11 YV Condos, Toronto Windfield UC Tower Condos, Oshawa (GTA)
83% of the 593 units sold as of Feb 19, 2020 74% of the 503 units sold as of Feb 19, 2020
Estimated value creation range1 of 15%-17%; Expected value creation range1 of 17%-20%
Winner of Multi-Family Community of the Year Award by the
National Association of Home Builders
1. Based on estimated IFRS cost basis including, but not limited to, land and capitalized interest during the development phase Investor Presentation | RioCan | 24MORE VALUE CREATION UNDERWAY
Staggered Development Delivery – Sample Projects Upside Value
Creation
Delivering best-in-class purpose-built rental units and condos along Canada’s most prominent
transit corridors, RioCan LivingTM shapes the communities where Canadians shop, live and work
47 residential mixed-use projects, 20,000-residential-unit pipeline
Brentwood Village College & Manning Elmvale Acres – Phase I
(Brio) (Strada) (Luma)
Yonge Sheppard Westgate Phase I The Well
Dupont Street
Centre Residential (Rhythm)
(Litho)
(Pivot)
2020 2021 2022+
Investor Presentation | RioCan | 25PRUDENT APPROACH TO DEVELOPMENT
Manage Risk
Effectively
RioCan plans to primarily self fund development
through retained free cash flow, divestiture proceeds, strategic partnerships
and faster capital recycle from condo/townhouse development
As at
Target
December 31, 2019
Properties Under Development (“PUD”) & Residential Inventory $1.4B N/A
PUD and Residential Inventory as % of Gross Assets – Per Line of Credit
9.0% ~ 10%1
and Credit Facilities Agreements
Investment in Greenfield Development and Residential Inventory as % of
4.4% N/A
Unitholder Equity - Per Declaration of Trust
$400M-$500M $300M-$600M
< $1.5B
$1.4B
Current PUD and Inventory Annual Development Spend Annual Development Target PUD and Inventory
Balance Completions Balance *
1. Maximum permitted is 15%. RioCan targets this metric to be no more than 10%
(except for short-term fluctuations as large projects are completed) Investor Presentation | RioCan | 26COMMITTED TO ESG
Systematically embed environmental, social, and governance (ESG) considerations Manage Risk
Effectively
2020 Sustainability Report to be Issued in July 2020
Environmental Tenant Engagement
GRESB Score Management System
77% Improved Public Disclosure Score
and achieved a 77% increase
and Utility Data
Survey
First ever survey of our
in survey score over two years Management System top 20 tenants in major markets
aligned to ISO 14001 77% of respondents
would recommend RioCan
41%
Habitat
Greenhouse Gas (GHG)
for Humanity
Emissions Verified
$100,000 donation made and
in accordance with ISO 14064-3 of management 140 employees volunteered
are female their time in Build Days
99% BOMA BEST
certified
Sustainability Policies
of Operations Community, Employee
>50 properties certified, as Volunteering, Procurement,
spending is from of December 31, 2019 Business Ethics
Canadian suppliers
Investor Presentation | RioCan | 27EMBEDDING SUSTAINABILITY DAY TO DAY
Mitigating our environmental footprint across our business and in all new developments Manage Risk
Effectively
Our ESG commitment in action:
• Named Canada’s 2020 Clean50 Top Project Award for
Sustainable Commercial Real Estate Development
• Integrated a low-carbon, resilient deep lake water
cooling and heating system at our flagship development,
The Well, decentralizing energy supply and reduces load
on the electricity grid for this flagship development as well
as for surrounding neighborhoods
• Developed a high efficiency geothermal HVAC system
in Frontier, our first operational RioCan Living building in
Ottawa, Ontario to reduce carbon emissions and reduce
operating costs
• Established Sustainability in Developments Policy to
ensure low-carbon, energy and water efficiencies are
incorporated in all development designs and new builds
• Increased the number of properties achieving Building
Owners and Managers Association Building Environmental
Standards (BOMA BEST) certification to over 50 or nearly
40% of our portfolio
• Implemented the RioCan Impact Scorecard program,
effective for 2020, to better integrate corporate
performance with an individual employee’s annual
objectives in performance evaluation and bonus program;
each eligible employee is required to include an ESG
specific goal
Investor Presentation | RioCan | 28APPENDIX
CASE STUDIES
Investor Presentation | RioCan | 29CASE STUDY | CREATING COMPELLING MIXED-USED CENTRES
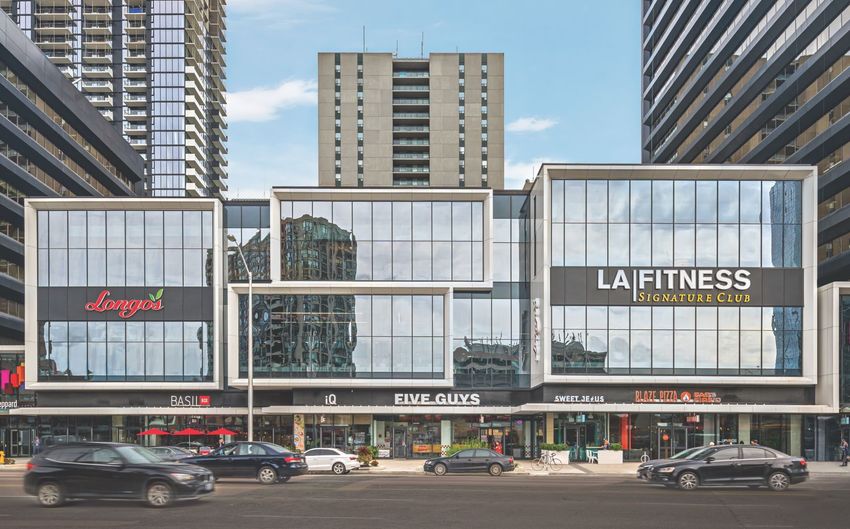
Yonge Sheppard Centre & Pivot Upside Value
Creation
• Located at one of Toronto’s busiest intersections, with
access to the Yonge and Sheppard subway lines
• This mixed-use development will feature 399k sf of office
space, 309k sf of retail space, and 258k sf of residential
space (361 units) upon completion (at 100%)
• Two phased redevelopment underway:
- Phase I: A transformative overhaul of the retail and
office space to modernize the overall look and feel of
the property was completed in 2019
- Phase II: Residential tower under construction (2020),
targeted LEED Gold
100%
With ~63% of office leases expiring
Ownership
in next five years, which are below
current market rents
NLA on Completion
~1.0M sf
(at 100%)
86% (retail)
Leasing Status Demographics within 5km radius:
100% (office)
Population: 356K
LA Fitness, Longo’s, Average HH income: $148K
Major Tenants
and Cactus Club Cafe (Q1 2020)
Source: DemoStats – 2019 - Trends, ©2020 Environics Analytics
1. Net of certain working capital adjustments Investor Presentation | RioCan | 30CASE STUDY | ePLACE (eCENTRAL & eCONDOS)
Upside Value
Creation
• eCentral is a 36 storey, 466-unit residential rental building in Toronto
• 401 units (86%) leased as of February 19, 2020
• Rents averaging $3.90 per square foot (for market rent units)
• Unparalleled access to the Yonge subway and the new Eglinton Crosstown LRT
• Part of mixed-use ePlace which also includes:
• 22k sf of retail (flagship TD Bank and foodservice)
• 20k sf commercial condo
• 58 storey, 623 unit eCondos condominium tower (fully sold out,
possession in 2019)
Estimated $118.7M of value creation
Ownership 100%
Construction Start 2015
Construction Completion 2019
Total Cost1 $219.8M
Stabilized Value $324.0M
Value Creation ($M) $104.2M
Value Creation (%) 47.4%
Condo Sale Gains (@ 50%) $14.5M
Demographics within 5km radius:
Total Project - Value
$118.7M Population: 513K
Creation Average HH income: $179K
Stabilized NOI $11.3M Source: DemoStats – 2019 - Trends,
©2020 Environics Analytics
1. Net project costs include the purchase price for the second 50% interest in this property acquired in Q3 2019, net of interim and fee income during the
development period Investor Presentation | RioCan | 31CASE STUDY | FRONTIER (GLOUCESTER PHASE ONE)
Upside Value
Creation
Frontier, Ottawa: Estimated $18.7M of value creation
• 23 storey, 228-unit residential rental
50% JV with
building Ownership
Killam REIT
• 220 units (97%) leased with rent per
square foot averaging $2.49, as of Construction Start 2018
February 19, 2020
Construction Completion 2019
• Located on a 7.1 acre portion of
RioCan’s Gloucester Silver City Total Cost 1 $33.5M
Shopping Centre
Stabilized Value $52.2M
• Adjacent to the new Confederation
LRT line at the Blair Station in Value Creation ($M) $18.7M
Ottawa
Value Creation (%) 55.8%
• Sustainable development including
a geothermal energy system Stabilized NOI $2.0M
Phase 1
Zoning has been approved for four residential RioCan Gloucester Silver City shopping centre Demographics within 5km radius:
towers on the site with up to 840 units tenant mix is strong and diverse: Cineplex theatre, Population: 135K
Chapters, Goodlife and numerous restaurants Average HH income: $91K
Source: DemoStats – 2019 - Trends,
©2020 Environics Analytics
1. Total costs are net of applicable interim and fee income during the development period Investor Presentation | RioCan | 32CASE STUDY | KING & PORTLAND CENTRE & KINGLY CONDOS
Unlocking value through urban mixed-use development Upside Value
Creation
Newly constructed office space is fully Existing 55k sf of previously existing
• Urban Toronto, transit-oriented location with leased to Shopify (183k sf) and Indigo adjacent office space is fully leased
frontage on King St (79k sf). Targeted LEED Platinum with significant rent upside potential
• One of the first projects in the RioCan/Allied
urban intensification joint venture.
• 646k sf mixed-use development (at 100%),
including Kingly, a 132-unit condominium
building
Estimated $52.7M of value creation
50% JV with Allied
Ownership
Properties REIT
Construction Start 2016
Construction Completion 2019
Total Cost1 $90.5M
Top 10 Most Influential Buildings of the 2010s
As selected by Urban Toronto, Jan 2020
Stabilized Value $131.5M
Value Creation ($M) $41.0M ~15k sf of retail space fully leased to restaurant Kingly Condos: 132 condominium
and food service curated to suit a dense, units sold out, exceeding price
Value Creation (%) 45.3% growing and desirable demographic expectations. Possession of the units
by purchasers commenced in Q3 2019
Condo Sale Gains $11.7M Demographics within 5km radius: and was completed prior to the end of
2019
Population: 555K
Total Project - Value Creation $52.7M Average HH income: $120K
Source: DemoStats – 2019 - Trends,
Stabilized NOI $5.6M ©2020 Environics Analytics
1. Total cost includes the total project costs of the commercial component of the project net of applicable interim and fee income Investor Presentation | RioCan | 33
during the development periodCASE STUDY | TRANSFORMING TORONTO’S WEST SIDE
The Well Upside Value
Creation
Located in downtown Toronto’s west side, The Well is a ~3.1M sf of
net leasable area (at 100%), first-of-its kind take on urban mixed-use
in Canada.
• 1.1M sf of office (84% pre-leased as of February 19, 2020 with
tenant possessions expected in Q1 2021)
• Construction of the 593-unit residential rental building (The Well
Building 6) is scheduled to commence in Q3 2020 Innovative
low-carbon, resilient cooling and heating technology
• Targeted LEED Platinum for retail and office component and
TGS Tier 2 for The Well Building 6
Proposed
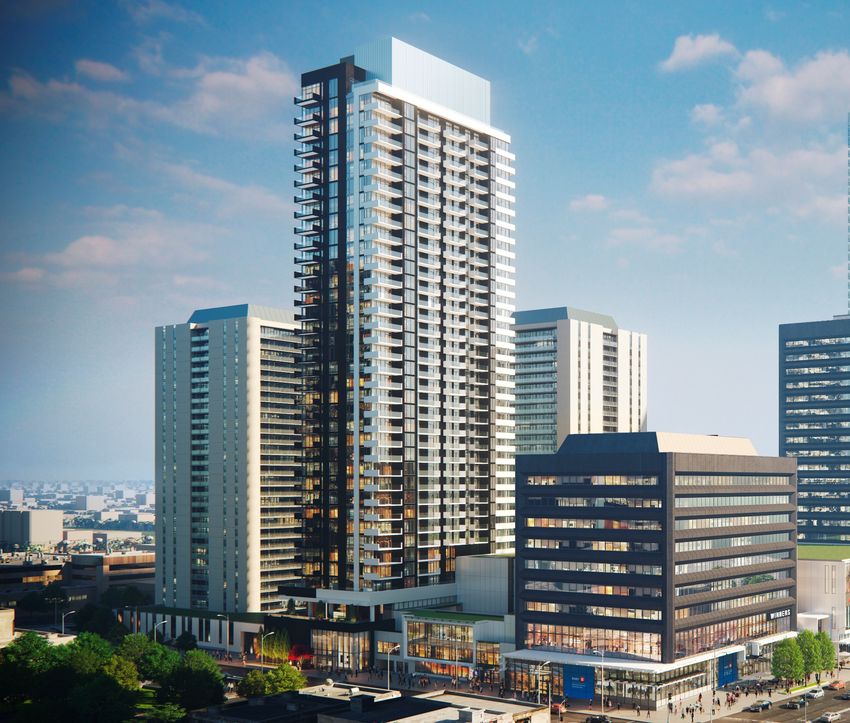
Investor Presentation | RioCan | 34CASE STUDY | TRANSFORMING AN ICONIC LOCATION
RioCan Yonge Eglinton Centre Drive Organic
Growth
• Located at the intersection of the Yonge subway Driving value through demand in an iconic location:
station and the Eglinton Crosstown LRT Toronto 67.4% increase in office rent since acquisition
• In 2016 completed the transformation from a
traditional retail/office space into a vibrant mixed-
use destination centre (BOMA BEST Certified):
˗ Full redevelopment and expansion of the
retail space
˗ Office tower renovation and façade
improvements
˗ Addition of digital screens to drive ancillary
revenue
Estimated $341.9M of value creation since acquisition
Acquisition Date 2007
Total GLA 1,059,134 sf
Ownership 100%
Total Costs 1 $333.0M
Valuation Q4 2019 $674.9M
Driving growth through strategic Perfectly positioned through location
Value Creation ($M) $341.9M remerchandising. Addition of Sephora, & tenant mix to serve a high growth,
Cineplex VIP Cinemas, Winners and desirable demographic
Value Creation (%) 102.7% multiple national food service operators
69% or $9.98 growth in blended Demographics within 5km radius:
Value Creation CAGR 6.1% office and retail net rent psf since Population: 513K
acquisition Average HH income: $179K
NOI growth CAGR 8.0% Source: DemoStats – 2019 - Trends,
©2020 Environics Analytics
1. Total cost includes purchase price and revenue enhancing capital expenditures since acquisition but does not include maintenance capital expenditures Investor Presentation | RioCan | 352300 Yonge Street. P.O. Box 2386. Toronto, ON. M4P 1E4 | (T) 1-800-465-2733 or (416) 866-3033
You can also read