Main Market listing and Offering of new shares - We are Iceland Seafood - Kvika
←
→
Page content transcription
If your browser does not render page correctly, please read the page content below

We are
Iceland Seafood
Main Market listing and
Offering of new shares
Investor Presentation

October 2019
Main Market Listing and
Offering of new shares    Disclaimer
                          All information appearing in this presentation is in accordance with the best
                          knowledge of Kvika banki hf. (also referred to as Kvika or the Financial Advisor)
                          at any given time. The Financial Advisor is in no way liable for the accuracy or
                          completeness of the information presented herein, irrespective of whether it
                          comes from the Financial Advisor itself or from a third party.

                          The information appearing in this presentation should not be construed as a
                          recommendation or solicitation to buy, hold or sell specific financial
                          instruments or to take any other investment decisions. The recipient is solely
                          responsible for investment decisions taken on the basis of the information
                          presented herein. The Financial Advisor does not assume any liability
                          whatsoever for any direct or consequential loss or damage arising from any
                          use of this presentation or its contents. Kvika is not obliged to make
                          amendments or changes to this publication or to submit further information,
                          should errors be discovered or opinions or information change.

                          Furthermore, the Financial Advisor advises recipients to seek advice from
                          outside experts before taking investment decisions.

                          The Financial Advisor owns the copyright to all information appearing in this
                          presentation unless otherwise stated or implied. The written consent of the
                          Financial Advisor is required for reissuance, redistribution, and copying of the
                          information in this presentation, irrespective of the nature of the information
                          or the purpose of the proposed reissuance, redistribution, or copying.
October 2019
     Main Market Listing and
     Offering of new shares                                           Strong Roots
Iceland Seafood International is proud of its strong heritage and history
which the Company has built upon to become a respected industry leader

                           The Herring Board                          Merger: SÍF and                           IS Barraclough                         First North listing                       Solo Seafood
                           Founded in 1935 for                        Iceland Seafood Plc.                      Acquired in 2010 and                   Shares in Iceland                         Purchased in 2018,
                           the export of salted                       Including the Herring                     markes the beginning                   Seafood are listed on                     drastically strenghtening
                           herring.                                   Board, under the                          of value added                         the Nasdaq First North                    Iceland Seafood‘s value
                                                                      name SIF Plc.                             operations in the UK                   Iceland market                            added operations

                           1935                                       1999                                      2010                                   2016                                      2018

   1932                                        1957                                       2004                                     2012                                      2018                                     2019
   The Union of                                Samband of Iceland                         SÍF Plc founds                           IS Havelok                                Oceanpath                                 Main Market listing &
   Icelandic Fish                              Establishes a                              Iceland Seafood                          Founded as a joint                        Purchased in 2018,                        Management changes
   Producers (SÍF)                             seafood division for                       International                            venture, Havelok today                    drastically strenghtening                 A new board and CEO are
   Founded in 1932 for                         export of frozen                           To take over all                         is a leading seafood                      Iceland Seafood‘s value                   appointed and Iceland
   export of salted fish                       seafood                                    export and sales of                      supplier to UK                            added operations                          Seafood lists its shares on
   products.                                                                              marine products                          foodservice                                                                         the Nasdaq Iceland Main
                                                                                                                                                                                                                       Market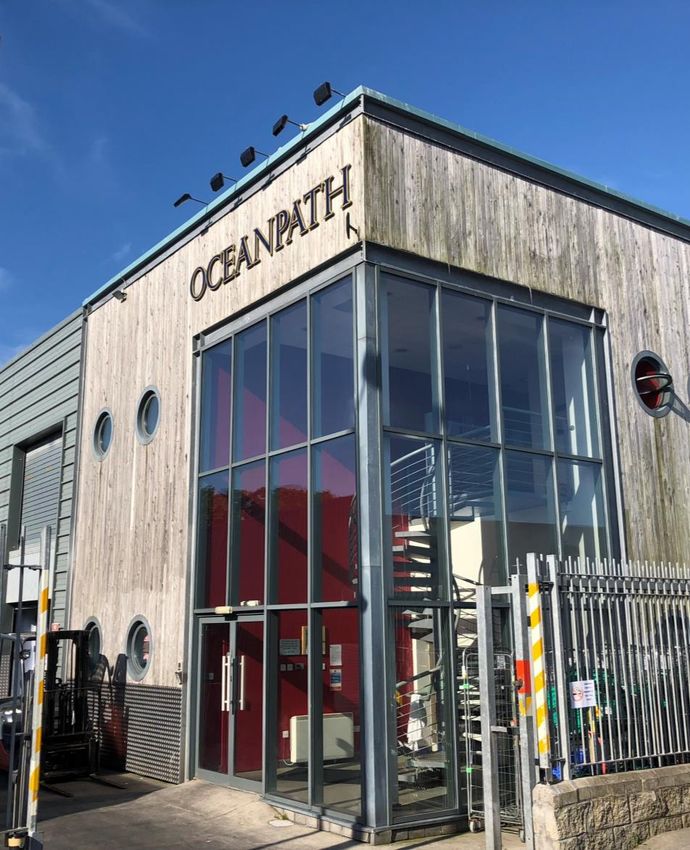
October 2019
Main Market Listing and
Offering of new shares      Exciting future
                               Vertically integrated value chain, unique sales and sourcing network

         12                                         History of strong growth

         Businesses in
         8 countries
                                       Acquisitions in 2018 transformational for the group

         620
         Employees                    Key projects will drive organic growth and efficiency

         3000                  Good opportunities for external growth within fragmented industry
         customers across
         45 countries

                                  Main market listing to support organic and acquisitive growth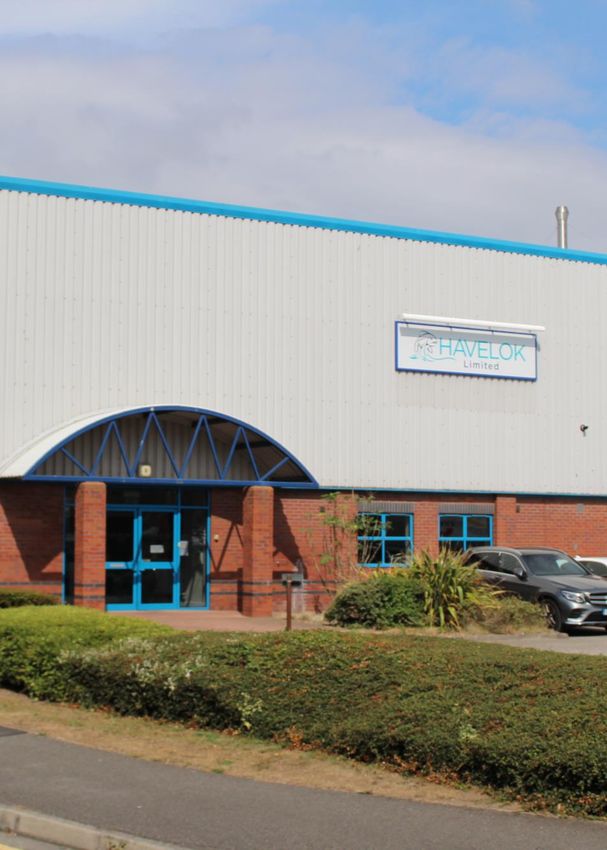
October 2019
                                                Strong growth history
  Main Market Listing and
  Offering of new shares                        expected to continue

                                                                       Group targeting €20m PBT                                                 11.0-11.8

           €431 m.
                                                                                                                                        10.8
                                                                       within the next 3-5 years

             Annual revenues
                 2018*                                                                                                        7.4

          €10.8 m.                                                                                 3.3          3.5          345.9
                                                                                                                                        431.3    446.4

              Normalised PBT                                                2.9
                                                                                          258.4   246.3        249.1
                  2018*                                                   252.0
                                                                                           1.0

                                                                           2014           2015    2016         2017          2018       2018P    2019E

*2018 management proforma, adjusted for a whole year effect of Oceanpath and Solo acquisitions            Revenues     Normalised PBT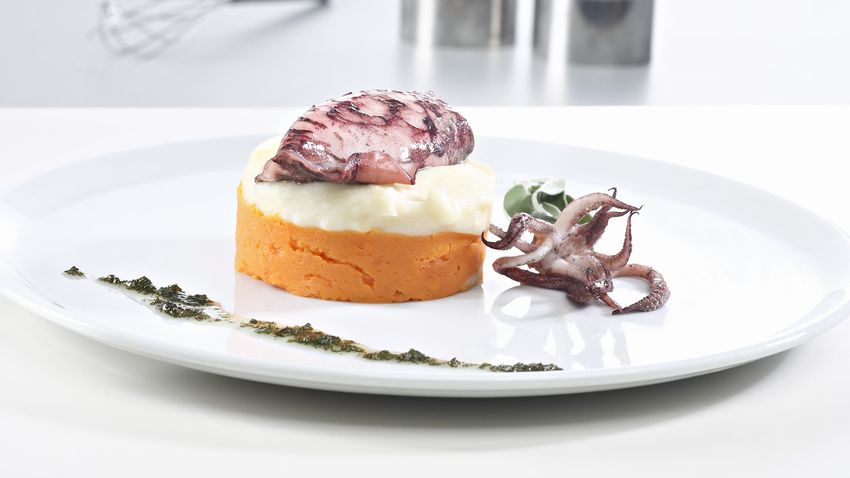
Iceland Seafood
Financials
Share Offering
October 2019
                                                        Seafood is the #1 consumed
Main Market Listing and
Offering of new shares                                  animal protein worldwide
                                                                                                  Global consumption split per capita
                  Seafood leads the way in global
                                                                                                  (Kg, 2018, %)
                                                                                                                                                                             Pork

                  human consumption per capita                                                                                             Seafood
                                                                                                                                                                          22%
                                                                                                                                                     37%
                 with developing countries driving                                                Seafood accounts for
                                                                                                   about 37% of global
                 total consumption growth with a                                                    consumption per
                                                                                                         capita
                                                                                                                                                                             12% Beef and Veal

                  CAGR of 1.1% between 2018 and                                                                                                      3%
                                                                                                                                            Sheepmeat              26%
                     2028 (developed 0.35%)                                                                                                                          Poultry

Total production per year                                                                        Global human consumption per capita
Tonnes million                                          1.0%                                     (kg/yr)

                                                               189   191    191   194   196
                                     180    181   185   187
                  173    178   179
   164     166                                                                                                              24
                                                                                                                                                                                     Seafood
                                                                                  101   102                                 20
                         83    85     88    90     93    95    96    98     99
    73     76     80
                                                                                                        Seafood             16                                                       Poultry
                                                                                                    consumption is          12                                                       Pork
                                                                                                      expected to
                                                                                                                             8
    92     89     93     95    93     92     91    91    93    93    93     92    94    94        continue to increase                                                               Beef and veal
                                                                                                                             4
                                                                                                                                                                                     Sheepmeat
                                                                                                                             0
   2015   2016    2017   2018 2019E 2020E 2021E 2022E 2023E 2024E 2025E 2026E 2027E 2028E                                    2000   2004    2008   2012    2016   2020E   2024E   2028E

                               Fish from aquaculture    Fish from capture

The term “Seafood” indicates fish, crustaceans, molluscs and other aquatic animals, but excludes aquatic mammals, crocodiles, caimans, alligators and aquatic plants
Source: FAO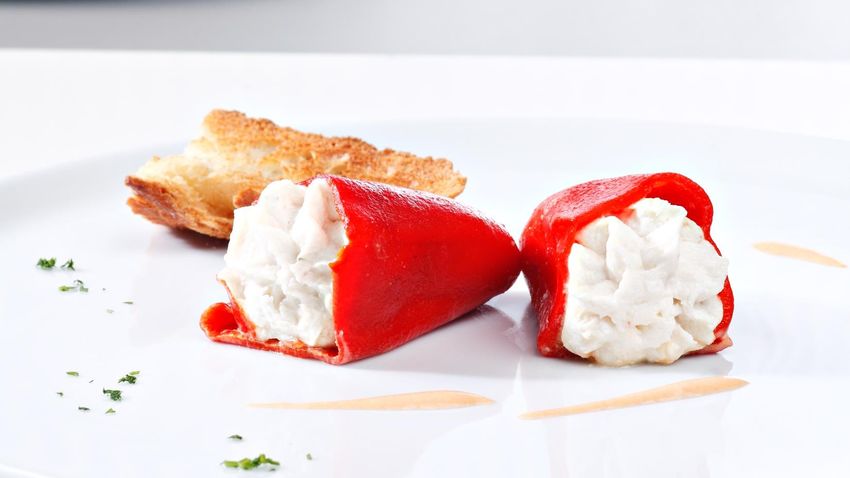
October 2019
                                                Seafood consumption will continue
Main Market Listing and
Offering of new shares                          to grow alongside global trends
  Drive towards healthy living                                                                    A growing middle class
                                                                                         20.8%    A growing middle class is expected to            2015                  2030
  Having relegated health concerns in
  the aftermath of the 2008 recession,                                                            increase from one-third to two-thirds
  health awareness and the nutritional                                   14,5%                    of the world's population by 2030.                                 14,5%
  aspects of food have regained ground                                          14.5%                                                        41%                      36%
  and the world has seen a noticeable                                                             These     individuals   are   health-
                                                                                                                                                          59%                   64%
  drive towards healthy living, where5 , 8 %          6,2%      7,3%                              conscious, generally have the highest
                                                                                                                                      5,8%     6,2%         7,3%
  governments are encouraging people                                   7.3%                       disposable income and are willing to
  to eat more seafood. Consumers are                 5.8%    6.2%
                                                                                                  pay a premium for what they
  becoming more selective in their food
  choices and millennials lifestyles are                                                          perceive to be healthier consumption
                                                                                                                                                          Middle class   Rest
  healthier                                                                                       choices
                                                     Beef    Lamb      Pork Chicken       Fish

Older western population                                                                         Higher need for food solutions
                                                    39%       41%        44%            46%
  An ageing population is also an                                                                 A higher need for food solutions that
  advantage for the seafood sector as                                                             are easy and quick to prepare, tasty
  studies have shown that individuals                                                             and    innovative,  right   for   the
  over 50 years old consume 24,9%                                                                 consumer, the environment and
  more fish per week than individuals                                                             consumers' social standards
  under 30                                          2015      2020       2030       2050

                                                             0-14    15-50    +50

Source: FAO, Seafish.org, Eurostat, Brookings.edu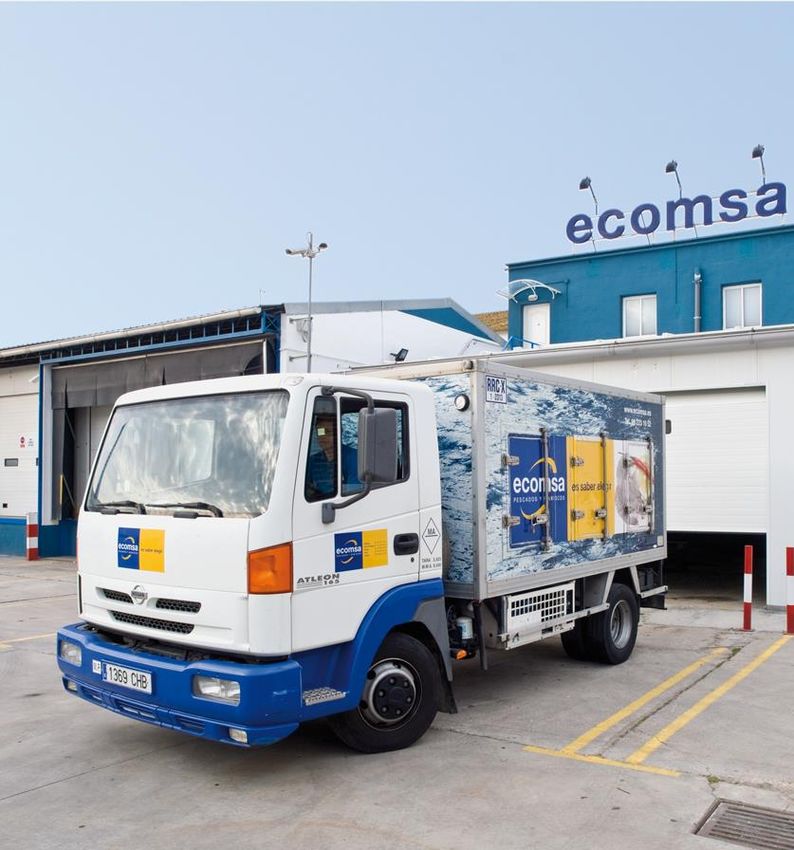
October 2019
  Main Market Listing and
  Offering of new shares            An integrated value chain
                                                               Presence through strategic alliances and cooperation

                                       Strategic investor operations                      Iceland Seafood‘s operations                             Customers

Iceland Seafood is in a
   unique position to
   benefit from close
    cooperation with
 strategic partners and                                    Primary                   Sales &                     Production,                     Retail,
                                  Capture
    proximity to the                                      Production               Distribution                  value added                   Foodservice
 markets and efficient
value added operations

                            Four major fishing and    Iceland Seafood          Iceland Seafood’s Sales       Iceland Seafood’s Value       Iceland Seafood’s Value
                            processing companies      purchases primary        and Distribution segment      Added segments create         Added segments sell
                            are in the shareholder    processed products       sells products to a variety   additional value by further   their products to
                            group, creating a         from its suppliers and   of customers around the       processing primary            HORECA distributors,
                            vertically integrated     shareholders             world                         processed products close      retailers and
                            supply chain through to                                                          to their customers to suit    foodservice companies
                            the end consumer                                                                 their needs
October 2019
Diverse and valuable
Main Market Listing and
Offering of new shares shareholder knowledge
Sjávarsýn ehf.
11%
Other
31%
Nesfiskur ehf. Sector investors provide Iceland Seafood with
10%
valuable sourcing capabilities, sector
knowledge and vertical integration
326 10% FISK-Seafood ehf.
Shareholders
Institutional investors provide Iceland Seafood
3% with valuable market knowledge, guidance and
Birta lífeyrissjóður
access to funding
4% 10%
Kvika banki hf. Jakob Valgeir ehf
4%
Arion banki hf. 4%
9%
Lífsverk lífeyrissjóður 4%
Frjálsi lífeyrissjóðurinn Solo Holding ehf.
Shareholders list as of 1 October 2019October 2019
Main Market Listing and
Offering of new shares Diversified product range
Ready Meals Fresh Coated products Shellfish Smoked Fish Landfrozen
Solutions for HORECA, Cod, Haddock, Wolffish, Skin- & boneless battered Shrimp, Langoustines, Salmon, Arctic Charr, Cod, Cod, Haddock, Wolffish,
Catering and retail Halibut, loins, portions, fish, breaded, main course Norway Lobster, Mussels Haddock and Herring Halibut, loins, portions,
backfillets, whole and and children products and more backfillets, whole and
more more
Light salted Wet salted Frozen at sea Pelagic fish Dried products Cephalopods
Cod, Ling, Tusk, Saithe, Cod, Ling, Tusk, Saithe, Cod fillets, Haddock fillets, Mackerel, Atlantic Herring, Haddock, Cod, Skate and Cuttlefish, Octopus and
lions, fillets and portions loins, fillets and portions Saithe fillets and Red fish Capelin and Blue Whiting Blue Whiting SquidOperating divisions
Strong combination of sourcing
October 2019
                                         expertise and well positioned
Main Market Listing and
Offering of new shares                   value added activities
                          Iceland Seafood International
                               Executive management

         Sales &                 Value Added N-           Value Added S-
       Distribution                  Europe                   Europe
                                                                            Each division and subsidiary possesses valuable knowledge of its
                                                                           specific operations and locale, business relationships and industry
                                                                            contacts which the Group utilizes to benefit the Issuer as whole
   IS Iceland                  IS Barraclough         IS Spain
                                                                            Additionally, Sales & Distribution provides valuable sourcing and
                                                                                  product quality stability to the Value Added divisions
   IS France                   Havelok                Icelandic Iberica    Each operating division therefore benefits from the operations of
                                                                              the others, creating synergies, while maintaining focus on
                                                                                                 specialized operations
   IS Germany                  Oceanpath              Ecomsa

   IS USA                      Dunn‘s of Dublin       Achernar

Employees

            37 (6%)                226 (37%)                354 (57%)
October 2019
Profitability is driven by
Main Market Listing and
Offering of new shares value added activities
Turnover Profit before
tax 1
Sales & Distribution is the
29% 26%
2013 2013
71% 74% backbone of the Group and
supports value added activities,
9%
which drive profitability
39%
2018P 2018P
61%
91%
Sales & Distribution Value Added
1: Normalised PBT represents Profits before tax before allowing for significant items and discontinued operations. 2018P (proforma) based upon 2018 actuals as Oceanpath
and Solo Seafood were owned for the full yearOctober 2019
Strong team of experienced
Main Market Listing and
Offering of new shares sourcing and sales experts
Sales and Distribution division
• The Sales and Distribution division represents Iceland Seafood’s origins as a sales and marketing company with its main operations in Iceland along with
closely linked sister companies in France, Germany and the USA
• A close working relationship with seafood industry partners and in-depth industry knowledge provide Iceland Seafood’s Value Added operations with valuable
sourcing and consistent quality
• Iceland Seafood offers its customers and suppliers a full seafood solution by sourcing seafood from various suppliers, largely based in Iceland, separating
itself from competitors offering both broader and more specialised product ranges
2018 Sales by Species Main Markets1 Key Figures
1 Excluding intercompany sales EUR 000
Others France 183,211 183,211
170,507 164,589
Other 20% 20%
29%
Cod 102,260
40% Italy 4% 1,515
1,535
Japan 4% 1,181 1,181
15% USA 1,029
5%
7% Germany
Herring 5%
8% Lithuania 7% 11%
Haddock 15% 8% 2016 2017 2018 2018P 2019 1H
Belgium Ukraine
Mackerel UK Revenues Normalised PBTOctober 2019
Close cooperation with retail and
Main Market Listing and
Offering of new shares foodservice customers
Value Added Northern Europe division
• Iceland Seafood’s Value Added N-Europe division has operations in Ireland and the UK through three subsidiaries
o Retail focused IS Barraclough,
o Foodservice focused IS Havelok, which is a leading seafood supplier to the foodservices sector in the UK
o Oceanpath, the largest fresh seafood processor to Irish retailers, and subsidiary Dunn’s of Dublin, a producer of fresh and smoked seafood for Irish retailers
• The division focuses on value added production of seafood such as hot and cold smoking, breading, filleting and portioning and various ready to eat products
Example of final product Sales Key Figures
EUR 000
Retail fresh/smoked 103,352
97,387
5,203
35% 4,587
Retail frozen 45% 56,228
45,109 48,292
1,289
1,485 1,550
20%
2016 2017 2018 2018P 2019 1H
Foodservice
Revenues Normalised PBTOctober 2019
Excellent position within the
Main Market Listing and
Offering of new shares largest market for Icelandic Cod
Value Added Southern Europe division
• The Value Added S-Europe division has operations in Barcelona and Malaga in Spain and in Argentina. The division is the largest importer and seller of
Icelandic light salted cod in the Mediterranean market
• The merger of Iceland Seafood Spain and the newly acquired Icelandic Ibérica will create a South European powerhouse with a strong brand and product
recognition in the market, highly qualified people and a loyal customer base
• The division focuses on value added production of seafood such as traditional and light salted cod in fillets and portions, argentinian shrimp and various
ready to eat products
Main Brands Main Markets 1 Key Figures
1 Excluding sales from S&D to Italy and Portugal EUR 000
Others
Portugal 179,489
6%
4%
Italy
15% 100,111 6,696 96,797
62,146 62,017
3,838
3,524
2,000 2,018
75%
2016 2017 2018 2018P 2019 1H
Spain
Revenues Normalised PBTKey projects
October 2019
Main Market Listing and
Offering of new shares                       2018: Year of transformation

                          Acquisition of Oceanpath                                               Acquisition of Solo Seafood
           Iceland Seafood acquired a 67% share in the leading fresh fish             The acquisition of Solo Seafood, the owner of Icelandic Iberica was
           supplier to retailers in the Republic of Ireland, with local               a transformational step for Iceland Seafood. The acquisition
           management keeping the remaining 33%. The acquisition is in line           brought three major fishing and processing companies into the
           with the Group’s strategy of acquiring strong value added                  shareholding group, creating a vertically integrated supply chain
           companies                                                                  through to the end customer

               Oceanpath can utilize Iceland’s seafood sourcing network in addition        Three major fishing and processing companies joining the
               to having enhanced opportunities for global distribution through the        shareholder group enables Iceland Seafood to benefit from a
               Group’s extensive sales network                                             vertically integrated supply chain and further strengthens its
                                                                                           supplier relationships

               Iceland Seafood’s other subsidiaries will gain from a knowledge              The integrated value chain which gives the Group access to over
               transfer from Oceanpath’s seasoned professionals                             40,000 mt of fish and seafood products

               Investment of €2.9m in 2019 to increase efficiency and support               Consolidated market strength especially in Spain, with a merger
               further domestic growth                                                      of Icelandic Iberica and Iceland Seafood Spain
October 2019
Key projects to further drive
Main Market Listing and
Offering of new shares growth and efficiency
Merger of Icelandic Investment in Opportunities for
Iberica and IS Spain Achernar, Argentina automation
• Magnús Jonsson appointed as MD • In 1H 2019, the board approved an • The company has and will continue
for the merged entity and new investment project for Achernar to seek opportunities for enhanced
management team formed • The new building will consist of a automation and efficiency in its
• Significant opportunities of coldstore and a new production area operations
economies of scale and scope, • Investment will increase production • In 2019 Oceanpath’s fresh fish
integration and optimization of capacity by ca. 50%, secure storage production facility was extended by
functions and processes space, make logistics more efficient 1,258m2 and a Marel salmon filleting
• Estimated annual synergies of EUR and improve quality controls line was installed
3.0-3.5m, expected to materialize in • Total investment in the range of • Automation opportunities of all sizes
full before 2021 €1.3-1.6m are regularly being assessed and
prioritized within the GroupIceland Seafood Financials Share Offering
October 2019
                                       Encouraging growth driven by
Main Market Listing and
Offering of new shares                 strategic acquisitions
 Increase in revenue by                Growth driven by                      P&L (EURm)                                    2016          2017           2018         2018P          2019E
                                                                               Sales                                         246.3         249.2          346.0          431.3         446.4
 80% and PBT of 234%-                  strategic acquisition
                                                                               Net margin                                       19.0          19.5           29.0          41.0          43.4
 258% from 2016                                                                PBT*                                              3.3            3.5           7.2          10.9           11.4
 • Revenue Increase driven by          • Oceanpath is a leading fresh fish     Net profit                                        2.6            2.6           4.7           7.6            7.3

    increased value added activities     supplier to retailers in Ireland
                                                                               Sales increase                               (4.7%)           1.2%        38.8%          73.1%           3.5%
    increasing the companies
                                                                               Net margin                                     7.7%           7.8%            8.4%        9.5%           9.7%
    margins                                                                    PBT margin*                                     1.3%          1.4%            2.1%         2.5%          2.6%
 • PBT margin increased from 1.3%                                              Net profit margin                               1.0%          1.0%            1.4%         1.8%           1.6%

    in 2016 to an estimated 2.6% in
                                       • Solo Seafood consists of the        *Normalized PBT represents profits before tax before allowing for significant items and discontinued operations.
                                                                             2018P (proforma) based upon 2018 actuals as Oceanpath and Solo Seafood were owned for the full year
    2019
                                         companies Icelandic Iberica and
                                                                                                                Sales and PBT Growth (EURm)
                                         Ecomsa in Spain and Achernar in
 Group’s target of a                                                         500                                                                                                         5.0%

                                         Argentina
 PBT of EUR 20m in the                                                       400                                                                       248                 261           4.0%

 next 3-5 years                                                              300                                                   163
                                                                                                                                                      2.5%                2.6%
                                                                                                                                                                                         3.0%

                                                                             200           76                  85                 2.1%                                                   2.0%
 • Driven by synergies following                                                          1.3%                1.4%
                                                                             100           171                165                  183                 183                 185           1.0%
    recent acquisitions and organic
                                                                               0                                                                                                         0.0%
    investments                                                                          2016                 2017                2018                2018P               2019E

                                                                                             Sales & Distribution (S&D)            Value Added (VA)               PBT* margin (right axis)
October 2019
Solid financial position, good
Main Market Listing and
Offering of new shares platform for future growth
Comparative asset increase explained by working Equity ratio increasing from about 20% in 2017
capital requirements of value added segment to an estimated 40% by year-end 2019
• Total assets (excl. intangible assets and cash) have increased by ca. 140% • Equity ratio is estimated to be ca. 40% at year-end, following a proposed
from 2016 compared to a revenue increase of 80%, as the revenue equity increase and increased profitability
increase has been driven by value added activities, requiring more • Minority stake is owned by the management of Oceanpath and
inventory than S&D Havelock, who own 33% in each company respectively
• Goodwill has almost quadrupled with most recent acquisitions
Assets (EURm) 2016 2017 2018 2019E Equity & liabilities (EURm) 2016 2017 2018 2019E
Property, plant and equipment 8.7 8.5 14.4 20.4 Equity 15.4 17.7 59.3 81.1
Intangible assets 9.0 8.9 44.7 44.5 Thereof minority stake 0.1 0.1 2.9 3.9
Other long-term assets 1.2 1.6 2.7 2.4 Equity ratio 20.5% 20.1% 30.6% 39.7%
Total non-current assets 18.9 18.9 61.8 67.3
Non-current borrowings 1.6 0.9 6.6 8.3
Inventories 20.0 30.6 62.1 65.8 Other non-current liabilities 0.4 0.6 1.7 5.4
Trade and other receivables 32.9 35.1 62.5 64.7 Current borrowings 34.9 40.2 75.8 57.6
Other current assets 1.4 1.3 3.5 3.5 Trade and other payables 19.6 25.6 44.9 46.1
Cash and cash equivalents 1.8 2.2 4.0 2.8 Other current liabilities 3.2 3.1 5.4 5.5
Total current assets 56.2 69.2 132.0 136.8 Total liabilities 59.7 70.4 134.5 123.0
Total assets 75.0 88.2 193.8 204.1 Total equity and liabilities 75.0 88.2 193.8 204.1October 2019
Strong profit growth driven by
Main Market Listing and
Offering of new shares value added activities
Increased focused on value added activities Increased focus on value added activities a
driver of increased margins and PBT
• In 2016 value added activities accounted for EUR 76m or about 31% of • PBT is expected to have more than tripled at year-end compared to 2016
total revenue with the margin doubling at the same time. This development is
• In 2019 value added activities are expected to account for about EUR expected to continue with PBT growing to EUR 20m in the next 3-5 years
261m or about 59% of total revenue
• This reflects the group management’s increased focus on value added
activities
Revenue by segments (EURm) Profit before tax - PBT (EURm)
500 12 3.5%
11.0-11.8
10 3.0%
400
2.5% 2.6% 2.5%
261 8
300 248 2.1%
163 2.0%
6
76 85 10.9 1.5%
200 1.3% 1.4%
4 7.2 1.0%
100 171 165 183 183 185 2 3.3 3.5 0.5%
0 0 0.0%
2016 2017 2018 2018P 2019E 2016 2017 2018 2018P 2019E
Sales & Distribution (S&D) Value Added (VA) PBT* PBT margin*
*Normalized PBT represents profits before tax before allowing for significant items and discontinued operations.
2018P (proforma) based upon 2018 actuals as Oceanpath and Solo Seafood were owned for the full yearSummary
October 2019
                                         Strong platform for
Main Market Listing and
Offering of new shares                   continuing profit growth

                                                   Continuing organic growth                              External Growth
        Scalable sourcing network
                                                    and improved efficiency                                opportunities

      • The Group will continue its focus on      • Synergies through integration of new        • The Group remains on the lookout for
        building up closer cooperation with the     companies, increased profitability and        strategic investments in well positioned
        supplier base in Iceland                    investment in organic growth is expected      companies

      • At the same time the Group will utilise     to increase the Group’s profit before tax      o Room for consolidation in European seafood

        the unique sales network and strong         to EUR 20m in the next 3-5 years                  sector

        market presence to expand the global      • Various opportunities for further              o Opportunities for bolt on acquisitions in

        sourcing base                               automatisation in addition to currently           current markets

                                                    unutilised capacity to drive growth         • The proposed equity increase will support
                                                                                                  the Group’s ability to maximize these
                                                                                                  opportunities
Iceland Seafood Financials Share Offering
October 2019
        Main Market Listing and
        Offering of new shares                        Shares and shareholders
         Share capital                                                             Nasdaq First North
         •     The total share capital of Iceland Seafood is ISK                   •   The Company has been listed on Nasdaq First North
               2,336,344,934 in nominal value                                          since 25 May 2016
         •     Capital increase authorizations amount to a nominal                 •   The Shares' ticker symbol in the trading system of
               value of ISK 352,583,145, corresponding to 13.1% of                     Nasdaq Iceland is ICESEA
               total issued capital post dilution
                                                                                   •   Iceland Seafood has two market making contracts,
         •     Thereof, 225,000,000 shares will be issued and sold                     with Kvika banki hf. and Arion banki hf.
               in a public offering in relation to the listing, which
               amounts to 9.63% of share capital pre-dilution and

                                                                                                                                            326
               8.78% post dilution
         •     The Issuer had 326 shareholders at 1 October 2019

                                                                                                                                            Shareholders

                                                                                                                                                              9.62
                                                                                                                                                          September
    Share price development                                                                                                                                    2019
    Monthly average

 5.46                                                               6.78                                          7.81                                     8.80
    5.46                                                               6.78                                       7.81                         8.80       July 2019
May 2016
    May 2016                                                       July July
                                                                        20172017                                 July
                                                                                                                 July 2018
                                                                                                                      2018                    July 2019
October 2019
Public Offering of new
Main Market Listing and
Offering of new shares shares
Purpose of the Registration of
225,000,000 new shares will be issued and Offering subscriptions
sold by Iceland Seafood in a public offering, • Strengthen the Issuer's financial • Subscriptions shall be registered
equivalent to 9.63% of the Issuer's share position electronically on a special
capital pre-dilution and 8.78% post dilution • Move closer to the Issuer's goal subscription form available on
of having a 35% equity ratio www.kvika.is from 16 October
Subscriptions will be offered in two order 2019
• Facilitate increased liquidity of
books, which differ in terms of size of
the shares • Subscriptions will not be
subscription, pricing and rules of allocation
• Establish a more diverse accepted in any other format.
shareholder base • The subscription form will be
available in English and Icelandic
16. October 2019 17. October 2019 18. October 2019 21. October 2019 22. October 2019 25. October 2019 29. October 2019
12:00 GMT Subscription 16:00 GMT Information on Final due date
Offering results First expected
Subscription period period Subscription allocation sent for payment of
published day of trading
begins continues period ends to investors subscriptionsOctober 2019 Main Market Listing and Offering of new shares Pricing and size benchmarks Order book A Order book B • A total of 30,000,000 Shares, or • Order book A will be for • A total of 195,000,000 Shares, or • Order book B is for subscriptions 1.17% of issued share capital in subscriptions ranging from ISK 7.61% of issued share capital in which are a minimum of ISK Iceland Seafood post dilution, 9.40-9.82 price per Share Iceland Seafood post dilution, 9.40 price per Share and no are offered for sale in Order • All shares sold in Order book A are offered for sale in Order maximum price is specified by book A will be allocated at the same book B the Seller • The minimum size of price (Offering Price A) which will • The minimum size of • All Shares sold in Order book B subscriptions in Order book A is be within the above price range subscriptions in Order book B is will be allocated at the same restricted to Shares with a • The Offering Price in Order book a purchase value of ISK price (Offering Price B) which will purchase value of ISK 100,000 A will not be higher than the 10,000,001 be higher or equal to the • The maximum size of Offering Price in Order book B • The maximum size of each aforementioned minimum price subscriptions in Order book A is subscription is only limited by restricted to a purchase value of the aforementioned supply in ISK 10,000,000 this Order book
October 2019
    Main Market Listing and
    Offering of new shares                                   Allocation and reductions
                                                                                                         Order book A                                          Order book B
At the end of the subscription period the Issuer will
                                                                                                        • 1) Subscriptions in Order book A will                • The main rule when allocating shares
have sole discretion to decide the price at which the
shares will be sold in each order book                                                                      be reduced (in part or rejected) to                  in Order book B is that subscriptions
                                                                                                            subscriptions with the highest price                 are assessed on the basis of price.
When allocating the Shares the objective of the                                                             per share                                            Subscriptions in Order book B will be
Offering will be taken into account, i.e. encouraging                                                                                                            reduced (in part or rejected) so that
                                                                                                        • 2) Remaining subscriptions will be
increased liquidity of Shares and creating a more
                                                                                                            reduced by up to 75% of the original                 what remains are the subscriptions
diverse shareholder base.
                                                                                                            subscription                                         received with the highest price per

In the event that the combined number of Shares of                                                           o Proportional reductions will not be               Share, so that the combined number
valid subscriptions exceeds the number of Shares                                                                 applied to subscriptions of a purchase          of Shares (based on the final Offering
that the Issuer has available to sell, the Issuer will                                                           value of ISK 500,000 or lower and will not      Price B) in all valid subscriptions in
allocate Shares to individual subscribers after the                                                                                                              Order book B after reduction is equal
                                                                                                                 result in a reduction to a value lower
following reductions have been made*:
                                                                                                                 than ISK 500,000                                to the number of Shares which the

                                                                                                        • 3)      Subscriptions        will     be   further     Issuer decides to offer investors who

                                                                                                            reduced by flat rate reductions                      have subscribed for Shares in Order
                                                                                                                                                                 book B
 *The Issuer reserves the right to reject individual subscriptions in Order Book A and/or B, in part or in full, for other reasons than those
 specified in the above rules on reductions.
Appendix I General Information
Sales and
Distribution
October 2019
Main Market Listing and
Offering of new shares              Sales & Distribution

Sales and Distribution offers its customers a full
seafood solution by sourcing seafood from various
                                                               Iceland Seafood ehf.
suppliers, largely based in Iceland. The segment
consists of a sales and marketing company in Iceland
along with closely linked sister companies in France,
                                                             Iceland Seafood France
Germany and the USA

Sales and Distribution boasts deep access to markets
                                                             Iceland Seafood Germany
and   a   close    working   relationship   with   seafood
industry partners in Iceland, creating a backbone for
the Issuer’s operations as a whole                             Iceland Seafood USA
October 2019
Sales & Distribution
Main Market Listing and
Offering of new shares Subsidiaries
Iceland Seafood ehf. Iceland Seafood Iceland Seafood Iceland Seafood
France Germany USA
Located in Reykjavik, IS Iceland is a leading Located in Boulogne-Sur- Located in Bremerhaven Located in Branford,
company in exports of seafood from Iceland to all Mer, provides high quality Germany, IS Germany is a Connecticut, IS USA imports,
main markets around the world. IS Iceland's main seafood from Iceland as supplier of high-quality fresh maintains inventory and
functions are fish sales, sourcing for the Group’s well as from Canada, USA, seafood from Iceland. Fresh markets a full range of Cod,
foreign subsidiaries and to provide technical and South Africa, Namibia, New fish is mainly sourced from Haddock, and Pollock/Saithe
quality services for producers and customers. Zealand and Asia. The Iceland for the delicatessen, products for the distributor,
company supplies fresh and food service, catering and foodservice and restaurant
IS Iceland works with a broad range of producers
frozen products to retail sectors in Germany industry in the USA. Products
in Iceland, from many of the largest quota owners
foodservice, retail and are imported directly from
to smaller independent operators focused on a
processors in France Iceland, Russia and China
single species or product. Most supply
relationships are long-term multi-year
relationships built on trust and transparency
where a bridge has been built between a catcher
and end customerValue Added
October 2019
Main Market Listing and
Offering of new shares         Value Added N-Europe
Iceland Seafood’s Value Added N-
                                                 Iceland Seafood Barraclough
Europe segment consists of four
subsidiaries in the UK and Ireland.
                                                   Iceland Seafood Havelok
The         segment       is   retail   and
foodservice               focused       and
                                                 Iceland Seafood Oceanpath
produces various products for the
UK and Ireland markets
                                               Iceland Seafood Dunn’s of Dublin
October 2019
Main Market Listing and
Offering of new shares Iceland Seafood Barraclough
Processing Final Products
Main customers
are large
retailers in the
UK
• Filleting, cutting and portioning, • Frozen for retail, ready to eat,
further processed products, ready to cook sold under retailer
packaging for retailers own brandsOctober 2019
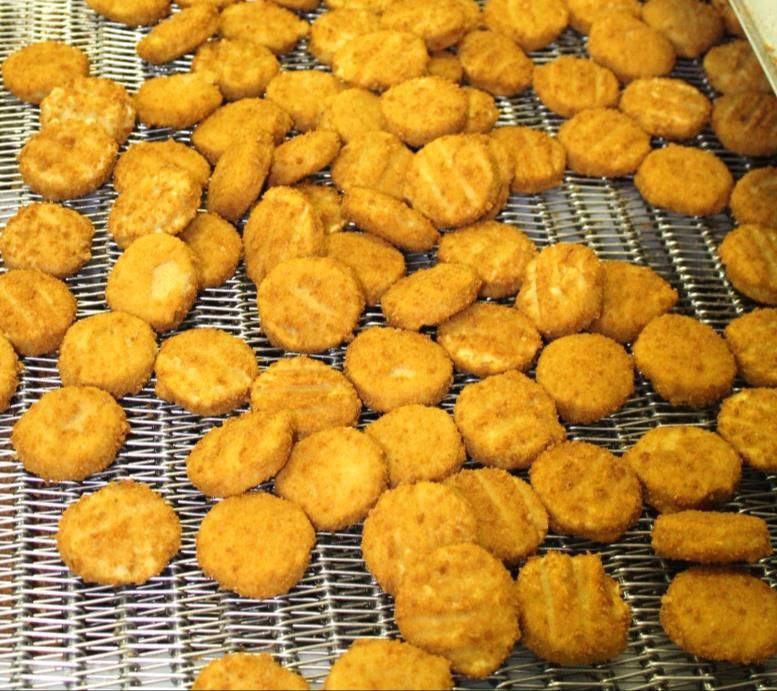
Main Market Listing and
Offering of new shares Iceland Seafood Havelok
Processing Final Products
Main customers are
various foodservice
vehicles in the UK
• Filleting, cutting and portioning, • Skinless and boneless battered
breading, ready to cook, ready to fish, breaded fish, frozen cod,
eat haddock and plaice, specialities
portions and fish cakes,
children’s productsOctober 2019
Main Market Listing and
Offering of new shares Iceland Seafood Oceanpath
Processing Final Products
Main customers
are large retailers
in Ireland and
fishmongers
• Filleting, cutting and portioning, • Fresh fish on fishmonger tables
packaging for consumers at supermarketsOctober 2019
Iceland Seafood Dunn’s of
Main Market Listing and
Offering of new shares Dublin
Processing Final Products
Main customers
are large retailers
in Ireland and
fishmongers
• Smoking, cutting and portioning, • Hot and cold Smoked salmon
further processed products, and mackerel in various
packaging for consumers packs/sizes, prawn cocktail, own
brand and store brandOctober 2019
Main Market Listing and
Offering of new shares Value Added S-Europe
Iceland Seafood’s Value Added S-
Iceland Seafood Spain
Europe segment consists of four
subsidiaries in Spain and
Icelandic Ibérica
Argentina, with an impending
merger of Iceland Seafood Spain
Iceland Seafood Ecomsa
and Icelandic Ibérica
Iceland Seafood AchernarOctober 2019
Main Market Listing and
Offering of new shares Iceland Seafood Spain
Processing Final Products
Diversified
customer base
mainly within the
HORECA sector in
S-Europe
• Cutting, portioning and packing, • Frozen lightsalted cod products
with focus on lightsalted and • Traditional wet salted cod
wetsalted cod products products
• Diversified product range
sourced from different areas
around the worldOctober 2019
Main Market Listing and
Offering of new shares Icelandic Ibérica
Processing Final Products
Diversified
customer base
mainly within the
HORECA sector in
S-Europe
• Cutting, portioning and packing, • Frozen lightsalted cod products
with focus on lightsalted cod • Argentinean red shrimp from
products Achernar
• Diversified product range
sourced from different areas
around the worldOctober 2019
Main Market Listing and
Offering of new shares Iceland Seafood Ecomsa
Processing Final Products
Service work for
Icelandic, direct
distribution to Hotels
and restaurants in
the South of Spain
• Cutting of frozen lightsalted cod, • Diversified product range that
processing and packing of serves the customers’ needs
diversified product rangeOctober 2019
Main Market Listing and
Offering of new shares Iceland Seafood Achernar
Processing Final Products
Products distributed
by Icelandic Iberica,
into the HORECA
sector in S-Europe and
export to China
• Factory specialized in processing • Argentinian red shrimp in
of Argentinean red shrimp different formSourcing and sales network
October 2019
                                            Iceland Seafood’s sourcing
     Main Market Listing and
     Offering of new shares                 network
 Sourcing network
 • Hand in hand with an extensive network
   of highly qualified professionals
 • Selected providers around the globe to
   extend our product offering
 • Close relationship with a solid global
   customer base that appreciates
   availability and fulfilment
 • Iceland accounts for approximately 55%
   of all sourcing

 • The Group works with a broad range of
   Icelandic producers

A sourcing network that offers reliable market and customer access
October 2019
Main Market Listing and
Offering of new shares CSR & Sustainability
ISI believes that
sustainability and
responsible ocean believes
Iceland Seafood
stewardship is its and
that sustainability
corporate
responsiblesocial
ocean
responsibility
stewardship and is its
actively develops
corporate socialand
supports initiatives
responsibility and that FAO Code of conduct Iceland Responsible Fisheries MSC
positively influence and
actively develops Iceland Seafood works according The FAO based Iceland Developed by the Marine
sustainable fishing that
supports initiatives to the FAO code of conduct for Responsible fisheries management Stewardship Council, the MSC
practices.
positively influence responsible fisheries (FAO 2005). certification programme is a third label recognizes that a product
sustainable fishing Most responsible fishing nations party verification model used to comes from a sustainable fishery
practices are working in conformance with verify responsible fisheries that has met the MSC Fisheries
the FAO code of conduct and have management in Icelandic waters Standard which measures the
issued quota or have other means and good treatment of marine sustainability of wild-capture
of regulating fishing within their resources. Founded in 2012 by fisheries
own fishing zones Iceland Seafood and key suppliersOctober 2019
Responsible Ocean
Main Market Listing and
Offering of new shares Stewardship
Iceland Seafood has set a global sourcing policy based on responsible ocean stewardship
founded on the following principles:
Commitment to supply sustainable seafood to Source only from fisheries in conformity with
customers and support customers to make FAO Codes of Conduct and have proper fishery
sustainable choices management systems
Support independent and credible standards set
Commitment to working with industry on fishery
to audit and approve well managed fisheries and
improvements and best practices
promote these fisheries to customersOctober 2019
Iceland Seafood’s sales
Main Market Listing and
Offering of new shares Network
Sales network
• Iceland Seafood works
closely with a solid global
HQ
customer base that
appreciates availability
and fulfilment
Operational presence
• Headquarters in Iceland
• Sales and Distribution in
Iceland, Germany, France and
the US
• Value added factories in UK,
Ireland, Spain and Argentina
A sales network that offers reliable high quality sourcing and producer accessOctober 2019
Main Market Listing and
Offering of new shares Presence at international fairs
Presence at international fairs/expos is a key factor in Iceland Seafood’s marketing
strategy and enable the company to meet current and new customers, make sales
and connections and showcase its products and capabilities. Key events that the
company will be attending in 2019 have been main events in the seafood sector in
Europe and North America for years
Key presence in 2019
Global Seafood Brussels Conxemar in Spain
Global Seafood Boston TuttoFood ItalyBoard and Executive Management
October 2019
    Main Market Listing and
    Offering of new shares               Strategic and diverse Board
Following the acquisition of Solo Seafood in 2018, Iceland Seafood underwent
management changes where a new CEO and Board joined the Company

    Magnús Bjarnason                    Jakob Valgeir Flosason                 Liv Bergþórsdóttir                Ingunn Agnes Kro
    Chairman                            Board member                           Board member                      Alternate member

     Magnús     is   an   experienced   Jakob, who is the CEO of seafood       Liv   has    worked    in   the   Ingunn, a lawyer, was most
     specialist with an extensive       producer Jakob Valgeir ehf., has       telecommunications industry for   recently       Director       of
     background in finance, renewable   an extensive knowledge of the          20 years, 12 as CEO of Nova, a    Administration at listed company
     energy, seafood and government     Icelandic seafood industry from        company repeatedly awarded for    Skeljungur, heading internal and
     service                            all perspectives                       marketing and branding            external    communication    and
                                                                                                                 compliance
October 2019 Main Market Listing and Offering of new shares Experienced Management Bjarni Ármannsson Reynir Jónsson CEO CFO Bjarni has been the Group’s CEO Reynir Jónsson has been the since January 2019. Bjarni is a Group’s CFO since late 2013. significant investor in Iceland Seafood Before joining the Group, he International via his holding company worked as a Director and Partner Sjávarsýn. Bjarni is a computer at Deloitte Financial advisory engineer from the University of services for five years, where large Iceland in 1990 and graduated with an parts of his projects were related MBA from IMD in Switzerland in 1996. to the seafood sector in Iceland. Bjarni spent the lion share of his Prior to that, Reynir was the head career in the banking industry in of accounting at HB Grandi. Reynir Iceland, originally as a CEO for holds an MSc degree in Finance Kaupthing, an investment and and as a CEO of Islandsbanki – a and Strategic Management from and a Cand.oceon Degree in financial service company and later leading seafood service provider Copenhagen Business School and accounting from the University of for the Icelandic Investment bank out of Iceland Iceland
Appendix II
Financial Information
October 2019
                                                        Apparent margin increase of
Main Market Listing and
Offering of new shares                                  Value Added segment focus
   Increased focus on Value Added segments has                                                         Value Added segments generating an increased
   tripled net margin of the segments                                                                  percentage of Group’s profits
   • Following most recent acquisitions about 80% of the company’s margin is                           • In 2018 about 87% of normalized profit before tax (before allocation of
     generated by Value Added segments                                                                   head office costs) came from Value Added segments
   • The Value Added segment is strongly supported by the S&D segment and                              • The ratio is expected to increase as the company’s PBT growths to EUR
     close connections with the company’s largest suppliers and shareholders                             20m in the next 3-5 years as estimated
     securing highest quality raw material to the Value Added segments

                                           Net margin (EURm)                                                                                       PBT* before head office costs
    50                                                                                           90%      10                                                                                                                 100%
                                                                                                                                                                                                    87%                      90%
                                                               82%                   82%                   8                                                                                                                 80%
    40                                                                                           80%
                                                 75%                                                                         68%                                 70%                                                         70%
    30                                                                                           70%       6                                                                                                                 60%
                                                                                      35                                                                                                             8.1                     50%
                                                                34
             62%                    62%
    20                                            22                                             60%       4                                                                                                                 40%
                                                                                                                              3.3                                 3.5                                                        30%
             12                      12
    10                                                                                           50%       2                                                                                                                 20%
             7.2                    7.5           7.3           7.3                  8.0                                      1.5                                 1.5                                                        10%
                                                                                                                                                                                                     1.2
     0                                                                                           40%       0                                                                                                                 0%
            2016                    2017         2018          2018P                2019E                                    2016                                2017                              2018P
                   Net margin S&D              Net margin VA           VA's ratio (right axis)                            Sales & Distribution (S&D)                    Value Added (VA)                    VA's ratio

                                                                                                          *Normalized PBT represents profits before tax before allowing for significant items and discontinued operations.
                                                                                                          2018P (proforma) based upon 2018 actuals as Oceanpath and Solo Seafood were owned for the full year.
October 2019
Working capital and its
Main Market Listing and
Offering of new shares indebtedness
Market practice of shorter payment terms to Moderate indebtedness of inventory and
suppliers explains working capital needs receivables creates flexibility
• Inventory requirements and the fact that average payment terms with • In most recent years Iceland Seafood‘s indebtedness of inventory and
suppliers of seafood is shorter than the average payment terms of end receivables has been between 60-66% at year-end. This is well below
customers create a working capital need for companies like Iceland the maximum drawdown ratios
Seafood • Following the proposed equity increase, the ratio can be expected to be
• In most recent years Iceland Seafood‘s payables have amounted to 35- below 40% all else being equal
39% of its inventory and receivables. Part of working capital is debt
financed, largely in Spain with favourable terms, currently close to 1%
Working capital Working capital indebtedness
150 100% 150 100%
90%
120 80% 120 130 80%
70% 125
62 65 66%
90 60% 90 60% 60%
50% 51%
60 37% 39% 36% 35%
40% 60 39% 40%
30% 66
33 35 53
30 62 66 20% 30 64 20%
39 50
20 31 10% 35
0 0% 0 0%
2016 2017 2018 2019E 2016 2017 2018 2019E
Inventories Receivables Payables
Inventory and receivables Revolving credit Indebtness ratio (right axis)October 2019
Main Market Listing and
Offering of new shares Strong cashflow generation
Growth requires Financial activities
Cashflow (EURm) 2016 2017 2018 2019E
working capital Operating profit 4.5 4.6 7.9 13.8
• As a part of the company’s value • With increased working capital
Depreciation and amortization 0.8 0.9 1.3 2.2
added products are frozen and financial activities will increase
Other 0.0 (0.0) (0.3) 0.0
seasonal they require inventory • Investments in current Changes in working capital 2.3 (6.7) (0.9) (4.6)
build up operations, which is a key driver Cash from operations before interests and taxes 7.7 (1.2) 8.0 11.4
• As Iceland Seafood’s average in increasing the groups PBT to
Interest paid/received (1.4) (1.3) (2.0) (2.6)
payment terms with its suppliers EUR 20m in the next 3-5 years,
Income taxes paid (0.7) (0.8) (1.8) (2.1)
is shorter than their customers will partly be financed be debt
Net cash to discontinued operations 1.0 (0.0) (0.0) (1.7)
average payment terms growth • It is assumed the proposed Net cash generated by operating activities 6.5 (3.4) 4.1 5.0
increases working capital equity increase will be used to
Investing activities (1.2) (0.7) (9.9) (4.4)
• A large part of working capital is lower current debt which can be
Financial activities (6.1) 4.5 7.7 (1.5)
financed through local banks in increased again as needed when
Cash flow for the period (0.8) 0.4 1.8 (0.9)
Spain, currently at a margin of investment opportunities arise
*Cash flow assumes proposed equity increase will be used to temporally decrease debt instead of increasing cash.
about 1%You can also read