Impaired Performance of Broiler Chickens Fed Diets Naturally Contaminated with Moderate Levels of Deoxynivalenol - MDPI
←
→
Page content transcription
If your browser does not render page correctly, please read the page content below
toxins
Article
Impaired Performance of Broiler Chickens Fed Diets Naturally
Contaminated with Moderate Levels of Deoxynivalenol
Regiane R. Santos *               and Ellen van Eerden

                                          Department of Research and Development, Schothorst Feed Research, Meerkoetenweg 26,
                                          8218 NA Lelystad, The Netherlands; EvEerden@schothorst.nl
                                          * Correspondence: RSantos@schothorst.nl

                                          Abstract: Mycotoxin exposure is common in the poultry industry. Deoxynivalenol (DON) is usually
                                          detected at levels below the maximum threshold (5000 ppb), but depending on diet and age, broiler
                                          performance can be affected. We evaluated the effects of 900 ppb and 2300 ppb DON on the
                                          performance, intestinal morphometry, and lesion scores of broiler chickens. One-day-old male
                                          Ross broilers (n = 736) were divided into 4 treatments with 8 replicates each, and a pen containing
                                          23 birds was the experimental unit. The animals were fed diets naturally contaminated with two
                                          levels of DON: 900 (Low DON—LD) or 2300 (Moderate DON—MD) ppb, with or without activated
                                          charcoal, over 28 days. After this, all birds were fed a marginally DON-contaminated diet without
                                          charcoal. During the first 28 days, body weight gain (BWG) and feed conversion ratio (FCR) were
                                          significantly impaired when broilers were fed a MD diet without activated charcoal. Even after
                                          feeding a marginally contaminated diet from D28–35, birds previously fed the MD diet presented
                                          a significantly lower performance. The villus height:crypt depth (VH:CD) ratio was significantly
                                          higher in the ileum from 14-day-old broilers fed the MD when compared with the LD diet. At D28,
                                          the MD diet caused decreased villus height (VH) and increased crypt depth (CD), affecting VH:CD

                                          ratio in both intestinal segments, with higher levels in the jejunum from 28-day-old broilers fed a
                                   non-supplemented LD diet. Broiler production was negatively affected by DON, even at moderate
Citation: Santos, R.R.; van Eerden, E.    levels (2300 ppb).
Impaired Performance of Broiler
Chickens Fed Diets Naturally              Keywords: deoxynivalenol; Ross broilers; intestine; performance; carryover
Contaminated with Moderate Levels
of Deoxynivalenol. Toxins 2021, 13,       Key Contribution: This study evaluates the effect of low (900 ppb) and moderate (2300 ppb) levels
170. https://doi.org/10.3390/             of deoxynivalenol (DON) on the performance and intestinal integrity of broilers fed a diet with or
toxins13020170                            without activated charcoal as a toxin binder. Impaired performance was observed in broilers fed a
                                          diet containing 2300 ppb DON for 28 days. Although the replacement of the contaminated diet by
Received: 2 February 2021
                                          a diet marginally contaminated with DON mitigated the negative effect of DON after 1 week, the
Accepted: 19 February 2021
                                          losses related to the complete production period were not recovered. Furthermore, 2300 ppb DON
Published: 22 February 2021
                                          negatively affected intestinal morphology.

Publisher’s Note: MDPI stays neutral
with regard to jurisdictional claims in
published maps and institutional affil-
                                          1. Introduction
iations.
                                                Among the factors that negatively affect animal production, mycotoxins play an
                                          important role because these natural contaminants are ubiquitous contaminants in feeds
                                          and feedstuffs [1]. Besides this, cereal byproducts that are rejected for human consumption
Copyright: © 2021 by the authors.
                                          during processing for mycotoxin removal, as well as raw materials such as dried distillers’
Licensee MDPI, Basel, Switzerland.
                                          grains with solubles (DDGS), can enter the animal feed chain, increasing the exposure
This article is an open access article
                                          risk [2]. In most cases, contamination levels are low enough to ensure compliance with feed
distributed under the terms and           safety recommendations. However, mycotoxin contamination might still exert adverse
conditions of the Creative Commons        effects on animals, and, at an economic level, the major mycotoxins risks are linked to
Attribution (CC BY) license (https://     suboptimal production and not to disease.
creativecommons.org/licenses/by/                There is evidence that even at levels below authorities’ feed safety recommendations,
4.0/).                                    deoxynivalenol (DON) may decrease resistance to infectious disease in broilers [3]. A

Toxins 2021, 13, 170. https://doi.org/10.3390/toxins13020170                                              https://www.mdpi.com/journal/toxins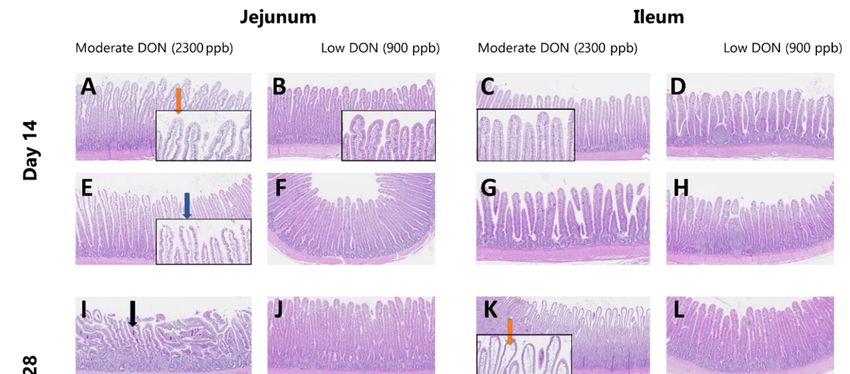
Toxins 2021, 13, 170                                                                                            2 of 18

                       previous study showed that broilers fed a diet containing 3000–4000 ppb DON, i.e., at
                       levels below the European maximum guidance (5000 ppb in the complete diet) [4], are
                       predisposed to develop necrotic enteritis. Also, broilers fed 1500 ppb DON combined with
                       20,000 ppb fumonisins are more susceptible to coccidiosis [5]. This poses a concern for
                       the broiler industry, and there is an ongoing discussion about the reduction of antibiotics
                       and the potential impact on the use of anticoccidials, particularly those from the class of
                       ionophores. This class of anticoccidial fits the classical definition of an antibiotic because
                       they have some antibacterial activity. This means that the importance of mycotoxins
                       in the poultry industry may increase in a situation where ionophore anticoccidials are
                       banned from feed. Besides this, the subclinical and indirect effects of mycotoxins are often
                       underestimated because no typical mycotoxicosis symptoms are observed. In general,
                       mycotoxins may be involved in numerous subclinical symptoms, and will potentiate the
                       negative effect of diseases or simply lead to impaired performance.
                            To mimic on-farm conditions, it is important to expose broilers to feed naturally
                       contaminated with mycotoxins as opposed to experimental contamination with synthetic
                       mycotoxins. Furthermore, realistic contamination levels have to be considered when
                       applying naturally contaminated diets. For instance, it is not common to find feedstuffs
                       highly contaminated with fumonisins. Therefore, the probability of producing a diet with
                       a final concentration between 15,000 ppb and 20,000 ppb (20,000 ppb is the European
                       threshold level in complete feed) [4] is extremely low. The maximum acceptable level
                       of DON in cereals and cereal products used for feed production is 8000 ppb, while for
                       maize byproduct feed materials, it is 12,000 ppb (EC 576/2006) [4]. Considering that
                       northwestern European broiler diets contain approximately 30% wheat, it will be difficult
                       to reach 4000 ppb in the final diet. Based on this, we can expect only low to moderate levels
                       of DON in broiler diets, e.g., 1000 ppb to 3000 ppb.
                            The type of feedstuff added to the diet also interferes with intestinal health and broiler
                       performance. Wheat and rye evoke increased intestinal viscosity in broilers due to high
                       levels of soluble non-starch polysaccharides (NSP), and this results in impaired nutrient
                       digestibility and predisposes to infections [6,7]. This effect is usually prevented by the
                       inclusion of enzymes that break down soluble NSP. For this trial, we decided to keep the
                       inclusion level of wheat close to practice, whereas a small amount of rye was included to
                       induce a mild intestinal challenge.
                            For this study, we exposed broilers during the starter and grower phase to two different
                       levels of DON (900 ppb or 2300 ppb). In the finisher period, they received a diet with
                       a negligible level of DON (57.3 ppb) to evaluate carryover effects. As a positive control,
                       activated charcoal was tested at each DON level. Furthermore, feed was not supplemented
                       with coccidiostats or NSP enzymes, with the aim to evaluate animal performance and
                       intestinal integrity.

                       2. Results
                       2.1. Broiler Performance
                            The average body weight of the birds at the start of the trial was 42.7 g (42.4–43.0 g)
                       for all treatments. The lowest body weight (BW) at D14 and D28 was observed in broilers
                       fed the moderate DON (MD), regardless of the dietary supplementation with activated
                       charcoal. Dietary supplementation with activated charcoal improved BW only at D14.
                       Although birds were fed a diet with negligible levels of DON and no activated charcoal at
                       D35, the birds previously fed with MD diets presented a significantly lower BW (Table 1).
                            During the starter (D0–14; Table 2) and grower (D14–28; Table 3) periods, there were
                       no interactions between DON level and activated charcoal. The lowest body weight gain
                       (BWG) and highest feed conversion ratio (FCR) at D14 and D28 was observed when birds
                       were fed the MD diet, regardless of the dietary supplementation with activated charcoal
                       (Tables 2 and 3). Activated charcoal improved BWG at D14 only but did not improve FCR
                       (Table 2). None of the diets affected feed intake (FI) in the starter (D0–14) and grower
                       (D14–28) periods (Tables 2 and 3).
Toxins 2021, 13, 170 3 of 18
Table 1. Mean (± SD) effects of deoxynivalenol (DON) and activated charcoal on body weight
(BW; g) of the birds at D14, D28, and D35.
Treatment DON D14 D28 D35
No Additive MD 530 ± 9 1696 ± 69 2362 ± 88
Activated Charcoal MD 545 ± 20 1762 ± 117 2382 ± 89
No Additive LD 551 ± 23 1830 ± 52 2464 ± 71
Activated Charcoal LD 563 ± 11 1822 ± 78 2438 ± 95
MD 538 ± 17 a 1729 ± 99 a 2372 ± 86 a
LD 557 ± 19 b 1826 ± 64 b 2451 ± 82 b
No Additive 541 ± 20 a 1763 ± 91 2413 ± 93
Activated Charcoal 554 ± 18 b 1792 ± 101 2410 ± 94
Effect p-value LSD p-value LSD p-value LSD
DON 0.004 12.5 0.001 54.8 0.02 64.6
Additive 0.042 12.5 0.28 54.8 0.94 64.6
DON × Additive 0.83 17.7 0.18 77.4 0.48 91.3
MD: Moderate DON level (2300 ppb in the diet); LD: Low DON level (900 ppb in the diet), LSD: Least significant
difference. (a–c) Values followed by a different letter within a column differ significantly (p ≤ 0.05).
Table 2. Mean (± SD) effects of DON and activated charcoal in the starter phase (D0–14) on body
weight gain (BWG; g), feed intake (FI; g), and feed conversion ratio (FCR; g/g) of broilers.
BWG FI FCR
Treatment DON (g) (g) (g/g)
No Additive MD 488 ± 9 578 ± 11 1.186 ± 0.016
Activated Charcoal MD 502 ± 20 586 ± 22 1.168 ± 0.011
No Additive LD 508 ± 23 588 ± 21 1.158 ± 0.020
Activated Charcoal LD 520 ± 11 597 ± 18 1.148 ± 0.035
MD 495 ± 17 a 582 ± 17 1.177 ± 0.016 b
LD 514 ± 18 b 593 ± 20 1.153 ± 0.028 a
No Additive 498 ± 20 a 583 ± 17 1.172 ± 0.023
Activated Charcoal 511 ± 18 b 592 ± 20 1.158 ± 0.027
Effect p-value LSD p-value LSD p-value LSD
DONToxins 2021, 13, 170 4 of 18
Table 3. Mean (± SD) effects of DON and activated charcoal in the grower phase (D14–28) on body
weight gain (BWG; g), feed intake (FI; g), and feed conversion ratio (FCR; g/g) of broilers.
BWG FI FCR
Treatment DON (g) (g) (g/g)
No Additive MD 1166 ± 75 1814 ± 54 1.561 ± 0.080
Activated Charcoal MD 1217 ± 102 1849 ± 95 1.523 ± 0.078
No additive LD 1279 ± 38 1888 ± 56 1.476 ± 0.021
Activated Charcoal LD 1259 ± 71 1861 ± 70 1.480 ± 0.039
MD 1191 ± 91 a 1831 ± 77 1.542 ± 0.079 b
LD 1269 ± 56 b 1875 ± 63 1.478 ± 0.030 a
No Additive 1222 ± 82 1851 ± 66 1.519 ± 0.072
Activated Charcoal 1238 ± 88 1855 ± 81 1.501 ± 0.064
Effect p-value LSD p-value LSD p-value LSD
DONToxins 2021, 13, 170 5 of 18
Table 5. Mean (± SD) effects of DON and activated charcoal in the complete feeding period (D0–35)
on body weight gain (BWG; g), feed intake (FI; g), and feed conversion ratio (FCR; g/g) of broilers.
BWG FI FCR
Treatment DON (g) (g) (g/g)
No Additive MD 2319 ± 88 3555 ± 77 1.534 ± 0.041
Activated Charcoal MD 2339 ± 89 3583 ± 110 1.532 ± 0.038
No Additive LD 2421 ± 71 3649 ± 110 1.508 ± 0.026
Activated Charcoal LD 2396 ± 95 3600 ± 97 1.503 ± 0.028
MD 2329 ± 86 a 3569 ± 93 1.533 ± 0.038 b
LD 2408 ± 82 b 3624 ± 104 1.505 ± 0.026 a
No Additive 2370 ± 93 3612 ± 104 1.521 ± 0.035
Activated Charcoal 2368 ± 94 3591 ± 101 1.518 ± 0.036
Effect p-value LSD p-value LSD p-value LSD
DON 0.02 64.5 0.13 73.2 0.04 0.0249
Additive 0.94 64.5 0.76 73.2 0.81 0.0249
DON × Additive 0.48 91.3 0.29 103.5 0.91 0.0352
MD: Moderate DON level (2300 ppb in the diet); LD: Low DON level (900 ppb in the diet). (a,b) Values followed
by a different letter within a column differ significantly (p ≤ 0.05).
2.2. Intestinal Analysis
2.2.1. Jejunum and Ileum Morphometry
The effects of DON and activated charcoal on jejunum and ileum morphometry were
evaluated by comparing villus height (VH) (µm), crypt depth (CD) (µm), villus height:crypt
depth (VH:CD) ratio, and villus area (µm2 ) among the treatments at D14 (Table 6), D28
(Table 7), and D35 (Table 8). The VH:CD ratio was significantly higher in the ileum from
14-day-old broilers fed the MD when compared with the LD diet (Table 6). The VH and
VH:CD ratio in the jejunum from 28-day-old broilers showed a significant interaction,
indicating that broilers fed a non-supplemented MD diet had the shortest villi and lowest
VH:CD ratio when compared with the non-supplemented LD diet. These differences were
statistically significant. When LD diets were supplemented with activated charcoal, a
significant decrease in VH was observed (Table 7).
Regarding the ileum, the crypt depth was highest when broilers chickens were fed a
non-supplemented MD diet and lowest when the birds were fed the non-supplemented
LD diet. This resulted also in the significantly lowest and highest VH:CD ratio when the
birds were fed the MD and LD diets, respectively. No dietary effect was observed on the
morphometry of the jejunum and ileum from 35-day-old broilers (Table 8).
2.2.2. Goblet Cell Counting
The effects of DON and activated charcoal on jejunum and ileum mucus production
were evaluated by counting the number of goblet cells per villus and by determining the
density of these goblet cells according to the villus area (µm2 ) among the treatments at D14
(Table 9), D28 (Table 10), and D35 (Table 11). Dietary effects were observed only at D14,
where a significant increase in goblet cell density was observed in the ileum from broilers
fed the MD diet, regardless of the supplementation with activated charcoal (Table 9).Toxins 2021, 13, 170 6 of 18
Table 6. Mean (± SD) effects of DON and activated charcoal on morphometric parameters and ileum at D14.
Jejunum Ileum
Villus Height Crypt Depth VH:CD Villus Area Villus Height Crypt Depth VH:CD Villus Area
Treatment DON (µm) (µm) ratio (mm2 ) (µm) (µm) ratio (mm2 )
No Additive MD 829 ± 110 160 ± 31 5.3 ± 0.6 81 ± 15 663 ± 44 158 ± 16 4.3 ± 0.5 64 ± 5.8
Activated Charcoal MD 830 ± 99 165 ± 31 5.2 ± 0.8 90 ± 17 671 ± 103 158 ± 47 4.6 ± 1.4 74 ± 29
No Additive LD 783 ± 72 180 ± 41 4.6 ± 1.4 82 ± 11 591 ± 69 195 ± 75 3.4 ± 1.0 63 ± 14
Activated Charcoal LD 841 ± 70 184 ± 33 4.7 ± 1.0 92 ± 21 670 ± 113 173 ± 21 4.0 ± 0.8 78 ± 20
MD 829 ± 101 162 ± 30 5.2 ± 0.7 86 ± 16 667 ± 77 158 ± 34 4.4 ± 1.0 b 69 ± 21
LD 812 ± 75 182 ± 36 4.7 ± 1.2 87 ± 17 630 ± 99 184 ± 54 3.7 ± 0.9 a 71 ± 18
No Additive 806 ± 93 170 ± 37 5.0 ± 1.1 82 ± 13 627 ± 67 176 ± 56 3.8 ± 0.9 64 ± 11
Activated Charcoal 835 ± 83 175 ± 32 5.0 ± 0.9 91 ± 18 671 ± 105 165 ± 36 4.3 ± 1.1 76 ± 24
Effect p-value LSD p-value LSD p-value LSD p-value LSD p-value LSD p-value LSD p-value LSD p-value LSD
DON 0.59 66.1 0.13 25.6 0.14 0.75 0.83 13.2 0.25 63.8 0.07 28.0 0.03 0.66 0.85 13.7
Additive 0.37 66.1 0.71 25.6 0.97 0.75 0.16 13.2 0.17 63.8 0.43 28.0 0.18 0.66 0.08 13.7
DON × Additive 0.37 93.5 0.96 36.1 0.82 1.06 0.98 18.7 0.26 90.3 0.42 39.5 0.67 0.93 0.72 19.4
MD: Moderate DON level (2300 ppb in the diet); LD: Low DON level (900 ppb in the diet). (a,b) Values followed by a different letter within a column differ significantly (p ≤ 0.05).
Table 7. Mean (± SD) effects of DON and activated charcoal on morphometric parameters of jejunum and ileum at D28.
Jejunum Ileum
Villus Height Crypt Depth VH:CD Villus Area Villus Height Crypt Depth VH:CD Villus Area
Treatment DON (µm) (µm) ratio (mm2 ) (µm) (µm) ratio (mm2 )
No Additive MD 922 ± 113 a 232 ± 34 4.1 ± 0.9 a 182 ± 128 832 ± 192 235 ± 73 b 3.9 ± 1.4 a 119 ± 31
Additive MD 1002 ± 120 ab 214 ± 34 4.8 ± 0.9 ab 180 ± 168 876 ± 126 199 ± 41 ab 4.7 ± 1.4 ab 98 ± 19
No Additive LD 1073 ± 138 b 186 ± 23 5.9 ± 1.1 b 120 ± 16 951 ± 182 177 ± 26 a 5.5 ± 1.3 b 151 ± 113
Additive Charcoal LD 962 ± 153 a 212 ± 63 4.8 ± 1.2 ab 146 ± 63 888 ± 210 214 ± 41 ab 4.3 ± 1.2 ab 192 ± 171
MD 962 ± 120 223 ± 34 4.5 ± 1.0 181 ± 144 854 ± 158 217 ± 60 4.3 ± 1,4 109 ± 27
LD 1017 ± 152 199 ± 47 5.4 ± 1.2 133 ± 46 920 ± 193 196 ± 38 4.9 ± 1,4 171 ± 141
No Additive 998 ± 144 209 ± 36 5.0 ± 1.3 151 ± 94 892 ± 191 206 ± 61 4.7 ± 1.5 135 ± 81
Activated Charcoal 982 ± 134 213 ± 49 4.8 ± 1.1 163 ± 123 882 ± 167 206 ± 40 4.5 ± 1.3 145 ± 127
Effect p-value LSD p-value LSD p-value LSD p-value LSD p-value LSD p-value LSD p-value LSD p-value LSD
DON 0.16 76.8 0.12 30.1 0.03 0.78 0.23 80.2 0.34 137.6 0.20 47.7 0.18 0.92 0.12 78.9
Additive 0.68 76.8 0.81 30.1 0.65 0.78 0.77 80.2 0.89 137.6 1.00 35.8 0.60 0.92 0.80 78.9
DON × Additive 0.02 108.6 0.15 42.6 0.03 1.10 0.72 113.5 0.43 194.6 0.04 37.0 0.041 1.305 0.43 111.6
MD: Moderate DON level (2300 ppb in the diet); LD: Low DON level (900 ppb in the diet). (a,b) Values followed by a different letter within a column differ significantly (p ≤ 0.05).Toxins 2021, 13, 170 7 of 18
Table 8. Mean (± SD) effects of DON and activated charcoal on morphometric parameters of jejunum and ileum at D35.
Jejunum Ileum
Villus Height Crypt Depth VH:CD Villus Area Villus Height Crypt Depth VH:CD Villus Area
Treatment DON (µm) (µm) ratio (mm2 ) (µm) (µm) ratio (mm2 )
No Additive MD 1170 ± 169 256 ± 64 4.9 ± 1.3 212 ± 143 905 ± 124 205 ± 45 4.7 ± 1.6 170 ± 124
Additive MD 1166 ± 222 250 ± 61 4.9 ± 1.3 289 ± 156 887 ± 230 203 ± 33 4.5 ± 1.2 114 ± 39
No Additive LD 1120 ± 206 240 ± 55 4.9 ± 1.4 279 ± 126 835 ± 141 207 ± 65 4.3 ± 1.1 98 ± 24
Additive Charcoal LD 1175 ± 129 266 ± 43 4.6 ± 0.9 257 ± 155 895 ± 106 202 ± 36 4.6 ± 0.8 142 ± 80
MD 1168 ± 190 253 ± 60 4.9 ± 1.2 250 ± 150 896 ± 182 204 ± 38 4.6 ± 1.4 142 ± 90
LD 1148 ± 166 253 ± 49 4.7 ± 1.1 268 ± 138 865 ± 125 205 ± 50 4.4 ± 0.9 120 ± 62
No Additive 1145 ± 182 248 ± 58 4.9 ± 1.3 245 ± 137 870 ± 133 206 ± 55 4.5 ± 1.3 134 ± 91
Activated Charcoal 1171 ± 175 258 ± 51 4.7 ± 1.1 273 ± 151 891 ± 173 203 ± 33 4.5 ± 1.0 128 ± 63
Effect p-value LSD p-value LSD p-value LSD p-value LSD p-value LSD p-value LSD p-value LSD p-value LSD
DON 0.78 145.4 1.00 43.8 0.72 0.98 0.74 105.6 0.60 120.7 0.99 36.2 0.72 0.87 0.39 51.5
Additive 0.72 145.4 0.65 43.8 0.81 0.98 0.60 105.6 0.72 120.7 0.86 36.2 0.99 0.87 0.83 51.5
DON × Additive 0.68 205.6 0.47 62.0 0.71 1.39 0.35 149.4 0.51 170.8 0.93 51.4 0.51 1.24 0.06 72.8
MD: Moderate DON level (2300 ppb in the diet); LD: Low DON level (900 ppb in the diet). MD and LD diets were given in the start (D0–14) and grower (D14–28) periods only. During the finisher period, all birds
were fed a diet with negligible (57.3 ppb) DON levels.Toxins 2021, 13, 170 8 of 18
Table 9. Mean (± SD) effects of DON and activated charcoal on the number and density of goblet cells in jejunum and ileum
of broilers at D14.
Treatment DON Jejunum Ileum
N◦ Goblet Cells Goblet Cells/µm2 N◦ Goblet Cells Goblet Cells/µm2
No Additive MD 111 ± 21 1.4 ± 0.2 104 ± 18 1.6 ± 0.2
Activated Charcoal MD 126 ± 29 1.4 ± 0.2 119 ± 63 1.6 ± 0.2
No Additive LD 99 ± 20 1.2 ± 0.3 84 ± 24 1.3 ± 0.3
Activated Charcoal LD 112 ± 29 1.2 ± 0.3 101 ± 41 1.3 ± 0.4
MD 119 ± 26 1.4 ± 0.2 111 ± 45 1.6 ± 0.2 b
LD 106 ± 25 1.2 ± 0.3 93 ± 34 1.3 ± 0.3 a
No Additive 105 ± 21 1.3 ± 0.3 94 ± 23 1.5 ± 0.3
Activated Charcoal 119 ± 29 1.3 ± 0.3 110 ± 52 1.4 ± 0.3
Effect p-value LSD p-value LSD p-value LSD p-value LSD
DON 0.14 17.0 0.06 0.17 0.20 29.7 0.02 0.21
Additive 0.10 17.0 0.88 0.17 0.28 29.7 0.67 0.21
DON × Additive 0.90 24.0 0.92 0.24 0.91 42.0 0.86 0.29
MD: Moderate DON level (2300 ppb in the diet); LD: Low DON level (900 ppb in the diet). (a,b) Values followed by a different letter within
a column differ significantly (p ≤ 0.05).
Table 10. Mean (± SD) effects of DON and activated charcoal on the number and density of goblet cells in jejunum and
ileum of broilers at D28.
Treatment DON Jejunum Ileum
N◦ Goblet Cells Goblet Cells/µm2 N◦ Goblet Cells Goblet Cells/µm2
No Additive MD 143 ± 56 1.0 ± 0.6 160 ± 88 1.4 ± 0.7
Activated Charcoal MD 151 ± 65 1.2 ± 0.7 134 ± 28 1.4 ± 0.4
No Additive LD 147 ± 41 1.3 ± 0.5 161 ± 49 1.4 ± 0.7
Activated Charcoal LD 164 ± 56 1.2 ± 0.5 172 ± 95 1.5 ± 1.1
MD 147 ± 59 1.1 ± 0.6 147 ± 65 1.4 ± 0.6
LD 155 ± 48 1.2 ± 0.5 167 ± 73 1.4 ± 0.9
No Additive 145 ± 47 1.1 ± 0.5 160 ± 69 1.4 ± 0.7
Activated Charcoal 157 ± 59 1.2 ± 0.6 153 ± 71 1.4 ± 0.8
Effect p-value LSD p-value LSD p-value LSD p-value LSD
DON 0.64 36.5 0.52 0.40 0.41 47.2 0.95 0.50
Additive 0.49 36.5 0.67 0.40 0.76 47.2 0.87 0.50
DON × Additive 0.80 51.7 0.52 0.57 0.42 66.7 0.94 0.70
MD: Moderate DON level (2300 ppb in the diet); LD: Low DON level (900 ppb in the diet).
Table 11. Mean (± SD) effects of DON and activated charcoal on the number and density of goblet cells in jejunum and
ileum of broilers at D35.
Treatment DON Jejunum Ileum
N◦ Goblet Cells Goblet Cells/µm2 N◦ Goblet Cells Goblet Cells/µm2
No Additive MD 81.3 ± 36.5 0.5 ± 0.2 73.0 ± 26.5 0.6 ± 0.4
Activated Charcoal MD 65.0 ± 29.1 0.3 ± 0.2 72.2 ± 33.4 0.6 ± 0.1
No Additive LD 76.2 ± 46.7 0.4 ± 0.4 73.6 ± 21.8 0.8 ± 0.3
Activated Charcoal LD 84.8 ± 28.8 0.5 ± 0.3 65.5 ± 34.8 0.6 ± 0.3
MD 73.1 ± 33.0 0.4 ± 0.2 72.6 ± 30 0.6 ± 0.3
LD 80.5 ± 37.0 0.4 ± 0.3 69.5 ± 28 0.7 ± 0.3
No Additive 78.7 ± 40.1 0.4 ± 0.3 73.3 ± 23 0.7 ± 0.3
Activated Charcoal 74.9 ± 29.8 0.4 ± 0.3 68.8 ± 33 0.6 ± 0.2
Effect p-value LSD p-value LSD p-value LSD p-value LSD
DON 0.59 27.9 0.89 0.21 0.73 17.8 0.38 0.16
Additive 0.78 27.9 0.63 0.21 0.61 17.8 0.22 0.16
DON × Additive 0.37 39.5 0.20 0.30 0.68 25.2 0.10 0.22
MD: Moderate DON level (2300 ppb in the diet); LD: Low DON level (900 ppb in the diet). MD and LD diets were given in the start (D0–14)
and grower (D14–28) periods only. During the finisher period, all birds were fed a diet with negligible (57.3 ppb) DON levels.Toxins 2021, 13, 170 9 of 18
2.2.3. Intestinal Lesion Scores
Lesion scores were given to the jejunum and ileum on a scale from 0 to 6 based
on the Chiu/Park scoring method, where the higher the score, the higher the degree of
damage. At D14, lesion scores were significantly increased when birds were fed a MD
diet supplemented with activated charcoal, whereas at D28, the highest lesion scores were
observed in broiler chickens receiving a non-supplemented MD died. No dietary effects
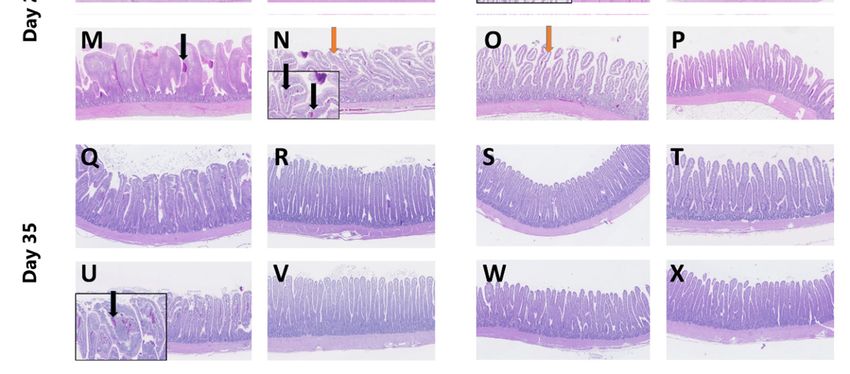
Toxins 2021, 13, 170 were observed at D35 (Table 12). Figure 1 illustrates examples of jejunum and9 ileumof 17
sections from broilers fed MD and LD diets supplemented or not with activated charcoal.
Illustrativeimages
Figure1.1.Illustrative
Figure imagesofofperiodic
periodicacid–Schiff
acid–Schiff (PAS)-hematoxylin-stained
(PAS)-hematoxylin-stained sections
sections of
of jejunum
jejunum and
andileum
ileumfrom
frombroilers
broil-
fed the experimental diets. Orange arrows indicate denuded lamina propria, blue arrow shows damage
ers fed the experimental diets. Orange arrows indicate denuded lamina propria, blue arrow shows damage in villus in villus tip,tip,
and
black
and arrows
black indicate
arrows blood
indicate in the
blood villi.villi.
in the Scale barsbars
Scale = 100 µm.µm.
= 100
2.2.4. Intestinal Viscosity
The results concerning viscosity in the duodenum on D14, D28, and D35 are shown
in Table 13. Intestinal viscosity was significantly increased in 14-day-old broilers fed the
MD diet, regardless of the dietary supplementation with activated charcoal. No other
changes were observed in the other feeding phases.
Table 13. Mean (± SD) effects of DON and activated charcoal on intestinal viscosity (cP) at D14,
D28, and D35.
Treatment DON D14 (cP) D28 (cP) D35 (cP)Toxins 2021, 13, 170 10 of 18
Table 12. Mean (± SD) effects of DON and activated charcoal on jejunum and ileum Chiu/Park intestinal lesion scores *.
Jejunum Ileum
Treatment DON D14 D28 D35 D14 D28 D35
No Additive MD 0.3 ± 0.2 a 3.1 ± 1.3 b 1.5 ± 0.7 0.1 ± 0.1 1.3 ± 0.8 0.7 ± 0.7
Additive MD 1.1 ± 0.8 b 2.2 ± 1.4 ab 1.2 ± 1.3 0.3 ± 0.3 1.2 ± 1.2 0.9 ± 0.9
No Additive LD 1.0 ± 1.2 ab 1.3 ± 1.6 a 1.0 ± 0.7 0.2 ± 0.2 0.6 ± 0.6 0.6 ± 0.6
Additive Charcoal LD 0.2 ± 0.4 a 2.3 ± 1.2 ab 0.3 ± 0.6 0.0 ± 0.0 1.5 ± 1.1 0.4 ± 0.3
MD 0.7 ± 0.7 2.7 ± 1.4 1.3 ± 1.0 0.2 ± 0.2 1.2 ± 0.9 0.8 ± 0.8
LD 0.6 ± 0.6 1.8 ± 1.5 0.6 ± 0.7 0.1 ± 0.1 1.0 ± 1.0 0.5 ± 0.5
No Additive 0.7 ± 0.7 2.2 ± 1.7 1.2 ± 0.7 0.1 ± 0.1 0.9 ± 0.9 0.7 ± 0.7
Activated Charcoal 0.7 ± 0.7 2.2 ± 1.3 0.7 ± 0.7 0.1 ± 0.1 1.4 ± 1.1 0.7 ± 0.7
Effect p-value LSD p-value LSD p-value LSD p-value LSD p-value LSD p-value LSD
DON 0.75 0.56 0.07 0.92 0.06 0.69 0.30 0.19 0.53 0.61 0.34 0.60
Additive 0.97 0.56 0.94 0.92 0.16 0.69 0.80 0.19 0.13 0.61 0.96 0.60
DON × AdditiveToxins 2021, 13, 170 11 of 18
2.2.4. Intestinal Viscosity
The results concerning viscosity in the duodenum on D14, D28, and D35 are shown in
Table 13. Intestinal viscosity was significantly increased in 14-day-old broilers fed the MD
diet, regardless of the dietary supplementation with activated charcoal. No other changes
were observed in the other feeding phases.
Table 13. Mean (± SD) effects of DON and activated charcoal on intestinal viscosity (cP) at D14, D28,
and D35.
Treatment DON D14 (cP) D28 (cP) D35 (cP)
No Additive MD 16.6 ± 3.1 6.4 ± 3.8 2.2 ± 0.3
Activated Charcoal MD 14.6 ± 2.9 7.9 ± 2.6 2.1 ± 0.2
No Additive LD 9.1 ± 2.2 9.7 ± 3.7 2.2 ± 0.2
Activated Charcoal LD 10.5 ± 1.2 9.6 ± 6.0 2.3 ± 0.2
MD 15.6 ± 3.2 b 7.1 ± 3.2 2.1 ± 0.3
LD 9.8 ± 1.9 a 9.6 ± 4.8 2.2 ± 0.2
No Additive 12.9 ± 4.7 8.0 ± 4.0 2.2 ± 0.3
Activated Charcoal 12.6 ± 2.9 8.7 ± 4.5 2.2 ± 0.2
Effect p-value LSD p-value LSD p-value LSD
DONToxins 2021, 13, 170 12 of 18
broiler chickens [13]. Furthermore, it was remarkable that ENNB+B1 levels were higher in
MD than in LD diets.
Increasing the DON level from 900 ppb to 2300 ppb in the starter and grower diets
resulted in a decreased BWG. This negative effect on BWG was partly counteracted by
activated charcoal only in the MD diet. The same pattern was observed with FCR, which
was negatively affected in broilers fed the MD diet without activated charcoal. One
must bear in mind that the goal of this study was not to promote activated charcoal
as a DON adsorbent, since it may also absorb nutrients [14], but to use it as an extra
control [15]. Instead, it was shown that even when supplementing a diet with a compound
that can bind DON, performance losses are not completely avoided. When the diet was
replaced by a marginally contaminated feed in the finisher phase (D28–35), no differences
in performance were observed in this period. However, the final body weight of the birds
fed the MD diet during the starter and grower period was impaired, regardless of the
supplementation with activated charcoal. Moreover, considering the complete production
period (D0–35), BWG and FCR were impaired in broilers fed the MD diet compared with
those fed the LD diet, whereas FI was not affected by the experimental diets. Based on
a previous study, DON has a low oral availability (~19%) and a high plasma clearance
(~0.12 L/min kg) in broilers [16]. Therefore, the impaired performance was not a result
of mycotoxin accumulation or anorexia caused by DON. Previously, Lucke et al. [17] did
not observe any difference in broiler performance after 28 days of dietary exposure to
5000 ppb DON, and only observed differences after 35 days when BWG was significantly
decreased. Besides the dietary differences, in this later study, broiler chickens were fed diets
artificially contaminated with DON. Importantly, to achieve homogeneity, this mycotoxin
was mixed with inulin at a rate of 0.03% to 0.20% depending on the desired DON dietary
level. Inulin is a fructo-oligosaccharide (FOS) able to increase the production of cecal
butyric acid, which provides energy for the growth of the intestinal epithelium [18]. In
another study, broiler performance was even improved, and intestinal viscosity decreased
when the diet was contaminated with 1500 ppb DON [19]. The former authors suggested
that physicochemical alterations in the wheat, caused by mycotoxins, resulted in better
nutrient digestibility and in a lower viscosity in the jejunum and ileum. However, we did
not observe a similar decrease in viscosity, which was measured in the duodenum. Instead,
we observed an increase when birds were fed the MD diet during the starter phase. The
prolonged exposure time to DON did not affect duodenal viscosity at D28 (8–9 cP), although
it was still considerably higher than that observed in birds fed a marginally contaminated
diet in the finisher period (2.2 cP). Also, the finisher diet contained NSP enzymes, which
can explain the reduced viscosity in this phase. In a similar study, Dänicke et al. [19]
fed a control diet resulting in high ileal viscosity (above 25 mPa-s, i.e., 25 cP), which
was considerably higher than that observed in our study. Viscosity can be increased by
including rye and excluding NSP enzymes [20] as we did in the present study. An increase
in viscosity will negatively influence nutrient digestibility and absorption, decreasing
BWG and increasing FCR. Therefore, it is not surprising that this diet, combined with
moderate DON contamination, impaired broiler performance. Nonetheless, differences
in DON levels and dietary composition do not allow a comparison between the study of
Dänicke et al. [19] and the current study. Also, the wheat batch we used was naturally
contaminated with a mixture of mycotoxins and not submitted to induced infection with a
specific Fusarium strain, and nutritional composition may vary among batches. Recently,
we showed that broiler chickens fed a corn-based diet (low in NSP) contaminated with
~3500 ppb DON and ~50 ppb of its derivatives 3+15 Ac-DON presented an impaired FCR,
indicating that intestinal viscosity is not crucial to observe the negative impact of DON on
performance [21]. Likewise, a longitudinal study also showed that mixtures of mycotoxins
below EU recommendation levels impair the performance of broiler chickens [22].
Intestinal morphometric changes in the first 14 days of exposure were negligible and
limited to an increase in the VH:CD ratio in the ileum of broilers fed the MD diet, regardless
of the presence of activated charcoal, indicating that cell proliferation decreased in broilersToxins 2021, 13, 170 13 of 18
fed the MD diet without resulting in immediate villus shortening. This was expected,
since DON decreases cell proliferation and the crypt is responsible for cell renewing and
maintenance of villus length. After 28 days, however, broilers fed the MD diet presented a
significantly lower villus height and VH:CD ratio than those fed the LD diet. This leads
us to infer that birds fed the MD diet were probably trying to maintain villus height by
a compensatory increase in the proliferation in the crypt, which required extra energy.
Besides this, shortened villi and deeper crypts will result in suboptimal nutrient absorption
and impaired animal performance [23,24]. This fits with the observed decreased BWG
and increased FCR at D28. Besides, the ileum presented a higher VH:CD ratio due to
an increase in crypt depth, showing that in this intestinal section, cell proliferation was
increased to keep villus height similar to the expected (LD diet) levels. Such a compensatory
mechanism costs energy and will result in suboptimal performance. At D35, no differences
were observed, because the finisher diet had negligible levels of DON and intestinal cell
turnover takes around 48 h to 96 h [25]. The number of goblet cells was not affected
by the treatments. In a study with pigs, it was shown that DON causes oedema in the
lamina propria and contact loss between lamina propria and enterocytes [26]. However, in
the present study, the tested DON levels were not able to cause such effects. Based on the
morphometric analysis and lesion scores in the jejunum and ileum, it can be confirmed that
the jejunum was the intestinal section more sensitive to DON than the ileum, as reported
before for broilers submitted to DON exposure [27] or other sources of stress [28].
In conclusion, broiler chickens fed a diet containing moderate levels of DON (2300 ppb)
will perform inefficiently. Further, the influence of mycotoxins on poultry performance
should be assessed not only on its toxicity per se, but also considering animal age, di-
etary composition, and the presence of other types of additives, such as NSP enzymes
and anticoccidials.
4. Materials and Methods
4.1. Animal Ethics Statement
The experiment was conducted according to the guidelines of the Animal and Human
Welfare Codes/Laboratory practice codes in the Netherlands. The protocol was approved
by the Ethics Review Committee: Body of Animal Welfare at SFR (AVD246002016450),
approval date: 28 February 2019.
4.2. Broilers and Housing
One-day-old male Ross 308 broilers purchased from a local commercial hatchery were
used in this study, with 4 dietary treatments of 184 chicks each (divided among 8 replicate
pens with 23 chicks each). The birds were housed in 32 floor pens with wood shavings
as bedding material in the broiler facilities of Schothorst Feed Research, Lelystad, The
Netherlands. Each pen (2.2 m2 ) had 1 feeder and 3 drinking nipples. Birds were kept
until 35 days of age. The ambient temperature was gradually decreased from 34.5 ◦ C
at the arrival of the birds to 19.4 ◦ C at 35 days of age. Room temperature and relative
humidity were recorded daily. Light was provided continuously for the first 24 h to give
birds the opportunity to readily find feed and water. After that, the light schedule was
22L (light): 2D (dark) for 1 day and then 8L: 4D: 10L: 2D for the remaining experimental
period, complying with European Union (EU) legislation of a minimum of 6 h of darkness
from the second day onward, of which at least 4 h was uninterrupted darkness. Birds
were vaccinated against Newcastle Disease at D10 and against Infectious Bursal Disease
at D20 of the trial. The health status of the flock was monitored by a poultry veterinarian.
Throughout the experimental period, all animals were monitored daily for abnormalities,
such as abnormal behavior, clinical signs of illness, and mortality.
4.3. Diets and Experimental Design
The experiment comprised 4 dietary treatments in a factorial design with DON (2 lev-
els; moderate—MD and low—LD) in diets with or without activated charcoal (2 g/kg diet;Toxins 2021, 13, 170 14 of 18
Norit, Carbomix, KELA Pharma, Sint-Niklaas, Belgium), applied as a DON adsorbent [15].
Diets were prepared with wheat batches naturally contaminated with different DON levels
(1650 ppb and 6880 ppb), together with other mycotoxins. The recommended maximum
level of DON in poultry diet is 5000 ppb (EU Commission Directive 2003/100/EC). There-
fore, in the present study, the obtained 900 ppb and 2300 ppb DON in the final diet were
considered as low (LD) and moderate (MD) DON levels, respectively. Treatments were
randomly allocated per block to pens, where each treatment was repeated 8 times. The
pen was the experimental unit, and each pen contained 23 broilers. Dietary treatments
are summarized in Table 14, together with their mycotoxin composition. Although the
supplemented diets were made from the same basal diet of each MD or LD level, the levels
of DON were measured in all diets to calculate the mean contamination level. The mean
levels of DON in the LD diets during the starter and grower phases were 881 ± 4 ppb and
876 ± 92 ppb, respectively. The mean levels of DON in the MD diets during the starter and
grower phases were 2130 ± 99 ppb and 2290 ± 99 ppb, respectively. The finisher diet was
prepared with marginally contaminated feedstuffs, reaching a DON level of 57 ppb. All
diets were analyzed by an independent and accredited laboratory (Primoris, Belgium). A
multi-mycotoxin test was applied, showing that DON was the main contaminant and that
other mycotoxins were found at negligible levels. The nutrient composition of the diets is
given in the Supplementary Table S1.
Table 14. Evaluated and mean levels of DON and other mycotoxins in the starter (D0–14), grower (D1–28), and finisher
(D28–35) diets.
Experimental Diets
Mycotoxins Levels (ppb) Moderate DON (MD) MD + Activated Charcoal Low DON (LD) LD + Activated Charcoal
Starter Diet (D0–14)
DON 2060 2200 878 884
DON-3-Glucoside 132 132 99 454
Enniatin B 28.2 32.3 90.4 61.8
Enniatin B1 13.1 8.5 16.0 17.3
Alternariol 10.7 - - 3.3
Alternariol ME - - - 2.4
Grower Diet (D14-28)
DON 2360 2220 941 811
DON-3-Glucoside 1670 1480 851 632
Zearalenone - - 18.2 16.6
Ochratoxin - - - 3.3
Enniatin B 36.7 41.7 58.5 60.5
Enniatin B1 8.7 10.4 15.8 16.6
Alternariol 4.2 - 3.8 2.1
Alternariol ME 2.1 2.2 2.7 -
Finisher Diet (D14–28)
DON 57.3 57.3 57.3 57.3
Enniatin B 8.4 8.4 8.4 8.4
Beauvericin 6.1 6.1 6.1 6.1
4.4. Performance and Litter Score
Broilers were weighed per pen on D0, D14, D28, and D35, and feed consumption and
mortality were recorded throughout the experimental period. Body weight gain (BWG),
feed intake (FI), and feed conversion ratio (FCR) were determined in the cumulative phases
from D0–14, D14–28, D28–35, and D0–35. Litter quality was visually scored at D14, D28,
and D35 on a scale of 1–10, with 1 indicating low quality (wet) and 10 indicating high
quality (dry and friable) [29].
4.5. Intestinal Analysis
4.5.1. Jejunum and Ileum Morphometry and Goblet Cell Counting
Samples of jejunum and ileum (we randomly selected 1 bird/pen on D14, D28, and
D35) were collected and fixed in buffered formalin for histological analysis. In brief, his-Toxins 2021, 13, 170 15 of 18
tological slides (periodic acid–Schiff (PAS) counterstaining with hematoxylin staining)
from the jejunum and ileum from each bird were scanned by the NanoZoomer-XR (Hama-
matsu Photonics KK, Hamamatsu, Japan). The scanned slides were viewed through the
viewer software (NDP.view2; Hamamatsu, Japan) and analyzed using the analysis soft-
ware (NDP.analyze; Hamamatsu, Japan). Villus height (VH), crypt depth (CD), and villus
area (µm2 ) from each individual bird were measured (5 villi per intestinal segment). The
measurements of VH and CD were used to calculate the VH:CD ratio. The number of
goblet cells and goblet cell density per villus were also quantified in scans of Alcian Bleu
sections, serial to the PAS-hematoxylin sections. Only intact villi were measured.
4.5.2. Jejunum and Ileum Lesion Scores
To evaluate the degree of mucosal damage, the Chiu/Park scale was applied [30].
In brief, the mucosa was classified from normal if presenting an intact structure with no
visible damage (degree 0) to severely damaged (degree 6), as previously described [28]:
Degree 0: Intact without visible damage.
Degree 1: Damage in subepithelial space at villus tips.
Degree 2: Extension of subepithelial space with moderate lifting.
Degree 3: Massive lifting down the sides of villi with some denuded villi.
Degree 4: Denuded villi with dilated capillaries.
Degree 5: Disintegration of lamina propria.
Degree 6: Crypt injury.
To statistically compare the degrees among the treatments, a composite score per
treatment was determined by averaging the score from each bird. For this, the percentage
of villi with a specific degree was multiplied by its respective degree. This calculation
was performed for each degree per treatment, and the sum obtained was considered the
composite score [31].
4.5.3. Intestinal Viscosity
Digesta samples from the duodenum were collected at D14 (pooled sample of 3 birds
per pen), D28 (1 bird per pen), and D35 (1 bird per pen). The samples were submitted
to viscosity determination according to the AOAC protocol. In brief, each sample was
centrifuged for 10 min at 3500× g and at 4 ◦ C. The supernatant was filtrated with a serum
filter tube and placed on ice. Viscosity of the supernatant was measured at 20 ◦ C with a
digital Brookfield DV-II LVCP viscometer (Brookfield Engineering, Middleboro, MA, USA)
according to the “plate and cone” method.
4.6. Statistical Analysis
Observations were marked as outliers to be excluded from the dataset prior to sta-
tistical analyses if the residual (fitted—observed value) was more than 2.5× standard
error of the parameter. If at least 1 of the response parameters FI, BWG, or FCR was an
outlier, then all 3 records were dropped for that particular observation in that measurement
period. Body weight was analyzed separately from the other production parameters. Data
regarding intestinal morphometry and goblet cells counting were used without removing
outliers. The experimental data were analyzed with ANOVA (GenStat Version 19.0, 2018,
Hemel Hempstead, UK). Each pen was an experimental unit. Given the factorial design,
the statistical model used to analyze the data was:
Y = µ + blocki + DONj + Additivek + DON*Additivejk + eijk
In which:
Y = Response parameter
µ = General mean
Blockj = Effect of block (i = 1 . . . 8)
DONj = Effect of DON (j = 1, 2)Toxins 2021, 13, 170 16 of 18
Additivek = Effect of Additive (k = 1, 2)
DON*Additivejk = Effect of the interactions between DON and Additive
Errorijk = Error term
Treatment means were compared by least significant difference (LSD). Values with
p ≤ 0.05 were considered statistically significant.
Supplementary Materials: The following are available online at https://www.mdpi.com/2072-665
1/13/2/170/s1, Table S1. Composition of the experimental diets.
Author Contributions: Conceptualization: R.R.S. and E.v.E.; Funding acquisition: R.R.S. and E.v.E.;
Investigation and Project administration: R.R.S.; Validation: R.R.S. and E.v.E.; Writing original draft:
R.R.S. and E.v.E.; Writing review & editing: R.R.S. and E.v.E. All authors have read and agreed to the
published version of the manuscript.
Funding: This study was supported by ABZ Diervoeding B.V., De Hoop Mengvoeders B.V., Hankkija
Oy, and Vitelia Voeders B.V. The authors would like to thank Andre de Ruijter, Eija Valkonen, Erja
Koivunen, Gerard Raedts, Jacco Vessies, and Tom Lemmens for supporting the project.
Institutional Review Board Statement: The study was conducted according to the guidelines of the
Declaration of Helsinki, and approved by the Institutional Review Board (or Ethics Committee) of
SFR (AVD246002016450), approval date: 28 February 2019).
Informed Consent Statement: Not applicable.
Data Availability Statement: Data sharing not applicable.
Conflicts of Interest: The authors declare no conflict of interest.
Abbreviations
AME Alternariol Methyl Ether
ANOVA Analysis of variance
AOAC Association of Official Analytical Chemists
AOH Alternariol
BWG Body Weight Gain
CD Crypt depth
cP Centipoise
DDGS Distiller’s dried grains with solubles
DON Deoxynivalenol
DON-3-G Deoxynivalenol-3-Glucoside
ENNB+B1 Enniatins B and B1
EU European Union
FCR Feed conversion ratio
FI Feed intake
FOS Fructo-oligosaccharides
LD Low deoxynivalenol
LSD Least significant difference
MD Moderate deoxynivalenol
NSP Non-starch polysaccharides
OTA Ochratoxin A
PAS Periodic Acid–Schiff
VH Villus height
VH:CD ratio Villus height:Crypt depth ratio
ZEN ZearalenoneToxins 2021, 13, 170 17 of 18
References
1. Pinotti, L.; Ottoboni, M.; Giromini, C.; Dell’Orto, V.; Cheli, F. Mycotoxin contamination in the EU feed supply chain: A focus on
cereal byproducts. Toxins 2016, 8, 45. [CrossRef]
2. Magnoli, A.P.; Poloni, V.L.; Cavaglieri, L. Impact of mycotoxin contamination in the animal feed industry. Curr. Opin. Food Sci.
2019, 29, 99–108. [CrossRef]
3. Antonissen, G.; Van Immerseel, F.; Pasmans, F.; Ducatelle, R.; Haesebrouck, F.; Timbermont, L.; Verlinden, M.; Janssens, G.P.J.;
Eeckhaut, V.; Eeckhout, M.; et al. The mycotoxin deoxynivalenol predisposes for the development of Clostridium perfringens-
induced necrotic enteritis in broiler chickens. PLoS ONE 2014, 9, e108775. [CrossRef]
4. Commission Recommendation 2016/1319/EC of 29 July 2016 amending Commission Recommendation 2006/576/EC on the
presence of deoxynivalenol, zearalenone, ochratoxin A, T-2 and HT-2 and fumonisins in products intended for animal feeding.
Off. J. Eur. Union 2016, L208, 58–60.
5. Grenier, B.; Dohnal, I.; Shanmugasundaram, R.; Eicher, S.D.; Selvaraj, R.K.; Schatzmayr, G.; Applegate, T.J. Susceptibility of broiler
chickens to coccidiosis when fed subclinical doses of deoxynivalenol and fumonisins—special emphasis on the immunological
response and the mycotoxin interaction. Toxins 2016, 8, 231. [CrossRef] [PubMed]
6. Tellez, G.; Latorre, J.D.; Kuttappan, V.A.; Hargis, B.M.; Hernandez-Velasco, X. Rye affects bacterial translocation, intestinal
viscosity, microbiota composition and bone mineralization in turkey poults. PLoS ONE 2015, 10, e0122390. [CrossRef]
7. Ayres, V.E.; Broomhead, J.N.; Li, X.; Raab, R.M.; Moritz, J.S. Viscosity and growth response of broilers fed high fiber diets
supplemented with a corn-produced recombinant carbohydrase. J. Appl. Poultry Res. 2019, 28, 826–836. [CrossRef]
8. Girgis, G.N.; Barta, J.R.; Girish, C.K.; Karrow, N.A.; Boermans, H.J.; Smith, T.K. Mycotoxins and an organic mycotoxin adsobent on
immune cell dynamics in the jejunum of chickens infected with Eimeria maxima. Vet. Immunol. Immunopathol. 2010, 138, 218–223.
[CrossRef] [PubMed]
9. Noack, S.; Chapman, H.D.; Selzer, P.M. Anticoccidial drugs of the livestock industry. Parasitol. Res. 2019, 118, 2009–2026.
[CrossRef] [PubMed]
10. Raza, A.; Bashir, A.; Tabassum, R. An update on carbohydrases: Growth performance and intestinal health of poultry. Heliyon
2019, 5, e01437. [CrossRef] [PubMed]
11. Pierron, A.; Mimoun, S.; Murate, L.S.; Loiseau, N.; Lippi, Y.; Bracarense, A.P.F.L.; Liaubet, L.; Schatzmayr, G.; Berthiller, F.;
Moll, W.D.; et al. Intestinal toxicity of the masked mycotoxin deoxynivalenol-3-β-glucoside. Arch. Toxicol. 2016, 90, 2037–2046.
[CrossRef]
12. Broekaert, N.; Devreese, M.; van Bergen, T.; Schauvliege, S.; De Boevre, M.; De Saeger, S.; Vanhaecke, L.; Berthiller, F.; Michlmayr,
H.; Malachova, A.; et al. In vivo contribution of deoxynivalenol-3-β-D-glucoside to deoxynivalenol exposure in broiler chickens
and pigs: Oral bioavailability, hydrolysis and toxicokinetics. Arch. Toxicol. 2017, 91, 699–712. [CrossRef] [PubMed]
13. Fraeyman, S.; Croubels, S.; Devreese, M.; Ducatelle, R.; Rychlik, M.; Antonissen, G. Chronic dietary intake of enniatin B in broiler
chickens has low impact on intestinal morphometry and hepatic histology, and shows limited transfer to liver tissue. Toxins 2018,
10, 45. [CrossRef]
14. Avantaggiato, G.; Havenaar, R.; Visconti, A. Evaluation of the intestinal absorption of deoxynivalenol and nivalenol by an in vitro
gastrointestinal model, and the binding efficacy of activated charcoal and other adsorbent materials. Food Chem. Toxicol. 2004,
42, 817–824. [CrossRef]
15. Devreese, M.; Antonissen, G.; De Backer, P.; Croubels, S. Efficacy of active carbon towards the absorption of deoxynivalenol in
pigs. Toxins 2014, 6, 2998–3004. [CrossRef]
16. Osselaere, A.; Devreese, M.; Goossens, J.; Vandenbroucke, V.; De Baere, S.; De Backer, P.; Croubels, S. Toxicokinetic study and
absolute oral bioavailability of deoxynivalenol, T-2 toxin and zearalenone in broiler chickens. Food Chem. Toxicol 2013, 51, 350–355.
[CrossRef] [PubMed]
17. Lucke, A.; Doupovec, B.; Paulsen, P.; Bohm, Q.Z. Effects of low to moderate levels of deoxynivalenol on feed and water intake,
weight gain, and slaughtering traits of broiler chickens A. Mycotoxin Res. 2017, 33, 261–271. [CrossRef]
18. Teng, P.Y.; Kim, W.K. Review: Roles of prebiotics in intestinal ecosystem of broilers. Front. Vet. Sci. 2018, 5, 245. [CrossRef]
19. Dänicke, S.; Valenta, H.; Matthes, S. On the interactions between Fusarium toxin-contaminated wheat and nonstarch polysaccha-
ride hydrolyzing enzymes in diets of broilers on performance, intestinal viscosity, and carryover of deoxynivalenol. Poult. Sci.
2007, 86, 291–298. [CrossRef] [PubMed]
20. Smulikowska, S.; Mieczkowska, A.; Nguyen, C.V.; Babelewska, M. The influence of digesta viscosity on the development of the
stomach, on in vitro small intestinal motility and on digestion of nutrients in broiler chicken. J. Anim. Feed Sci. 2002, 11, 683–694.
[CrossRef]
21. Santos, R.R.; Molist, F. Effect of different dietary levels of corn naturally contaminated with DON and its derivatives 3+15
Ac-DON and DON-3-glucoside on the performance of broilers. Heliyon 2020, 6, e05257. [CrossRef]
22. Kolawole, O.; Graham, A.; Donaldson, C.; Owens, B.; Abia, W.A.; Meneely, J.; Alcorn, M.J.; Connolly, L.; Elliott, C.T. Low doses of
mycotoxin mixtures below EU regulatory limits can negatively affect the performance of broiler chickens: A longitudinal study.
Toxins 2020, 12, e433. [CrossRef]
23. Xu, Z.R.; Hu, C.H.; Xia, M.S.; Zhan, X.A.; Wang, M.Q. Effects of dietary fructooligosaccharide on digestive enzyme activities,
intestinal microflora and morphology of male broilers. Poult. Sci. 2003, 82, 1030–1036. [CrossRef]Toxins 2021, 13, 170 18 of 18
24. Awad, W.A.; Ghareeb, K.; Abdel-Raheem, S.; Böhm, J. Effects of dietary inclusion of probiotic and synbiotic on growth
performance, organ weights, and intestinal histomorphology of broilers chickens. Poult. Sci. 2009, 88, 49–56. [CrossRef]
25. Potten, C.S. Stem cells in the gastrointestinal epithelium: Numbers, characteristics and death. Philos. Trans. R. Soc. Lond. B. Biol.
Sci. 1998, 353, 821–830. [CrossRef] [PubMed]
26. Cheat, S.; Gerez, J.R.; Cognie, J.; Alassane-Kpembi, I.; Bracarense, A.P.F.L.; Raymond-Letron, I.; Oswald, I.P.; Kolf-Dlauw, M.
Nivalenol has a greater impact than deoxynivalenol on pig jejunum mucosa in vitro on explants and in vivo on intestinal loops.
Toxins 2015, 7, 1945–1961. [CrossRef] [PubMed]
27. Osselaere, A.; Santos, R.R.; Hautekiet, V.; De Backer, P.; Chiers, K.; Ducatelle, R.; Croubels, S. Deoxynivalenol impairs hepatic and
intestinal gene expression of selected oxidative stress, tight junction and inflammation proteins in broiler chickens, but addition
of an adsorbing agent shifts the effects to the distal parts of the small intestine. PLoS ONE 2013, 8, e69014. [CrossRef]
28. Santos, R.R.; Awati, A.; Roubos-van den Hil, P.; Tersteeg-Zijderveld, M.H.G.; Koolmees, P.A.; Fink-Gremmels, J. Quantitative
histo-morphometric analysis of heat stress related damage in the small intestines of broiler chickens. Avian Pathol. 2015, 44, 19–22.
[CrossRef]
29. Dersjant-Li, Y.; Van de Belt, K.; Van der Klis, J.D.; Kettunen, H.; Awati, A. Effect of multi-enzymes in combination with a direct-fed
microbial on performance and welfare parameters in broilers under commercial production settings. J. Appl. Poult. Res. 2015,
24, 80–90. [CrossRef]
30. Quaedackers, J.S.; Beuk, R.J.; Bennet, L.; Charlton, A.; Oude Egbrink, M.G.; Gunn, A.J.; Heineman, E. An evaluation of methods
for grading histologic injury following ischemia/reperfusion of the small bowel. Transplant Proc. 2000, 32, 1307–1310. [CrossRef]
31. Santos, R.R.; Awati, A.; Roubos-van den Hil, P.; van Kempen, T.A.T.G.; Tersteeg-Zijderveld, M.H.G.; Koolmees, P.A.; Smits,
C.; Fink-Gremmels, J. Effects of a feed additive blend on broilers challenged with heat stress. Avian Pathol. 2019, 48, 582–601.
[CrossRef]You can also read