Loss and Waste in the Australian Fresh Apple Value Chain
←
→
Page content transcription
If your browser does not render page correctly, please read the page content below
Available online at www.centmapress.org
                                                                                     INTERNATIONAL
                                                                                       JOURNAL ON
                                                                                      FOOD SYSTEM
Proceedings in
                                                                                        DYNAMICS
System Dynamics and Innovation in Food Networks 2020

Loss and Waste in the Australian Fresh Apple Value Chain
Sarah Rohr, Stuart Mounter, Euan Fleming and Garry Griffith
Respectively, PhD student, Associate Professor, Emeritus Professor and Adjunct Professor, Centre for
Agribusiness, UNE Business School, University of New England, Armidale NSW Australia.

srohr@myune.edu.au; smounte2@une.edu.au; efleming@une.edu.au; ggriffit@une.edu.au

ABSTRACT

Apples are a significant and popular fruit among the Australian population, and in the case of fresh apples, the
domestic market is relatively self-sustaining. Retail and consumer preferences are the driving force for quality
standards for apples along the chain, with actors working to provide the best quality selection of produce. In
order to meet these high standards, loss and waste occurs in the lower grades which are simply a by-product
of first grade production. Globally, loss and waste of fresh produce is amongst the highest of all food groups
and from the limited data available, apples appear to be no exception. While there is not accurate specific data
regarding loss and waste data of fresh apples in the Australian value chain, reporting is increasing as is
awareness of the broader issues of food loss and waste. Following along the value chain, there appear to be
discrepancies in quantities of fresh apples available at the various stages, with these variations potentially
reflective of loss and waste along the chain. Using best estimates from the literature, the total amount of fresh
apples, conservatively, that is potentially diverted from the Australian fresh apple supply chain is around
163,000 tonnes which is about 41 per cent of total production at the farm level. What is also lacking from
Australian market data and literature, other than robust primary loss and waste data, is the cost of food loss
and waste, and the extent of the externalities that occur due to loss and waste along the value chain. Not only
do negative externalities incur costs to the broader society, there are additional costs of intervention, and
analysis is required to determine the feasibility and appropriateness of intervention strategies.

Keywords: apple industry; food loss and waste; externalities; policy options

Part 1: The Australian Apple Industry

Introduction

Worth over $A511 million in the 2016/2017 period, the Australian apple industry was the third most valuable
fruit industry in Australia (excluding grapes) according to the ABS (2018). Despite an overall production
increase in the Australian fruit and nut industry, there has been a slight decline in the production of apples in
the last few years, although apples were still purchased by 91 per cent of Australian households in 2018 (Hort
Innovation, 2019). In 2014/2015 the apple industry was the highest ranked fruit industry at almost $A556
million but was third behind bananas and almonds in 2018 (ABS, 2018). Of Australia’s total apple production in
2018, almost a third, 29 per cent was sent to processing (Hort Innovation, 2019) with the remaining 71 per
cent supplied to the fresh apple value chain. The Australian market is primarily supplied by domestic
production with insignificant volumes of imports and exports. Although Australia is a net exporter of apples
(Hort Innovation, 2019), just over 5,060 tonnes were exported in 2017/2018 and only 1,145 tonnes of fresh
apples were imported, with imports divided fairly equally between China and New Zealand. The processed
apple industry comprises a much higher proportion of trade and includes dried products and juices. In 2018
import and export values of juice were $A38.2 million and $A4.0 million, respectively, while dried apple
imports and exports were worth $A4.4 million and $A0.68 million, respectively (Hort Innovation, 2019).
Although processing is a significant sector of the Australian apple industry, the focus of this analysis in the
context of food loss and waste is the Australian fresh apple value chain.

                                                      134
DOI: http://dx.doi.org/10.18461/pfsd.2020.2012
Griffith et al. / Proceedings in System Dynamics and Innovation in Food Networks 2020, 134-152
Apple Production
The lead time of the average apple tree from crop planting to commercial harvest is between four and five
years. According to ABS yield data, there were more than eleven and a half million trees of fruit-bearing age in
2016/2017 that produced an average yield of 26.9 kg of fruit per tree (Table 1).
Table 1. Australian Apple Yield Data, 2016/2017
Commodity description Estimate
Fruit and nuts - Pome fruit - Apples - Total trees (no.) 13,166,709
Fruit and nuts - Pome fruit - Apples - Trees not yet of bearing age (no.) 1,521,446
Fruit and nuts - Pome fruit - Apples - Trees of bearing age (no.) 11,645,263
Fruit and nuts - Pome fruit - Apples - Production (kg) 313,730,397
Fruit and nuts - Pome fruit - Apples - Yield (kg/tree) (e) 26.9
Source: Australian Bureau of Statistics (2018)
Domestically produced apples are available for consumption year-round, made possible by storage of fresh
apples in controlled atmosphere conditions, with availability the highest in March/ April for New South Wales,
Victoria and Tasmania and slightly later, April/ May, for Queensland, Western Australia and South Australia
(Hort Innovation, 2019). The domestic fresh apple market mostly consists of three dominant varieties: Pink
Lady which accounts for 41 per cent of available apples, Gala 23 per cent and Granny Smith 18 per cent, with
the remaining 18 per cent made up of numerous, less-dominant varieties (Hort Innovation, 2019).
On average it costs between $A400 and $A450 per tonne (approximately $0.40 to $0.45 per kg) to produce
apples. Farmers aim to sell as much of their harvest as possible to the fresh market to receive the highest
price (Anonymous, personal communication, October 17, 2019). Although national data suggests that almost
one third of apples in the domestic market are supplied to processing, one industry source stated a much
lower proportion at an average of seven to ten percent of their producers’ harvests. It was noted that some
producers pay their pickers to leave lower quality apples on the tree as the additional costs in handling and
storage are not covered by the processing market price. The Australian ‘apple year’ ranges from April to March
and most producers aim to have most of their harvest (around 75 per cent) sold by October, to account for
reduced demand in the summer months due to consumer preferences for more exotic fruits (Anonymous,
personal communication, October 17, 2019). Overall domestic apple farm-gate production, prices and
aggregate values for the last three years, are listed in Table 2.
Table 2. Total Australian Apple Production, Value and Prices, 2016-2018
Years Ending
2016 2017 2018
Production (t) 316,758 319,686 315,185
Value ($m) 441.50 497.20 465.30
Price ($/kg) 1.39 1.56 1.48
Source of data: Hort Innovation (2017/2018), Australian Horticulture Statistics Handbook
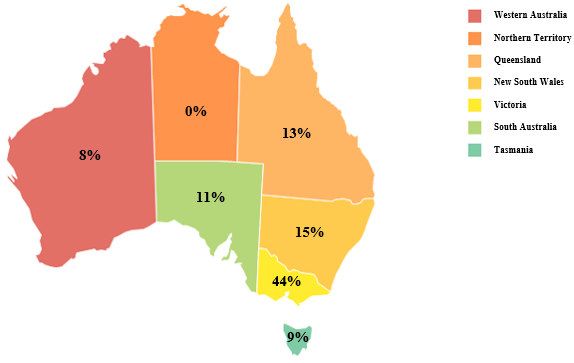
Apples are grown in all Australian states (Figure 1), however almost half of all domestic apples are grown in
Victoria (Hort Innovation, 2019). The major apple producing areas within each state are:
Victoria: Goulburn Valley, Gippsland, and Yarra Valley
New South Wales: Batlow and Orange
Queensland: Stanthorpe
South Australia: Adelaide Hills region
Tasmania: the Huon Valley and the North Western region
Western Australia: Donnybrook and Manjimup
135
DOI: http://dx.doi.org/10.18461/pfsd.2020.2012Griffith et al. / Proceedings in System Dynamics and Innovation in Food Networks 2020, 134-152
These apple producing regions are mapped in Figure 2 to demonstrate the spatial variation among these areas.
Although different geographically, the climatic conditions exhibit similarity with typically mild temperatures
throughout summers, a cool autumn and a cold winter. Reasonable rainfall is ideal, but to ensure water
requirements are fulfilled, reliable access to water for irrigation is needed. Specificity of exact climate
conditions can differ among varieties however a general guideline for the trees to break dormancy is 500-650
hours below 7ºC (AgriFutures, 2017).
Figure 1. 2017/2018 Australian Apple Production by State*
*As by State, Australian Capital Territory is not identified independently, and is instead included within New
South Wales production. Northern Territory production is negligible in consideration of total production in
Australia. Source: Adapted data from Hort Innovation, 2019
Figure 2. Australian Apple Growing Regions
136
DOI: http://dx.doi.org/10.18461/pfsd.2020.2012Griffith et al. / Proceedings in System Dynamics and Innovation in Food Networks 2020, 134-152
Imports and Exports
While domestic production accounts for almost all of the fresh apple supply in the domestic market, there are
some small-scale import and export activities (Table 3 and Table 4).
Table 3. Australian Apple Exports, 2016-2018
Years
2016 2017 2018
Fresh Export Volume (t) 4,665 4,950 5,060
Fresh Export Value ($m) 12.40 12.70 11.30
Fresh Export Price ($/kg) 2.66 2.57 2.23
Source of data: Hort Innovation (2017/2018), Australian Horticulture Statistics Handbook
Given the total volume and value, export apples receive a higher price than fresh apples in the domestic
market which may be due to accounting for marketing inputs that are required to make the fruit available for
export. Similarly, the price per kg of imported apples (Hort Innovation, 2018) also exceeds the domestic price
per kilogram due to the inputs of marketing and distribution.
While imports of fresh apples are relatively low, they are available to the market in limited quantities from
August through to March.
Table 4. Australian Apple Imports, 2016-2018
Years
137
DOI: http://dx.doi.org/10.18461/pfsd.2020.2012Griffith et al. / Proceedings in System Dynamics and Innovation in Food Networks 2020, 134-152
2016 2017 2018
Fresh Import Volume (t) 619 1,053 1,145
Fresh Import Value ($m) 1.60 2.40 2.90
Fresh Import Price ($/kg) 2.58 2.28 2.53
Source of data: Hort Innovation (2017/2018), Australian Horticulture Statistics Handbook
Processing
The most recent annual processing volumes from the past three years are shown in Table 5.
Table 5. Australian Domestic Apple Processing, 2016-2018
Years
2016 2017 2018
Processing (t) 92,901 92,555 92,156
Source of data: Hort Innovation (2017/2018), Australian Horticulture Statistics Handbook
Anecdotal information from one industry source indicated that producers aim for 10 per cent or less of apple
production sales to the processing sector (Anonymous, personal communication, October 17, 2019). These
figures were corroborated by another organisation within the industry who indicated that approximately 70
per cent of the collected harvest was marketed to retail as first grade apples, around 20 per cent was
1
marketed as second grade and the remaining 10 per cent was sent for processing (Anonymous, personal
communication, October 12, 2019). The prices paid by processors depends on the final product end use (as
there are different standards for the type of processing such as slices for baking, puree, cider and juicing) and
fluctuate depending on demand and seasons. A conservative average price paid for processing apples is
around $A300 to $A350 per tonne ($0.30 to $0.35 per kg) however this may increase to $A700 per tonne in
peak times (Anonymous, personal communication, October 12, 2019). This $A300 to $A350 per tonne range is
lower than the average cost of production ($A400 to $A450 per tonne) and is a potential driver of apple waste.
Fresh Supply/Wholesale
Hort Innovation determines the Australian fresh supply of apples to be:
Fresh supply = production – exports – processing + imports
Notionally, this is the supply of fresh apples inclusive of any loss or waste. Based on Hort Innovation’s formula,
the fresh supply of apples net of processing and trade is shown in Table 6 for the years 2016-2018. On average
the fresh/wholesale supply accounts for approximately 70 per cent of the total domestic production.
Table 6. Australian Wholesale Apple Supply, 2016-2018
Years
2016 2017 2018
Fresh Supply (t) 219,811 223,234 219,115
Fresh Wholesale Value ($m) 490.20 554.50 519.50
Wholesale Supply ($/kg) 2.23 2.48 2.37
Fresh Supply per Capita (kg) 9.12 9.11 8.79
Source of data: Hort Innovation (2017/2018), Australian Horticulture Statistics Handbook
While these figures are indicative of fresh wholesale supply, it is important to note that a small proportion may
be sold direct from the farm to the consumer, bypassing conventional wholesale trade. Direct sale options,
1
Some apples are produced solely for processing, however estimates are not available.
138
DOI: http://dx.doi.org/10.18461/pfsd.2020.2012Griffith et al. / Proceedings in System Dynamics and Innovation in Food Networks 2020, 134-152
including those at the farm gate, markets and food service providers, have little regulation of standards and
minimal cost to market, however the volume is typically lower and there is more work required for self-
marketing and distribution. Conventional marketing options for producers are typically through cooperatives,
agents or grower organisations. There are currently two apple cooperatives in Australia, one in South Australia
and one in the Orange region of New South Wales. Grower organisations are somewhat of an adapted
cooperative, one primary organisation has an ownership component that is not exclusive to members, and
adheres to corporate structure (Anonymous, personal communication, October 17, 2019). The cooperatives
and grower organisations provide the storage, packing and marketing services that otherwise would usually be
provided by a wholesaler or trader. The exact number of apple producer organisations and wholesale traders
varies as they frequently trade a range of fruits and may or may not trade apples at a given time. The sale of
fruits from the intermediaries (cooperatives, wholesale traders or grower organisation) to the dominant
supermarkets is typically done through contracts under the provision of the supermarket standards for the
apples (AgriFutures, 2017).
The Australian Fresh Apple Retail Market
There are several avenues through which fresh apples can be marketed. The five main distribution channels
are:
1. Direct sales from farms to supermarkets.
2. Sales from farms to processors.
3. Sales to restaurants and food service organisations.
4. Direct sales to consumers at farm gate or farmers markets.
5. Sales through wholesale or export markets.
There are a range of factors which affect each selling method and the utilisation of the pathways to the
consumer. Sales directly to supermarkets are often in sizeable quantities however market access can be quite
difficult and openings limited. Spencer and Kneebone (2012) noted that approximately 17 per cent of fruit and
vegetables in Australia are transferred to the food service market and 83 per cent are directed to retail outlets,
including supermarkets and specialty stores. Based on Spencer and Kneebone’s estimates the split of fresh
apple wholesale supply for years 2016 -2108 is shown in Table 7.
Table 7. Australian Apple Destinations from Wholesale, 2016-2018
Years
2016 2017 2018
Retail (t) 182,443 185,284 181,865
Food Service (t) 37,368 37,950 37,250
Source of data: Adapted from Hort Innovation (2017/2018), Australian Horticulture Statistics Handbook
and Spencer and Kneebone (2012)
The data representing what was purchased from retail outlets have been shared by Harvest to Home (2018)
reported the breakdown of purchases of apples from retail outlets (including major supermarkets, other
supermarkets and other specialty stores). Major supermarkets accounted for 77 per cent of apple purchases,
7.7 per cent were bought at other supermarkets and 15.3 per cent were obtained at non-supermarkets such as
specialty stores and grocers. Household purchase data calculated by Harvest to Home (2018) is presented in
Table 8.
Table 8. Australian Fresh Apple Retail Household Purchases, 2016-2018
Years
2016 2017 2018
Total Retail Volume Purchased* (t) not available 125,875.2 120,268.8
Average Annual Purchases ($) - 47.70 50.70
Average Annual Weight Purchased per Household (kg) - 14.90 14
Average Annual Weight Purchased per Capita (kg) - 5.73 5.54
139
DOI: http://dx.doi.org/10.18461/pfsd.2020.2012Griffith et al. / Proceedings in System Dynamics and Innovation in Food Networks 2020, 134-152
Purchased $ per kg - 3.20 3.52
* Based on projected number of households
Source of data: Harvest To Home (Hort Innovation and Nielsen)
Although these data are only available for the past two years, it provides an insight into the quantities of fresh
apples purchased by Australian households and the average retail prices paid. The average purchase price per
kilogram was calculated as average annual purchases ($) divided by the average annual weight purchased (kg).
The total amount purchased equates to around 66 per cent and 68 per cent of the estimated amounts
available to retail as derived from the fresh supply. Given the significant difference in the volume available for
retail and the recorded purchase data, it can be assumed that loss and waste occurs along the value chain,
specifically between the retail and consumer stages.
There is no recent consumption data for apples. Levy data from the Department of Agriculture and Water
Resources (cited by Apple and Pear Australia Ltd, 2019) indicates that annual per capita consumption in
2014/2015 was 7.98kg. This is higher than the most recent per capita purchase data, however per capita apple
consumption declined from 2012 to 2015 (Apple and Pear Australia Ltd, 2019). If this decrease in apple
consumption continued, then the recent purchase data may be approximate to current consumption.
The Australian fresh apple value chain is illustrated in Figure 3. Data are annual averages calculated for the
2
three-year period 2016-2018 .
2
The quantities displayed in Figure 3 show some discrepancies between the various stages of the value chain,
with not all apples accounted for. The most significant discrepancy is between retail availability and consumer
purchases. As these quantities are averaged from the abovementioned data sets as well as across time, it is
assumed that the discrepancies represent food loss and waste along the value chain.
140
DOI: http://dx.doi.org/10.18461/pfsd.2020.2012Available online at www.centmapress.org
INTERNATIONAL
JOURNAL ON
FOOD SYSTEM
Proceedings in
DYNAMICS
System Dynamics and Innovation in Food Networks 2020
Figure 3. The Australian Fresh Apple Value Chain, 2016-2018 Averages
141
DOI: http://dx.doi.org/10.18461/pfsd.2020.2012Griffith et al. / Proceedings in System Dynamics and Innovation in Food Networks 2020, 134-152
142
DOI: http://dx.doi.org/10.18461/pfsd.2020.2012Available online at www.centmapress.org
INTERNATIONAL
JOURNAL ON
FOOD SYSTEM
Proceedings in
DYNAMICS
System Dynamics and Innovation in Food Networks 2020
Part 2: Apple Loss and Waste
Current Estimates
Food losses and waste occur throughout all food value chains however losses of edible fruits and vegetables
are amongst the highest of all food groups (Laurentiis et al., 2018). Gustavsson et al. (2011) stated that over 50
per cent of edible fruits and vegetables are removed from the entire value chain in the North America and
Oceania region (including Australia). Most of these losses occur pre-farm gate and at the consumer level, with
smaller amounts of loss and waste occurring at the post-harvest, processing and distribution stages.
Gustavsson et al. (2011) also noted that 20 per cent of fruits and vegetables are lost before leaving the farm.
Accurate estimates of on-farm loss values are difficult to obtain and many of the estimates in the existing
literature are similar to or based on the values provided by Gustavsson et al. (2011). Recent literature, such as
Baker et al. (2019), who obtained on-farm primary data, and Gooch et al. (2019), indicate that losses early in
the value chain are much higher than previously thought. Although Baker et al.’s paper is based on field crops,
a vast difference between prior estimates and the observed rates of on-farm losses is highlighted. Baker et al.
also consider ‘walk-by’ losses which refer to unharvested fruit or whole crops that occurs when the cost of
handling and storing the fruit is greater than the market price or when the fruit is not suitable to market.
These losses are prominent in fresh produce, however difficult to measure without standardised on-site
surveys. It should be noted, that in accordance with many food loss and waste definitions that define losses or
waste as disposal of edible product, the apples that are not harvested would need to be of edible standard,
and free from disease, pests, and other damage (Baker et al., 2019) to be considered as on-farm loss.
Gustavsson et al. (2011) is also used as the source for losses at the post-harvest handling, storage, processing
and packaging stages of the value chain, as little data exists on fruit losses at pre-retail and consumer stages in
developed countries. Gustavsson et al. stated that post-harvest handling and storage stages incur a 4 per cent
loss with an additional 2 per cent occurring at the processing and packaging stage. At the food service level,
there are varying estimations of food that is wasted versus food that a goes to landfill. WRAP’s (2013) report
states that 20 per cent of food products in the food service industry are not consumed, while locally, RMIT’s
(2016) interim data indicated that approximately 40 per cent of product purchased by food service businesses
is not consumed. However, the Department of Environment and Energy (2013) states that only 15 per cent of
food waste from New South Wales and Victorian commercial and industrial sectors was sent to landfill, the
remaining amount was either recycled or recovered. When accounting for food loss and waste it is important
to define what constitutes loss or waste. These figures around levels of food waste in food service discussed
here are an example, as the proportion of food that is not consumed differs greatly from the proportion sent
to landfill.
At the retail level, there is consistency in estimates of food waste values, particularly in developed countries.
Gustavsson et al. (2011) stated that 12 per cent is wasted at retail and 28 per cent at the consumer stage.
Similar values were reported by Buzby et al. (2014), with the United States-based data indicating that 12 per
cent is lost at the retail level and 25 per cent at consumption. Loss and waste at the retail level has
implications in terms of the cost of displaying the fruit (rent, electricity and infrastructure) and in the handling
and management of the waste (such as disposal and storage).
There are however difficulties associated with the measurement and calculation of household waste rates. In
2016/17 it was estimated that Australian households alone generated 2.5 million tonnes of food waste
(Australian Government, 2017, as cited by ARCADIS, 2019, pp. 56). There is sparse literature regarding
household waste of fruit in Australia, however there is available data abroad, particularly in the European
Union. Laurentiss et al. (2018) reported that out of the 52kg of fruit purchased per capita in the European
Union annually, 5kg is lost as avoidable waste (that is edible waste) and 9kg is unavoidable waste. Hence, on
average, only 73 per cent of purchased fruit is consumed. Some similarity can be inferred regarding the waste
143
DOI: http://dx.doi.org/10.18461/pfsd.2020.2012Griffith et al. / Proceedings in System Dynamics and Innovation in Food Networks 2020, 134-152
amounts in the European Union and Australia with Gustavsson et al. (2011) finding similar measurements of
European Union and Oceania (inclusive of Australia) levels of food waste.
Supermarkets are the primary drivers of the quality of apples at the retail level, and the early stages in the
value chain strive to provide the required grades and quantities. The standards are typically around aesthetic
qualities, such as size, shape and colour as well as firmness and mineral content. These standards, either real
or perceived, can be contributing factors of food loss and waste (Minor et al., 2019). Retailers are unlikely to
accept fruit that consumers are unwilling to eat or purchase as the burden of unsalable food incurs additional
costs and resources (Minor et al, 2019). Additional food waste also occurs once consumers take the apples
home. From Figure 2 it is clear that the quantity purchased by consumers is considerably less than the amount
available for sale via retail outlets and that food loss and waste has likely occurred. In addition, losses and
waste that occur in earlier stages of the value chain are not identified in the supply of fresh apples. While there
is little data available on apple food loss and waste, in Australia or elsewhere, more generalised fruit food loss
and waste literature in similar socio-economic environments is available. One of the most recent Australian
articles on food loss and waste is the Australian National Food Waste Baseline Report by ARACDIS (2019)
which provides estimates of loss and waste values for specific foods and food groups across the 2016/17
period. For fresh fruit as a whole, it is estimated that 174,000 tonnes of fruit is lost at the farm level (ARCADIS,
2019).
The production values provided by the ABS (2018) are the values post on-farm losses, which have already
occurred. Rates of loss are dependent on growing conditions, technological factors, market avenues and retail
standards. The management of vegetable and fruit on-farm losses in Australia is primarily produce that is not
harvested, with over 86 per cent of losses accounted for as either ‘not harvested or ploughed in’. The
remaining 14 per cent is utilised as animal feed (ARCADIS 2019). According to one industry source, on-farm
losses among their member producers are minimal and mostly occur due to apples being damaged by
environmental factors (such as hail and pests). To minimise these losses there is a relatively high adoption of
the use of hail nets. These hail nets reduce the damage from hail and minimise damage from pests such as
birds, reduce the rate of ‘sun burn’, and increase water retention in the apples which helps maintain the fruit
quality and firmness. The use of these nets has increased the overall yield and quality of the apples which
reduces losses and increases the revenue for growers (Anonymous, personal communication, October 17,
2019).
Losses also occur post-farm gate. Following harvest most of the fruit is transported to a facility for sorting,
storing and packing for supply to the fresh apple distribution channel or to processing. Losses occur at the
packing / storage stage due to drivers such as poor handling, insufficient storage conditions or infestation by
pests or disease. Not specific to apples, or fruit, but ARCADIS (2019) estimates that the loss of fruit and
vegetables at the packing stage amounts to 422,000 tonnes collectively. Discussions with domestic
organisations revealed that proximity to alternative destinations is one of the biggest factors regarding the
management of farm and packing stage losses. An example is an organisation that offers damaged apples (that
are not suitable for consumption or processing) to nearby farmers for livestock feed. These apples are offered
free of charge and are collected by the farmer. The organisation does not have to pay to dispose of these
potential losses, the farmer only has the expense of the pickup and the apples are returned to the food value
chain as livestock feed. This is only feasible however, when the alternative destinations are nearby, otherwise
the transaction costs may exceed the benefit (of loss and waste minimisation).
Estimates of loss of fresh fruit at the retail level suggest that approximately 12 per cent of produce is removed
from the value chain at the retail level (Gustavsson et al., 2011; and Buzby et al., 2014). Locally, and differing
from international estimates, the ARCADIS (2019) National Food Waste Baseline report suggested that just 3
per cent of total Australian food waste is generated at the retail level. There have been a number of estimates
of Australian household food waste. TAI (2005 as cited by Mason et al., 2011, pp 1) reported that Australian
households wasted $5.2 billion on food that was not consumed. In 2009, the New South Wales Government’s
“Love Food Hate Waste” (2009) estimated that New South Wales residents alone waste $2.5 billion worth of
food based on household survey data. A more recent, national estimate, was that 7.3 million tonnes of food
waste occurred across Australian value chains in 2016/17 (ARCADIS, 2019), equating to 298kg per capita.
144
DOI: http://dx.doi.org/10.18461/pfsd.2020.2012Griffith et al. / Proceedings in System Dynamics and Innovation in Food Networks 2020, 134-152
The costs of food loss and waste extend to environmental and social costs that are external to private market
transactions. In regard to apples, the most likely externalities are greenhouse gas emissions (GHG) and the use
of finite resources as inputs into apple production.
Potential estimates of loss and waste (edible product that is not consumed) in the Australian fresh apple value
chain are shown in Figure 4, by applying Gustavsson et al. (2011)’s estimated percentages as shown in Table 9.
Although generalised across all fruits and vegetables, applying Gustavsson et al. (2011)’s percentages for loss
and waste will provide a consistent way of making the estimates, which can then be compared with the
individual estimates from other studies which look at single stages of the chain. For example, applying their
loss value of 20 per cent prior to farm gate to the official Australian production data of 317,210t, it can be
interpreted that the 317,210t of apples officially recorded represents only 80 per cent of total fruit originally
produced. Thus, 396,513t were actually produced but 79,303t were lost on the farm.
Table 9. Estimated/Assumed Fruit and Vegetable Loss and Waste
Agricultural Production 20 per cent
Postharvest handling and storage 4 per cent
Processing and packaging 2 per cent
Distribution: Supermarket Retail 12 per cent
Consumption 28 per cent
It should be noted that this does not necessarily represent the amount that ends up in landfill, as losses and
wastes may be diverted to compost, animal feed or donated. When there were multiple waste values
referenced, the more conservative was applied.
The total amount of fresh apples, conservatively, that is potentially diverted from the Australian fresh apple
supply chain is over 163,000t which is around 41 per cent of total production at the farm level. This estimate is
not inconsistent with reports by Gustavsson et al. (2011) that over 50 per cent of fresh fruit and vegetables are
lost or wasted. Loss and waste of this magnitude has potential significant environmental implications and may
incur substantial costs to manage such a volume.
Main Drivers
The types of losses and wastes are driven by various factors at different stages in the value chain. Drivers of
losses and wastes differ at the numerous stages of the value chain and have been identified through literature
(such as ARCADIS, 2019) and through discussions with industry participants. Drivers can often be managed to
reduce the amount of loss or waste and to increase the yield and maintain fruit quality at all stages of the
value chain. The types of losses and waste that occur throughout the fresh apple value chain and the drivers
that contribute to these losses and waste are summarised in Table 10. These losses and wastes may be able to
be minimised or avoided through a range of management strategies and technologies employed by the actors
at the specific stage of the value chain. However, without appropriate management, there is the potential for
the primarily negative externalities listed in the table, to be produced.
Future Challenges
Loss and waste is not the only by-product from unconsumed apples. There are a range of externalities, both
positive and negative, that result, impacting those outside the direct value chain. The extent of these
externalities, particularly the undesirable negative impacts, can be minimised with employment of the
management strategies mentioned above. The ultimate destination of apples removed from the value chain is
also significant to the greater impact, as does the stage of the chain where it occurs (Beretta et al., 2017). An
example of this is food loss and waste which ends up in landfill and emits methane which has a global warming
potential of 25 times greater than carbon dioxide (Ishangulyyev et al., 2019). The negative externalities of the
various types of losses and waste at each stage are demonstrated in Table 11 below.
There are also positive externalities that are produced as a result of both food production and the production
of food loss and waste. Examples of such are as follows: the economic benefit of tourism to apple producing
145
DOI: http://dx.doi.org/10.18461/pfsd.2020.2012Griffith et al. / Proceedings in System Dynamics and Innovation in Food Networks 2020, 134-152
regions, safe standard of the food available (Pretty et al., 2005) and inexpensive feed for livestock producers.
To understand the extent of these externalities, accurate and robust measurement and valuation is required.
Further to the costs and benefits of the mentioned externalities, there should also be consideration of the
types of externalities, pertaining to both the chain and the broader society. Chain externalities are the costs or
benefits imposed on a third party to the chain, as a result of a chain operating imperfectly (Malcom et al.,
2017). The chain has the opportunity to internalise the externalities, and in particular the positive externalities,
and so add value to the chain. Social externalities are the costs or benefits of an economic activity of the
greater social capital and quality of life of
146
DOI: http://dx.doi.org/10.18461/pfsd.2020.2012Available online at www.centmapress.org
INTERNATIONAL
JOURNAL ON
FOOD SYSTEM
Proceedings in
DYNAMICS
System Dynamics and Innovation in Food Networks 2020
3
Figure 4. Estimates of Food Loss and Waste across the Australian Fresh Apple Value Chain
3
Figure 4 illustrates Gustavsson et al.’s (2011) rates of food loss and waste of fresh produce in the Oceania region applied to the Australian apple value chain. These
amounts of loss and waste do not equate to the assumed loss and waste amounts from the discrepancies between the value chain stages. The application of these rates of
food loss and waste are to indicate the magnitude of loss and waste when applied to a quantified value chain.
147
DOI: http://dx.doi.org/10.18461/pfsd.2020.2012Griffith et al. / Proceedings in System Dynamics and Innovation in Food Networks 2020, 134-152
148
DOI: http://dx.doi.org/10.18461/pfsd.2020.2012Available online at www.centmapress.org
INTERNATIONAL
JOURNAL ON
FOOD SYSTEM
Proceedings in
DYNAMICS
System Dynamics and Innovation in Food Networks 2020
Table 10. Types and Drivers of Loss and Waste in the Australian Apple Value Chain
Type of % of Loss/
Stage of Loss or
Loss or Waste at VC Drivers Management Strategies
Value Chain Waste
Waste stage
Environmental Hail Nets
impacts Sale of lower grade fruit
Walk-by Pests to processing
losses Improper timing of Losses to livestock feed
Farm Loss 20 %
Damaged harvest
Fruit Insufficient market
prices
Outgrades
Surplus supply Correct storage (can be
Improper storage variety specific)
Storage, Damaged Insufficient market Sorting technology
Packing and Loss Fruit prices Sale of outgrades or
Processing Spoilage Handling damaged stock to
Outgrades processing or livestock
feed
6%
Surplus supply Correct storage
Damaged
Improper storage Attentive marketing
Wholesale Loss Fruit
Handling Adhering to required
Spoilage
Transportation transportation methods
Surplus supply Attentive forecasted
Damaged
Retail and Improper storage purchasing
Waste Fruit 12 %
Distribution Transportation Discounting produce
Spoilage
Donating unsold produce
Surplus supply Appropriate supply,
Food Service Waste Spoilage 20 % Improper storage storage and preparation
Incorrect preparation Donating unused produce
Surplus purchasing Purchasing as required
Improper storage Composting
Consumer Waste Spoilage 28 % Incorrect preparation Change preparation
Unplanned methods
consumption events
Table 11. Negative Externalities of Apple Loss and Waste
% of Loss/
Stage of Loss or Type of Loss or
Waste at VC Negative Externalities
Value Chain Waste Waste
stage
Possible information costs associated with
Walk-by losses
Farm Loss 20 % education.
Damaged Fruit
Use of finite resources
Storage, GHG emissions from disposal and
Damaged Fruit
Packing and Loss processing.
Spoilage
Processing 6% Use of resources and fuel
Damaged Fruit GHG emissions from disposal and
Wholesale Loss
Spoilage processing.
149
DOI: http://dx.doi.org/10.18461/pfsd.2020.2012Griffith et al. / Proceedings in System Dynamics and Innovation in Food Networks 2020, 134-152
Use of resources and fuel
Retail and Damaged Fruit Use of resources, fuel and GHG emissions
Waste 12 %
Distribution Spoilage
Food Service Waste Spoilage 20 % Use of resources, fuel and GHG emissions
GHG emissions from disposal
Consumer Waste Spoilage 28 %
Use of resources and fuel
other individuals (Phelan et al., 2017). Evaluation of these aspects enables appropriate management of them
and determination of if intervention is required.
Policy Framework
Assessment of the drivers of food loss and waste may be used when determining the most suitable policy
options (Thyberg and Tonjes, 2016) and drivers applicable to the Australian apple value chain include those
listed in Table 10. Currently there is little to no government involvement driving the management of food loss
and waste in the Australian apple value chain and as a result, the main driver for reducing food loss and waste
in the Australian apple value chain is the cost incurred to the actors at each stage from either the disposal or
lost revenue (Anonymous, personal communication, 21 October 2019). The management strategies employed
however are only a response to the private costs, and do not consider the potential greater cost incurred by
externalities. Inclusion of externalities and the potential cost if left unaddressed must also be considered as
otherwise the value chain may impose a cost to the greater market. Thorough evaluation of the costs of both
food loss and waste and consequential externalities is required in addition to the costs and benefits of applying
potential measures. The method of applying such policies must also be explored, whether it be via a
government department, individual private actors or a coordination approach among stakeholders.
Conclusion
Apples are a significant and popular fruit among the Australian population, and in the case of fresh apples, the
domestic market is relatively self-sustaining. Retail and consumer preferences are the driving force of
standards for apples along the chain, with actors working to provide the best quality selection of produce. In
order to meet these high standards, loss and waste occurs in the lower grades which are simply a by-product
of first grade production. Globally, loss and waste of fresh produce is amongst the highest of all food groups
(Gustavsson et al., 2011) and from the limited data available, apples appear to be no exception. While there is
not accurate specific data regarding loss and waste data of fresh apples in the Australian value chain, reporting
of such issues is increasing as is awareness of the greater issues of food loss and waste. Following along the
value chain, there appear to be discrepancies in quantities of fresh apples available at the various stages (Hort
Innovation, 2019, and Harvest to Home, 2019), with these variances potentially reflective of loss and waste
along the chain. What is lacking from Australian market data and literature, other than robust primary loss and
waste data, is the cost of food loss and waste, and accounting for externalities that occur due to loss and
waste along the value chain. Not only do negative externalities incur costs to greater society, there are
additional costs of intervention and analysis is required to determine the feasibility and appropriateness of
intervention strategies.
References
AgriFutures (2017). Apples. Viewed November 21, 2019. Accessed at: https://www.agrifutures.com.au/farm-
diversity/apples/
Apple & Pear Australia Ltd. (2019). Statistics. Viewed March 22, 2019. Accessed at:
https://apal.org.au/industry-info/apple-and-pear-statistics/
ARCADIS Design & Consultancy (2019). National Food Waste Baseline: Final assessment report. Viewed
October 11, 2019. Accessed at: https://www.environment.gov.au/protection/waste-resource-recovery/food-
waste
Australian Bureau of Statistics (2018). Value of Agricultural Commodities Produced, Australia, 2016-2017.
‘Table 1: Value of Agricultural Commodities Produced- Australia - 2016-17, cat. no. 75030D001_201617,
150
DOI: http://dx.doi.org/10.18461/pfsd.2020.2012Griffith et al. / Proceedings in System Dynamics and Innovation in Food Networks 2020, 134-152
viewed 16 April 2019. Accessed at: http://www.abs.gov.au/AUSSTATS/abs@.nsf/DetailsPage/7503.02016-
17?OpenDocument
Department of the Environment and Energy (2013). National Waste Reporting 2013, Factsheet – Food Waste.
Viewed April 2, 2019. Accessed at: http://www.environment.gov.au/protection/waste-resource-
recovery/national-waste-reports/national-waste-report-2013/organic-waste
Baker, B.A., Gray, L.C., Harwood, M.J., Osland, T.J., Tooley, J.B.C. (2019). On-farm food loss in northern and
central California: Results of field survey measurements. Resources, Conservation & Recycling 149, pp 541-549.
Beretta, C., Stucki, M., Hellweg, S. (2017). Environmental Impacts and Hotspots of Food Losses: Value Chain
Analysis of Swiss Food Consumption. Environmental Science and Technology, 51, pp 11165-11173.
Buzby, J.C., Wells, H.F., Hyman, J. (2014). The Estimated Amount, Value, and Calories of Postharvest Food
Losses at the Retail and Consumer Levels in the United States. Washington, D.C., U.S. Department of
Agriculture, Economic Research Service, February.
Gooch, M., Bucknell, D., LaPlain, D., Dent, B., Whitehead, P., Felfel, A., Nikkel, L., Maguire, M. (2019). The
Avoidable Crisis of Food Waste: Technical Report. Ontario, Canada, Value Chain Management International
and Second Harvest.
Harvest to Home (2019). Apples Report, 2019. Viewed March 22, 2019. Accessed at:
https://www.harvesttohome.net.au/fruitmushroomnuts
Hort Innovation (2019). Australian Horticulture Statistics Handbook, Fruit, 2017/18. Horticulture Innovation
Australia Limited 2019. Viewed April 2, 2019. Accessed at: https://www.horticulture.com.au/growers/help-
your-business-grow/research-reports-publications-fact-sheets-and-more/australian-horticulture-statistics-
handbook/
Gustavsson, J., Cederberg, C., Sonesson, U. (2011). Global Food Losses and Food Waste. Rome, Food and
Agricultural Organisation of the United Nations.
Ishangulyyev, R., Kim, S., Lee, S.H. (2019). Understanding Food Loss and Waste – Why Are We Losing and
Wasting Food? Foods, 8, 297.
Laurentiis, V.D., Carrado, S., Sala, S. (2018). Quantifying household waste of fresh fruit and vegetables in the
European Union. Waste Management, 77, pp 238–251.
Malcom, B., Griffith, G., Mounter, S., Fleming, E. (2017). Chain Failure Theory as a Framework for Evaluating
Horizontal and Vertical Strategic Alliances among Food Value Chain Participants: A Red Meat Industry
Perspective. Australian Farm Business Management Journal, 14, Paper 4, pp 47-62.
Mason, L., Boyle, T., Fyfe, J., Smith, T., Cordell, D. (2011). National Food Waste Data Assessment: Final Report.
Prepared for the Department of Sustainability, Environment, Water, Population and Communities. Sydney,
Institute for Sustainable Futures, University of Technology, Sydney.
Minor, T., Hitaj, C., Kuchler, F., Skorbiansky, S.R., Roe, B., Thornsbury, S. (2019). Exploring Food Loss from
Farm-to-Retail in the Produce Industry. Choices, 34 (1), pp 1 – 7.
NSW Government (2009). Food Waste Avoidance Benchmark Study 2009: At a glance. Department of
Environment, Climate Change and Water, Sydney.
Phelan, A., Dawes, L., Costanza, R., Kubiszewski, I. (2017). Evaluation of social externalities in regional
communities affected by coal seam gas projects: A case study from Southeast Queensland. Ecological
Economics, 131, pp 300-311.
151
DOI: http://dx.doi.org/10.18461/pfsd.2020.2012Griffith et al. / Proceedings in System Dynamics and Innovation in Food Networks 2020, 134-152
Pretty, J.N., Ball, A.S., Lang, T., Morison, J.I.L. (2005). Farm costs and food miles: An assessment of the full cost
of the UK weekly food basket. Food Policy, 30, pp 1-19.
RMIT University (2016). Watch My Waste, Interim Data. Viewed April 2, 2019. Accessed at:
http://watchmywaste.com.au/
Spencer, S., Kneebone, M. (2012), FOODmap: An analysis of the Australian food supply chain. Canberra,
Department of Agriculture, Fisheries and Forestry. Accessed at:
http://www.agriculture.gov.au/SiteCollectionDocuments/ag-food/food/national-food-plan/submissions-
received/foodmap-an-analysis-of-the-australian-food-supply-chain-30-july.pdf
Thyberg, K.L., Tonjes, D.J. (2015). Drivers of food waste and their implications for sustainable policy
development. Resources, Conservation and Recycling, 106, pp 110-123.
Waste and Resources Action Programme (WRAP) (2013). Overview of Waste in the UK Hospitality and Food
Service Sector. Viewed April 2, 2019. Accessed at: http://www.wrap.org.uk/content/overview-waste-
hospitality-and-food-service-sector
152
DOI: http://dx.doi.org/10.18461/pfsd.2020.2012You can also read