In search of the most reproducible neural vulnerability factors that predict future weight gain: analyses of data from six prospective studies
←
→
Page content transcription
If your browser does not render page correctly, please read the page content below
Social Cognitive and Affective Neuroscience, 2021, 1–9
doi: 10.1093/scan/nsab013
Advance Access Publication Date: 30 January 2021
Original Manuscript
In search of the most reproducible neural vulnerability
Downloaded from https://academic.oup.com/scan/advance-article/doi/10.1093/scan/nsab013/6124130 by guest on 05 May 2021
factors that predict future weight gain: analyses of
data from six prospective studies
Sonja Yokum,1 Ashley N. Gearhardt,2 and Eric Stice3
1
Oregon Research Institute, Eugene, OR 97403, USA, 2 Department of Psychology, University of Michigan, Ann
Arbor, MI 48109, USA, and 3 Department of Psychiatry, Stanford University, Stanford, CA 94305, USA
Correspondence should be addressed to Sonja Yokum, Oregon Research Institute, 1776 Millrace, Eugene, OR 97403, USA. E-mail: sonjas@ori.org.
Abstract
We tested if we could replicate the main effect relations of elevated striatum and lateral orbitofrontal cortex (OFC) response
to high-calorie food stimuli to weight gain reported in past papers in six prospective datasets that used similar functional
MRI (fMRI) paradigms. Participants in Study 1 (N = 37; M (mean) age = 15.5), Study 2 (N = 160; M age = 15.3), Study 3 (N = 130;
M age = 15.0), Study 4 (N = 175; M age = 14.3), Study 5 (N = 45; M age = 20.8) and Study 6 (N = 49; M age = 31.1) completed fMRI
scans at the baseline and had their body mass index (BMI) and body fat (Studies 4 and 6 only) measured at the baseline and
over follow-ups. Elevated striatal response to palatable food images predicted BMI gain in Studies 1 and 6 and body fat gain
in Study 6. Lateral OFC activation did not predict weight gain in any of the six studies. The result provide limited support
for the hypothesis that elevated reward region responsivity to palatable food images predicts weight gain. Factors that make
replication difficult are discussed and potential solutions considered.
Key words: striatum; OFC; prospective; weight gain; cross-replication
Several studies have tested the hypothesis that individuals who impending receipt of tastes of high-calorie chocolate milkshake
show elevated reward region responsivity to high-calorie food predicted weight gain in adolescents; this effect replicated in
cues and images are at elevated risk for future weight gain, split-halves of the sample (Stice et al., 2015). It is reassuring that
which is a cornerstone to the dynamic vulnerability model two of these studies found peaks in the striatum and two found
of obesity (Stice and Yokum, 2016). Greater responsivity of peaks in the lateral OFC, which are two regions that are involved
the lateral orbitofrontal cortex (OFC) to cues that predict the in reward valuation. However, two other studies did not produce
impending presentation of the images of high-calorie foods evidence that elevated responsivity of these regions or other
predicted weight gain in adolescents (Yokum et al., 2011). Ele- reward valuation regions to high-calorie food cues or images
vated responsivity in the nucleus accumbens (NAcc) to high- showed main effect relations to weight gain in adolescents (Stice
calorie food images predicted weight gain in adults (Demos et al., et al., 2010; Stice and Yokum, 2018). Thus, published studies
2012). Greater caudate response to commercials for high-calorie provide somewhat mixed support for the hypothesis that ele-
foods predicted weight gain in adolescents (Yokum et al., 2014). vated reward region responsivity to high-calorie food cues and
Further, elevated lateral OFC response to cues that signal images predicts future weight gain. Some of the inconsistencies
Received: 2 December 2019; Revised: 4 January 2021; Accepted: 29 January 2021
© The Author(s) 2021. Published by Oxford University Press.
This is an Open Access article distributed under the terms of the Creative Commons Attribution-NonCommercial License (http://creativecommons.org/
licenses/by-nc/4.0/), which permits non-commercial re-use, distribution, and reproduction in any medium, provided the original work is properly cited.
For commercial re-use, please contact journals.permissions@oup.com
1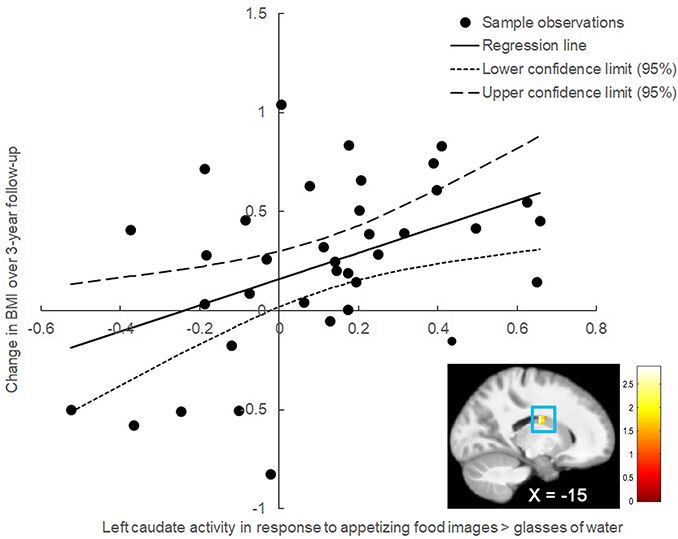
2 | Social Cognitive and Affective Neuroscience, 2021, Vol. 00, No. 00

regarding neural vulnerability factors that predict weight gain         11.5% African-American and 71.6% European-American). In a
may have resulted because the studies used different functional         previous publication (Stice and Yokum, 2018), we provide more
MRI (fMRI) paradigms and examined samples that varied in age            details on the study and discuss main effects of left NAcc and
and weight range. However, it would have been more reassuring           left caudate response to palatable food images and taste of four
if the findings showed greater convergence. Further, the small          different milkshakes on BMI gain.
sample sizes used in many of these studies likely contributed
to the mixed findings because this increases the risk for both
false-positive and false-negative findings.
                                                                        Study 4. Participants were 193 adolescents recruited from
                                                                        Southeast Michigan. In total, 186 adolescents completed the
    Given the limited evidence of reproducibility regarding neu-
                                                                        fMRI scan. Nine participants showed excessive movement dur-
ral vulnerability factors that predict weight gain, we thought
                                                                        ing the scan, and fMRI data of two participants were collected

                                                                                                                                             Downloaded from https://academic.oup.com/scan/advance-article/doi/10.1093/scan/nsab013/6124130 by guest on 05 May 2021
it prudent to conduct a cross-replication study with multiple
                                                                        with an acquisition error. These participants were excluded
datasets to determine whether the results reproduce. Specifi-
                                                                        from the analyses. This yielded 175 participants (90 females;
cally, we tested whether we could replicate previous findings
                                                                        M age = 14.3 ± 1.0; M baseline BMI = 24.1 ± 5.4; 9.1% Hispanic-
showing that elevated reward region responsivity to high-calorie
                                                                        American, 1.7% American Indian/Alaska Native, 1.1% Asian-
food cues and images predicts weight gain (Demos et al., 2012;
                                                                        American, 13.1% African-American, 61.3% European-American,
Stice et al., 2015; Yokum et al., 2011, 2014) in six datasets, using
                                                                        0.6% other, 8.0% mixed and 5.1% unknown) for neural analyses.
a priori small volume correction (SVC) analysis within the stria-
                                                                        See Gearhardt and colleagues (Gearhardt et al., 2020) for more
tum and lateral OFC. We focused on new datasets that used sim-
                                                                        details on the sample and measures.
ilar fMRI paradigms to those used in past studies, which include
exposure to high-calorie food images (Demos et al., 2012), high-
calorie fast-food commercials (Yokum et al., 2014) and cues sig-        Study 5. Participants were 48 overweight and obese young adult
naling impending delivery of a palatable high-calorie food taste        women drawn from a prospective study in Eugene, Oregon.
(Stice et al., 2015). We evaluated the reproducibility of these rela-   Three participants showed excessive head movement during the
tions. Further, to increase the sensitivity to detect small effects,    scan and were therefore excluded from the analyses, result-
we combined data across studies that used similar paradigms             ing in a final sample of 45 participants (M age = 20.8 ± 1.3;
to examine the effects of brain reward response on weight gain          M BMI = 28.4 ± 2.9; 2.2% Hispanic-American, 4.4% American
across samples.                                                         Indian/Alaska Native, 8.9% Asian-American, 75.6% European-
                                                                        American, 8.9% mixed racial heritage). See Yokum and col-
                                                                        leagues (2015) for more details on the sample and measures.
Subjects and methods
Participants
                                                                        Study 6. Participants were 53 overweight/obese adults recruited
Study 1. Participants were 44 adolescent girls recruited from           from Eugene, Oregon and drawn from a larger ongoing study
Eugene, Oregon. Data from seven participants were excluded              evaluating the efficacy of a multifaceted food response and
due to excessive head movement during the scan (i.e. within-            attention training intervention on weight and body fat loss. At
run movement exceeded 2 mm in translational movement and                the time of data analyses, 49 participants had completed the
2◦ in rotational movement), resulting in a final sample of 37           fMRI scan and 6-month follow-up data (M age = 31.0 ± 7.3; M
participants [M age = 15.5 ± 1.0; M baseline body mass index            BMI = 30.7 ± 3.7; 75.5% female; 17.0% Hispanic-American, 2.0%
(BMI) = 24.2 ± 5.0; 5.6% American Indian/Alaska Native, 2.9%            American Indian/Alaska Native, 4.1% Asian-American, 2.0%
African-American, 82.9% European-American and 8.6% mixed                African-American, 60.6% European-American and 14.3% mixed
racial heritage]. More detailed descriptions of the sample and          racial heritage). All participants’ data met the movement inclu-
measures are discussed in a previous publication (Stice et al.,         sion criteria (see Study 1 criteria).
2010).                                                                      In Studies 1–4, participants provided assent and parents pro-
                                                                        vided written informed consent. In Studies 5–6, participants
                                                                        provided written informed consent. The University of Michi-
Study 2. Participants were 162 lean adolescents recruited from          gan Institutional Review Board approved Study 4. The Oregon
Eugene, Oregon. fMRI data of two participants were collected            Research Institute Institutional Review Board approved all other
with an acquisition error. These participants were excluded             studies.
from the analyses, resulting in a final sample of 160 partici-              In Study 4, exclusion criteria were a BMI percentile of
S. Yokum et al. | 3
and coats. See Table 2 for BMI data points per study. BMI fMRI data analysis. Detailed descriptions of the fMRI data
correlates with direct measures of total body fat such as acquisition and data preprocessing are provided in Supple-
dual energy X-ray absorptiometry (r = 0.80 to 0.90) and with mentary Material. Neuroimaging data were preprocessed and
health measures including blood pressure, adverse lipopro- analyzed using SPM12 (Wellcome Department of Cognitive Neu-
tein profiles, atherosclerotic lesions, serum insulin levels rology; http://www.fil.ion.ucl.ac.uk/spm). At the subject level,
and diabetes mellitus (Dietz and Robinson, 1998; Steinberger blood oxygen level-dependent (BOLD) signal signal was mod-
et al., 2006). eled in a fixed effects analysis with separate regressors modeling
each condition of interest during the picture, cue and commer-
Percentage body fat. In Studies 4 and 6, we collected percent cial presentation period (Table 1). In Studies 1 and 3, to identify
body fat (see Table 2). Body fat percentage was estimated with brain regions activated by appetizing food images in the food
Downloaded from https://academic.oup.com/scan/advance-article/doi/10.1093/scan/nsab013/6124130 by guest on 05 May 2021
bioelectric impedance (InBody Body Composition scale) in Study picture paradigm, we contrasted BOLD signal during appetiz-
4 and with air displacement plethysmography (BodPod) in Study ing food images vs unappetizing food images and vs glasses of
6. Both measures show test–retest reliability (r = 0.92–0.99) and water. In Study 6, we contrasted activations during appetizing
correlate with dual X-ray absorptiometry and hydrostatic weigh- high-calorie food images vs appetizing low-calorie food images
ing estimates (r = 0.91–0.99; Fields et al., 2002; Von Hurst et al., and vs glasses of water. To identify brain regions activated by
2016). unhealthy fast-food commercials (Study 4), we contrasted BOLD
signal during unhealthy fast-food commercials vs healthier fast-
food commercials and vs phone commercials. Activation in
fMRI paradigms response to the cue signaling impending receipt of the milk-
In Studies 1 and 3, participants completed a food picture shake in the food receipt paradigms (Studies 1, 2, 3 and 5) was
paradigm and a food receipt paradigm. In Study 4, participants assessed by contrasting BOLD signal during milkshake cue vs
completed a food commercial paradigm. Participants in Stud- tasteless solution cue. In Study 3, all milkshake variants were
ies 2 and 5 completed a food receipt paradigm. Participants preceded by the same image of a milkshake to not confound
in Study 6 completed a food picture paradigm. In Studies 2–4 the neural response to receipt with expectations (Stice and
and Study 6, we collected hunger ratings prior to the scan. See Yokum, 2018). We collapsed BOLD response across cues for all
Table 1 and Supplementary Material for more details on the fMRI four milkshakes. The contrast assessing BOLD response to milk-
paradigms and hunger ratings. The main effects of the food shake taste (i.e. milkshake receipt > tasteless solution receipt)
picture paradigms and food receipt paradigms in Studies 1, 2, was excluded from the food receipt paradigm analyses. All data
5 and 6 are reported in Supplementary Material (Supplemen- were high-pass filtered at 128 s and first-order autoregressive
tary results and Supplementary Tables S1–S5). Main effects of (AR[1]) error was used to correct for serial autocorrelations.
the food picture paradigm and food receipt paradigm in Study 3 The individual SPM contrasts were entered into second-level
(Stice et al., 2013; Stice and Yokum, 2018) and of the food com- regression models with BMI slopes and intercepts as covariates.
mercial paradigm in Study 4 (Gearhardt et al., 2020) are reported Hunger prior to the scan was included as a covariate of no inter-
in previous publications. est in the models for Studies 2–4, and 6. In Studies 5 and 6,
we also included intervention (0 = no, 1 = yes) as a covariate of
no interest as participants in these studies were randomized to
Analysis
either a weight loss intervention (Study 5 n = 24; Study 6 n = 17)
Change in BMI and body fat percentage. In Study 4, change in or a control condition (Study 5 n = 21; Study 6 n = 32). In Stud-
BMI and change in body fat percentage were assessed by cal- ies 4 and 6, we used similar regression models to test if BOLD
culating the difference between baseline and 1-year follow-up response to unhealthy fast-food commercials and appetizing
BMI and body fat percentage, respectively. In all other studies, high-calorie food pictures predicted body fat gain.
change in BMI and body fat were estimated with mixed effects We performed SVC analyses within the left NAcc (Montreal
growth models using SAS PROC MIXED (Version 9.3). The models Neurological Institute [MNI] coordinates: x = −9, y = 6, z = −4;
specified fixed and random effects Demos et al., 2012), left caudate (MNI coordinates x = −12, y = −7,
z = 22; Yokum et al., 2014) and right lateral OFC (MNI coordinates
x = 36, y = 27, z = −15; Stice et al., 2015) with activation peaks as
Yij = β0i + β1i Timeij + rij ,
centroids to define 6-mm diameter spheres. Peaks were consid-
ered significant at P-values < 0.05, familywise error rate (PFWE)
β0i = γ00 + µ0i , corrected across the small volume. Exploratory analyses tested
for relations of BOLD activation within the anatomical regions
β1i = γ10 + µ1i , of interest (ROIs) (i.e. bilateral NAcc, bilateral caudate and bilat-
eral lateral OFC) to BMI gain and body fat gain to examine if there
were any other significant effects within these brain regions. We
Yij is the BMI or body fat score if the ith person at the jth used mask images for the caudate and lateral OFC from the WFU
time, β 0i is the intercept (defined at the baseline assessment) Pickatlas (Maldjian et al., 2003). Due to the lack of a NAcc mask in
for the ith person, β 1i is the slope for the ith person and rij is the the WFU Pickatlas, we used the NAcc mask from the Pauli atlas
residual variance for the ith person at the jth time. The intercept (Pauli et al., 2018). Peaks were considered significant at a peak
has a mean fixed effect for each person, γ 00 , and person-specific level of P < 0.05 FWE corrected across the total number of vox-
deviation around the mean intercept, µ0i . Similarly, the slope els across the ROI. We also conducted exploratory whole brain
has a mean fixed effect for each person, γ 10 , and person-specific analyses to test for significant relations of brain activation out-
deviation around the mean slope, µ1i . side of our a priori hypothesized ROIs to BMI gain/body fat gain
These latter analyses offer a sensitive technique for model- (see Supplementary Material for methods and results).
ing change in continuous variables and use maximum likelihood Power to detect a medium effect size (r = 0.30) in each of the
estimation to accommodate missing data (Singer, 1998). datasets was 0.45 in Study 1, 0.97 in Study 2, 0.92 in Study 3, 0.974 | Social Cognitive and Affective Neuroscience, 2021, Vol. 00, No. 00
Table 1. Overview of samples, fMRI tasks, time of day of scans, fasting and contrasts
Study Sample fMRI task Time of day Last time Contrasts
scans eaten
Study 1 (Stice 37 adolescents Food picture Between 11 am 4–6 h prior Appetizing food
et al., 2010) (females only) and 6 pm to scan images > unappetizing
food images.
Appetizing food
images > glasses of
water
Downloaded from https://academic.oup.com/scan/advance-article/doi/10.1093/scan/nsab013/6124130 by guest on 05 May 2021
Food receipt Between 11 am 4–6 h prior Milkshake
and 6 pm to scan cue > tasteless solution
cue
Study 2 (Stice 160 adolescents Food receipt Between 11 am 4–6 h prior Milkshake glass > water
et al., 2015) (male and and 6 pm to scan glass
female)
Study 3 (Stice 130 adolescents Food picture Between 1 pm 4 h prior to Appetizing food
and Yokum, (male and and 6 pm the scan images > unappetizing
2018) female) food images.
Appetizing food
images > glasses of
water
Food receipt Milkshake
cue > tasteless solution
cue
Study 4 175 adolescents Food commer- Between 10:30 1–4 h prior Unhealthy fast-
(Gearhardt (male and cials am and 6 pm to scan food commer-
et al., 2020) female) cials > healthier
fast-food commercials;
unhealthy fast-food
commercials > phone
commercials; healthier
fast-food com-
mercials > phone
commercials
Study 5 (Yokum 45 young adults Food receipt Between 10 am 4–6 h prior Milkshake glass > water
et al., 2015) (females only) and 6 pm to scan glass
Study 6 49 adults (34 Food picture Between 9 am 3–4 h prior Appetizing high-calorie
females) and 5 pm to scan food > appetizing
low-calorie food.
Appetizing high-
calorie food > glasses
of water
in Study 4, 0.54 in Study 5 and 0.55 in Study 6. Power to detect BMI gain. Statistical analyses were performed using the Statis-
a small effect size (r = 0.10) was 0.08 in Study 1, 0.24 in Study 2, tical Package for the Social Sciences 24 (SPSS software package
0.20 in Study 3, 0.26 in Study 4, 0.09 in Study 5 and 0.10 in Study 6. (SPSS 24, SPSS Inc., Chicago, IL, USA). Due to the difference in
Because three studies (Studies 1, 5 and 6) had sample sizes that fMRI paradigms, analyses were conducted separately for stud-
were not large enough to detect a medium effect (r = 0.30), we ies including the food receipt paradigm (Studies 1–3 and 5:
decided not to use additional Bonferroni corrections to correct N = 363) and those including the food picture paradigm (Studies
for the number of brain regions and contrasts to avoid the pos- 1, 3 and 6: N = 216). Given that the food commercial paradigm
sibility that it leads us to overlook real effects in the form of Type in Study 4 differed from the other two paradigms (e.g. video
II errors (Lieberman and Cunningham, 2009). For all outcomes, clips vs static images), we excluded this study from the anal-
we estimated effect sizes (r) based on the reported Z-values and yses. For the food receipt and the food picture paradigms, we
sample size using a formula from Rosenthal (1991). extracted the main effect parameter estimates at the individual
level in the left NAcc, left caudate and right lateral OFC using
MarsBar (http://www.marsbar. sourceforge.net). The parameter
Post hoc analyses. We ran post-hoc exploratory regression anal- estimates were exported to SPSS. For the food picture paradigm
yses using data from multiple studies to increase sensitivity to analyses, we only included data from the contrast appetizing
detect small effects of brain response in our a priori ROIs on (high-calorie) food images > glasses of water because this wasS. Yokum et al. | 5
Table 2. Overview of the average baseline BMI and average change in BMI over follow-up per Study. In Study 4, change in BMI and change in
body fat were assessed by calculating the difference between baseline and 1-year follow-up BMI and body fat percentage, respectively. In all
other studies, data from baseline and all follow-ups were used in random intercept, mixed effects growth curve analyses (SAS Inc. version 9.3)
to model BMI change and body fat change
Study M baseline BMI (s.d.) M BMI gain (s.d.) Measurements
Study 1 24.46 (5.42) 0.23 (0.43) Baseline, 1 year, 2 years and 3 years
Study 2 20.81 (1.93) 0.51 (0.49) Baseline, 1 year, 2 years and 3 years
Study 3 21.15 (2.25) 0.46 (0.45) Baseline, 1 year, 2 years and 3 years
Study 4 24.10 (5.35) 0.45 (1.49) Baseline and 1 year
Downloaded from https://academic.oup.com/scan/advance-article/doi/10.1093/scan/nsab013/6124130 by guest on 05 May 2021
Study 5 28.20 (2.85) −0.14 (0.30) Baseline, 3 months, 6 months, 1 year and 2 years
Study 6 30.59 (3.87) 0.01 (0.78) Baseline, 1 month, 3 months and 6 months
the only contrast that was similar across the three studies. BMI
change over follow-up was the dependent variable. Indepen-
dent variables included baseline BMI, sex, age, study (dummy
coded), parameter estimates from the left NAcc, left caudate
and right lateral OFC. Further, we examined whether study
(dummy coded) moderated the effects of neural response on BMI
gain. Prior to these latter analyses, we centered the parame-
ter estimates within the left NAcc, left caudate and right lateral
OFC on their mean to maximize interpretability and minimize
multicollinearity (Aiken and West, 1991). To adjust for multi-
ple comparisons, the level of significance was set to P < 0.013.
Power to detect small effects (r = 0.10) across datasets was 0.47
for the food receipt paradigm dataset (N = 363) and 0.31 for the
food image paradigm dataset (N = 216). Power to detect medium
effects (r = 0.30) was 0.99 for both datasets.
Results
Fig. 1. In Study 1, BOLD activity in the left caudate (MNI coordinates = −15, −10,
Descriptive statistics 23, Z = 2.69, pFWE = 0.05, r = 0.44; 95% CI: 0.13, 0.67) in response to the con-
trast appetizing food images > glasses of water predicted BMI gain over a 3-year
Table 2 presents the average change in BMI over follow-up per follow-up.
study. In Study 4, the average change in body fat percentage
from baseline to 1-year follow-up was M = −0.80 ± 3.50, suggest-
ing that there was significant variation in change in body fat Exploratory analyses tested for effects of BOLD activation
percentage. In Study 6, the average change in body fat percent- within the anatomical ROIs (i.e. bilateral caudate, bilateral NACC
age over 6-month follow-up was M = −0.24 ± 1.70. There were no and bilateral lateral OFC) to examine if there were other signifi-
significant differences in BMI change between participants ran- cant effects within these brain regions. There were no significant
domized to the weight loss intervention and control condition in relations between BOLD activity within the anatomical ROIs and
Study 5 (t(43) = −1.97, P = 0.06) and Study 6 (t(67) = 0.35, P = 0.73). BMI gain.
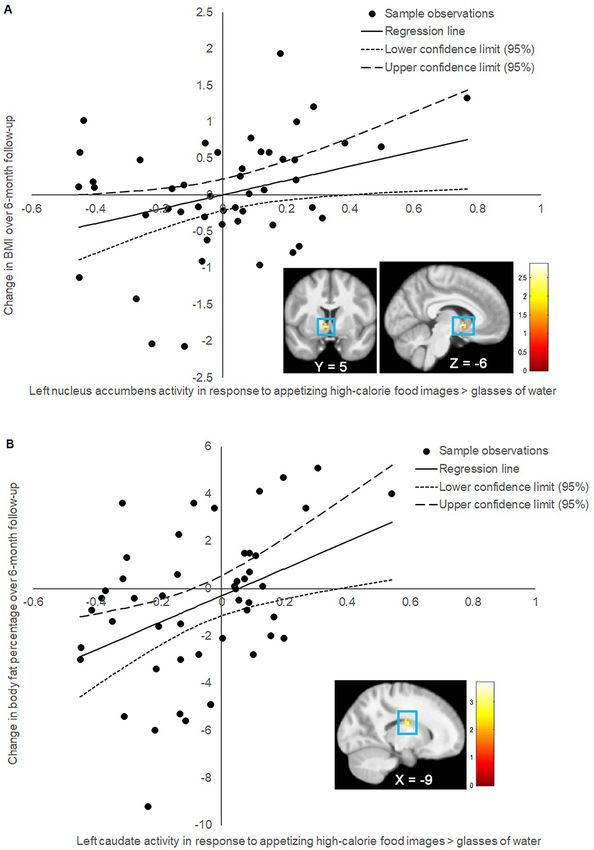
Relation of neural responsivity to body fat change over
Relations of BOLD activity to food images, fast-food follow-up
commercials and food cues to BMI gain over follow-up In Study 6, elevated BOLD activation in the left caudate (MNI
SVC analyses testing for relations between BOLD activity and coordinates: −9, −4, 20, Z = 3.43, pFWE = 0.008, r = 0.49, 95% CI:
BMI gain using the threshold of pFWE ≤0.05 revealed two effects. 0.24, 0.68) in response to the contrast appetizing high-calorie
In Study 1, BOLD activation in the left caudate [MNI coordi- food images > glasses of water predicted body fat gain over 6-
nates = −15, −10, 23, Z = 2.69, pFWE = 0.05, r = 0.44, 95% confi- month follow-up (Figure 2B). In Study 4, there were no significant
dence interval (95% CI): 0.13, 0.67] in response to the contrast effects of BOLD activity in the NAcc (M r = 0.09), caudate (M
appetizing food images > glasses of water predicted BMI gain r = 0.02) and OFC (M r = −0.01) on change in body fat over 1-year
over a 3-year follow-up (Figure 1). In Study 6, BOLD activation in follow-up (see Supplementary Table S6). There were no signifi-
the left NAcc (MNI coordinates: −6, 5, −4, Z = 2.73, pFWE = 0.05, cant correlations between BOLD activity within the anatomical
r = 0.39, 95% CI: 0.12, 0.60) in response to the contrast appetizing ROIs and body fat gain.
high-calorie food images > glasses of water predicted BMI gain
over 6-month follow-up (Figure 2A). In Studies 2–5, there were
Post hoc tests of the effects of BOLD response to food
no significant effects of neural activity in these regions on BMI
images and cues on BMI gain across datasets
gain (left NAcc M r = 0.05, left caudate M r = 0.05, right lateral
OFC M r = 0.01; see Supplementary results and Supplementary Although there was a trend-level effect of left caudate (par-
Table S6). tial r = 0.14, P = 0.05) response to the contrast appetizing food6 | Social Cognitive and Affective Neuroscience, 2021, Vol. 00, No. 00
Downloaded from https://academic.oup.com/scan/advance-article/doi/10.1093/scan/nsab013/6124130 by guest on 05 May 2021
Fig. 2. In Study 5, BOLD activity in (A) the left nucleus accumbens (MNI coordinates: −6, 5, −4, Z = 2.73, pFWE = 0.05, r = 0.39; 95% CI: 0.12, 0.60) and (B) the left
caudate (MNI coordinates: −9, −4, 20, Z = 3.43, pFWE = 0.008, r = 0.49; 95% CI: 0.24, 0.68) in response to the contrast appetizing high-calorie food images > glasses of
water predicted BMI gain and body fat gain over 6-month follow-up, respectively.
images > glasses of water on BMI gain across the datasets of water on BMI gain: the positive main effects of neu-
(N = 216) (Table 3), this effect did not survive adjustment for mul- ral response in these two regions on BMI gain were signifi-
tiple comparisons (P < 0.013). There were no significant effects cantly stronger in Study 6 compared to the other two studies
of left NAcc (partial r = 0.13, P = 0.07) and right lateral OFC (Studies 1 and 3).
(partial r = −0.06, P = 0.39) response to the contrast appetiz- There were no significant main effects of left NAcc (par-
ing food images > glasses of water on BMI gain (Table 3). Study tial r = −0.02, P = 0.76), left caudate (partial r = −0.01, P = 0.91)
6 significantly moderated the effects of left NAcc (partial and right lateral OFC (partial r = 0.02, P = 0.73) response to the
r = 0.20, P = 0.005) and right lateral OFC (partial r = 0.18, P = 0.01) contrast milkshake cue > tasteless solution cue (N = 363) on BMI
response to the contrast appetizing food images > glasses gain (Table 3). Study did not moderate the effects of neuralS. Yokum et al. | 7
Table 3. Main effects of the left NAcc, left caudate and right lateral OFC in response to the food receipt paradigm and food image paradigm on
increases in BMI over follow-up across datasets, while controlling for baseline BMI, sex, age and study
Variable Standardized B SE t-value P-value Partial r
Food receipt paradigm (N = 363): milkshake cue ≥ tasteless solution cue
Left NAcc −0.02 0.01 −0.29 0.77 −0.02
Left caudate −0.01 0.02 −0.13 0.89 −0.01
Right lateral OFC 0.02 0.01 0.40 0.69 0.02
Food image paradigm (N = 216): appetizing (high calorie) food images > glass of water
Downloaded from https://academic.oup.com/scan/advance-article/doi/10.1093/scan/nsab013/6124130 by guest on 05 May 2021
Left NAcc 0.13 0.19 1.84 0.07 0.13
Left caudate 0.14 0.22 1.97 0.05 0.14
Right lateral OFC −0.06 0.20 −0.86 0.39 −0.06
activity in these regions in response to the contrast milkshake detect significant effects in all six samples because of the multi-
cue > tasteless solution cue on BMI gain. plicative nature of power across studies. Specifically, our power
to detect a medium effect was 0.45 in Study 1, 0.97 in Study
2, 0.92 in Study 3, 0.97 in Study 4, 0.54 in Study 5 and 0.55 in
Discussion Study 6. This means that we only had a probability of 0.12 for
Our goal was to investigate whether elevated reward-related detecting medium effects in all six samples (0.45 × 0.97 × 0.92 ×
neural responsivity to palatable food images and cues pre- 0.97 × 0.54 × 0.55 = 0.12). This suggests that it may be unrealistic
dicts weight gain in six prospective datasets. We also per- to detect the same effect in all six datasets given the compound
formed exploratory analyses to examine effects of brain reward nature of power across samples. Indeed, even with the 0.80 rec-
response on weight gain across datasets. We found that elevated ommended power, the probability of actually detecting effects in
BOLD activity in the left caudate in response to appetizing food six datasets would only be 0.26 (0.80 × 0.80 × 0.80 × 0.80 × 0.80 ×
images (relative to glasses of water) predicted BMI gain in Study 0.80 = 0.26). These analyses suggest that cross-replication stud-
1. Elevated BOLD activity in the left striatum (caudate, NAcc) ies with large enough samples (e.g. six studies with 0.97 power)
in response to appetizing high-calorie food images (relative to are needed to replicate findings.
glasses of water) predicted both BMI gain and percent body fat One interesting pattern in the findings is that we found some
gain in Study 6. We found a trend-level effect of elevated left cau- support for striatal effects on weight gain in two samples and
date response to appetizing food images (relative to glasses of across three samples; however, we did not find significant rela-
water) on BMI gain across datasets. The effect sizes in Studies 1 tions between lateral OFC activation and weight gain in even one
and 6 are comparable with those found in Demos and colleagues sample. This pattern suggests that elevated striatal responsivity
(Demos et al., 2012; r = 0.37) but lower than those found in Yokum to food images is a more reproducible predictor of future weight
and colleagues (Yokum et al., 2014; r = 0.57). gain than lateral OFC responsivity to food images or cues. These
The pattern of findings might be interpreted as suggest- findings converge with evidence that elevated striatal respon-
ing that findings from fMRI studies show low reproducibility, sivity to monetary reward, but not elevated OFC responsivity to
in that we only observed a significant effect in two of the six monetary reward, predicted onset of substance use over 1-year
datasets and a trend-level effect across three datasets (N = 216). follow-up (Stice et al., 2013). However, it is important to acknowl-
Much greater confidence could be placed in the hypothesis that edge that differences in the paradigms used across studies
individuals who show elevated reward region response to high- might have contributed to the inconsistent findings regarding
calorie food images or cues are at elevated risk for future weight OFC activity as the predictor of weight gain. Indeed, the main
gain had we observed similar effects in each of the six datasets effects (Supplementary Tables S1–S5) suggest that there is little
or a significant effect across datasets. It could be argued that overlap in BOLD activity in response to the different paradigms
the inconsistent pattern of findings is a function of the fact that across the studies. Future studies should evaluate how spe-
studies differed with regard to sample composition regarding cific design parameters elicit different neural responses to food
age and weight, fMRI paradigms, length of follow-up and sta- stimuli.
tistical power. For instance, both studies in which we found The pattern of findings reported herein is concerning
predictive effects (Study 1 and Study 6) included overweight because it is certainly possible to observe much greater repro-
and obese individuals. These results suggest that a history of ducibility of scientific findings. For instance, the effects of a
overeating is necessary to establish a relation between brain dissonance-based eating disorder prevention program on the
reward response to palatable food images on weight gain, con- five core outcomes have replicated in 88% of the tests in the 22
sistent with the dynamic vulnerability model of obesity (Stice randomized controlled trials conducted by several independent
and Yokum, 2016). However, we did not find significant effects research teams (Stice et al., 2017). This is in contrast to the 3%
of brain reward response to unhealthy fast-food commercials of the effects reported in the published studies that replicated
or to cues predicting impending palatable food delivery in two in the analyses conducted with the six datasets reported herein.
other studies with overweight and obese individuals, including These 22 prevention trials likewise varied in a number of fac-
one study that had a power of 0.97 to detect a medium effect size tors like the fMRI studies, such as the nature of the samples
(Study 4). (e.g. adolescent vs adult participants and healthy weight vs over-
It is also important to consider the power to detect a medium weight participants), nature of the experimental design (e.g. the
effect in each of the studies because it may be unrealistic to types of facilitators who implemented the prevention program8 | Social Cognitive and Affective Neuroscience, 2021, Vol. 00, No. 00
and the nature of the comparison conditions), sample size Supplementary data
and statistical power. Although it is tempting to attribute non-
Supplementary data are available at SCAN online.
replication to variation in such design features, it would be far
more reassuring if studies addressing the same general research
question generated effects that reproduce in multiple studies References
conducted by independent teams.
The current research has important strengths, including the Aiken, L.S., West, S.G. (1991). Multiple Regression: Testing and
examination of six different prospective datasets, objectively Interpreting Interactions. Newbury Park, CA: Sage.
measured weight and body fat, long follow-ups and datasets Byrne, J.E.M., Hughes, M.E., Rossell, S.L., Johnson, S.L., Murray, G.
that varied in age, sex and BMI. However, there are also key (2017). Time of day differences in neural reward function-
ing in healthy young men. The Journal of Neuroscience, 37(37),
Downloaded from https://academic.oup.com/scan/advance-article/doi/10.1093/scan/nsab013/6124130 by guest on 05 May 2021
limitations. First, three of the six studies used small samples,
which increase the risk for false positives (Smeets et al., 2019). 8895–900.
Because significant effects emerged in two of the smaller studies Charbonnier, L., van Meer, F., Johnstone, A.M., Crabtree, D.,
and because we did not correct for multiple comparisons across Buosi, W., Smeets, P.A.M. (2018). Effects of hunger state on the
regions and contrasts, it is possible that these results are false- brain responses to food cues across the life span. NeuroImage,
positive findings. Indeed, the total number of significant SVC 171, 246–55.
effects (i.e. 3) is equal to the expected number of false positives Demos, K.E., Heatherton, T.F., Kelley, W.M. (2012). Individual
(60 SVC tests × 0.05 = 3). However, we did find a trend-level effect differences in nucleus accumbens activity to food and sex-
of caudate response to palatable food images in data across ual images predict weight gain and sexual behavior. Journal of
three samples (N = 216), suggesting that the caudate finding is Neuroscience, 32(16), 5549–52.
a moderately reliable effect. Future studies with large enough Fields, D.A., Goran, M.I., McCrory, M.A. (2002). Body-composition
samples are needed to attempt to replicate the present find- assessment via air-displacement plethysmography in adults
ings. Second, the studies differed in data collection approaches and children: a review. The American Journal of Clinical Nutrition,
(e.g. time of day of the scan, hours of fasting and MRI scan- 75(3), 453–67.
ners),the duration of follow-up, the time between follow-ups Gearhardt, A.N., Yokum, S., Harris, J.L., Epstein, L.H.,
and the change in BMI and body fat, which may have contributed Lumeng, J.C. (2020). Neural response to fast food commercials
to the lack of reproducibility across samples. For example, time in adolescents predicts intake. The American Journal of Clinical
of day of the scans (Byrne et al., 2017) and hunger (Siep et al., Nutrition, 111(3), 493–502.
2009) has been suggested to affect striatal functioning. Future Hare, T.A., Malmaud, J., Rangel, A. (2011). Focusing attention on
research should address these limitations so that stronger infer- the health aspects of foods changes value signals in vmPFC
ences regarding the relation of reward region responsivity to and improves dietary choice. Journal of Neuroscience, 31(30),
future weight gain are possible. 11077–87.
In conclusion, our neuroimaging results provide only limited Lieberman, M.D., Cunningham, W.A. (2009). Type I and Type II
support for the hypothesis that elevated reward region respon- error concerns in fMRI research: re-balancing the scale. Social
sivity to palatable food images predicts future weight gain. Cognitive and Affective Neuroscience, 4(4), 423–8.
Specifically, there was evidence that elevated striatal response Maldjian, J.A., Laurienti, P.J., Kraft, R.A., Burdette, J.H. (2003). An
to palatable food images predicted weight gain, converging with automated method for neuroanatomic and cytoarchitectonic
the findings of two previous studies (Demos et al., 2012; Yokum atlas-based interrogation of fMRI data sets. NeuroImage, 19(3),
et al., 2014). On the other hand, the striatal effects only emerged 1233–9.
in response to palatable food images and not in response to Noonan, M.P., Kolling, N., Walton, M.E., Rushworth, M.F. (2012).
unhealthy fast-food commercials or to cues predicting impend- Re-evaluating the role of the orbitofrontal cortex in reward
ing palatable food delivery, suggesting that the relation is not and reinforcement. European Journal of Neuroscience, 35(7),
particularly robust. It will be vital to determine how to generate 997–1010.
fMRI findings that are more likely to reproduce in studies con- Pauli, W.M., Nili, A.N., Tyszka, J.M. (2018). A high-resolution
ducted by independent teams, such as by using larger samples, probabilistic in vivo atlas of human subcortical brain nuclei.
more standardized procedures and paradigms with more events. Scientific Data, 5, 180063.
Rosenthal, R. (1991). Meta-analytic Procedures for Social Research.
Newbury Park, CA: Sage.
Acknowledgements Siep, N., Roefs, A., Roebroeck, A., Havermans, R., Bonte, M.L.,
All authors read and approved the final manuscript. The authors Jansen, A. (2009). Hunger is the best spice: an fMRI study of
also thank the Lewis Center for Neuroimaging at the University the effects of attention, hunger, and calorie content on food
of Oregon for their assistance in imaging for this investigation. reward processing in the amygdala and orbitofrontal cortex.
Behavioural Brain Research, 198(1), 149–58.
Singer, J.D. (1998). Using SAS PROC MIXED to fit multi-
Funding level models, hierarchical models, and individual growth
This work was supported by grants from the National Institute models. Journal of Educational and Behavioral Statistics, 23,
on Diabetes and Digestive and Kidney Diseases: R01 DK080760, 323–55.
R01 DK112762, and R01 DK102532. Smeets, P.A.M., Kroese, F.M., Evers, C., de Ridder, D.T.D.
(2013). Allured or alarmed: counteractive control responses to
food temptations in the brain. Behavioural Brain Research, 248,
Conflict of interest
41–5.
The authors report no conflict of interest with respect to the Smeets, P.A.M., Dagher, A., Hare, T.A., Kullmann, S., van
content of this paper. der Laan, L.N., Veldhuizen, M.G. (2019). Good practice inS. Yokum et al. | 9
food-related neuroimaging. The American Journal of Clinical Stice, E., Yokum, S. (2018). Relation of neural response to palat-
Nutrition, 109(3), 491–503. able food tastes and images to future weight gain: using
Stice, E., Yokum, S., Bohon, C., Marti, N., Smolen, A. (2010). bootstrap sampling to examine replicability of neuroimaging
Reward circuitry responsivity to food predicts future increases findings. NeuroImage, 183, 522–31.
in body mass: moderating effects of DRD2 and DRD4. NeuroIm- Tzourio-Mazoyer, N., Landeau, B., Papathanassiou, D., et al.
age, 50, 1618–25. (2002). Automated anatomical labeling of activations in SPM
Stice, E., Yokum, S., Burger, K. (2013). Elevated reward region using a macroscopic anatomical parcellation of the MNI MRI
responsivity predicts future substance use onset but not over- single-subject brain. NeuroImage, 15(1), 273–89.
weight/obesity onset. Biological Psychiatry, 73, 869–76. Von Hurst, P.R., Walsh, D.C.I., Conlon, C.A., Ingram, M.,
Stice, E., Burger, K.S., Yokum, S. (2015). Reward region Kruger, R., Stonehouse, W. (2016). Validity and reliabil-
Downloaded from https://academic.oup.com/scan/advance-article/doi/10.1093/scan/nsab013/6124130 by guest on 05 May 2021
responsivity predicts future weight gain and moderating ity of bioelectrical impedance analysis to estimate body fat
effects of the TaqIA allele. Journal of Neuroscience, 35(28), percentage against air displacement plethysmography and
10316–24. dual-energy X-ray absorptiometry. Nutrition and Dietitics, 73,
Stice, E., Rohde, P., Shaw, H., Gau, J. (2017). Clinician-led, peer- 197–204.
led, and internet-delivered dissonance-based eating disorder Yokum, S., Gearhardt, A., Harris, J., Brownell, K., Stice, E.
prevention programs: acute effectiveness of these delivery (2014). Individual differences in striatum activity to food com-
modalities. Journal of Consulting and Clinical Psychology, 85(9), mercials predicts weight gain in adolescence. Obesity (Silver
883–95. Spring), 22(12), 2544–51.
Stice, E., Yokum, S. (2016). Gain in body fat associated Yokum, S., Marti, C.N., Smolen, A., Stice, E. (2015). Relation of
with increased striatal response to palatable food cues the multilocus genetic composite reflecting high dopamine
whereas body fat stability is associated with decreased striatal signaling capacity to future increases in BMI. Appetite, 87,
response. Journal of Neuroscience, 36(26), 6949–56. 38–45.You can also read