2019 Food & Health Survey - FOODINSIGHT.ORG - Food Insight
←
→
Page content transcription
If your browser does not render page correctly, please read the page content below
2019 Food & Health Survey

                            FOODINSIGHT.ORG
BACKGROUND
The International Food Information Council (IFIC)
Foundation’s 2019 Food and Health Survey marks the
14th time the IFIC Foundation has surveyed American
consumers to understand their perceptions, beliefs
and behaviors around food and food purchasing
decisions.
This year, the survey continues an examination of
issues related to health and diet, food components,
food production and food safety. It also explores new
topics, such as food allergies and plant-based diets.
A supplement to this report, produced in partnership
with the American Institute for Cancer Research and
focused on how cancer-prevention influences food
choices among Gen X consumers, will be released in
Fall 2019.
                                                        2

                                       FOODINSIGHT.ORG
METHODOLOGY
• Online survey of 1,012 Americans ages 18 to 80.
 March 22 to April 9, 2019. The survey took
 approximately 21 minutes to complete.
• The results were weighted to ensure that they
 are reflective of the American population ages
 18 to 80, as seen in the 2018 Current Population
 Survey. Specifically, they were weighted by age,
 education, gender, race/ethnicity and region.
• The survey was conducted by Greenwald &
 Associates, using Dynata’s consumer panel
 (previously known as ResearchNow).
• Note: significant changes in trend vs. 2018 are
 indicated where appropriate with up and down
 arrows.
                                                                  3

                                                    FOODINSIGHT.ORG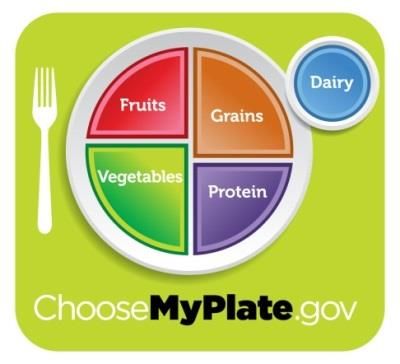
Executive Summary
This year’s 2019 Food and Health Survey seeks to understand         Key Findings
consumers’ perceptions and behaviors around food and food
purchasing decisions.                                               This year, some of the more compelling findings of the Food and
                                                                    Health Survey include:
• The findings from this year’s online survey of 1,012 Americans
  ages 18 to 80 focuses on:                                         • Consumers struggle to know how to recognize
     • Consumer confusion around environmental sustainability         environmentally sustainable sources. While environmental
                                                                      sustainability is the lowest of the purchase drivers discussed in
     • Food and beverage purchase drivers                             the survey, 6 in 10 consumers say it is hard to know whether the
     • Plant-based diets and eating patterns generally                food choices they make are environmentally sustainable, and of
     • Food allergies and how they are managed                        those who agree, 63% say it would have a greater influence on
                                                                      their choices if it were easier.
     • The link between food and desired health outcomes
     • Beliefs about food production and food technologies          • Brand trust and familiar ingredients matter. While taste
                                                                      remains the top driver of food/beverage purchases, trust in a
     • Views on food safety and sources of information about          brand and recognizing the ingredients that go into a product are
        safety issues                                                 surprisingly impactful. In fact, these factors are similar to price in
• Findings are presented for all respondents. Additional insights     impact. Those who have made changes to their diet in the last 10
  are provided based on how findings vary by different types of       years are especially likely to care about recognizing ingredients.
  demographic groups such as age, race, gender and income.

                                                                                                                                               4

                                                                                                                      FOODINSIGHT.ORG
Executive Summary
Key Findings Continued
• Familiarity and interest in plant-based diets is high. Nearly 3 in • Frequent snackers are more susceptible to cravings, habit, and
4 consumers say they have heard of plant-based diets and half of convenience. Over half of consumers snack at least daily and 1 in
all consumer are interested in learning more. That said, many 4 say they snack multiple times a day. Not surprisingly, many say
think the term describes a vegan diet and more than half think it they snack simply because they are hungry/thirsty. Yet those who
would be hard to stick with over the holidays and difficult to snack more than once a day are much more likely to say that
accommodate at restaurants. they do so because they crave sweet or salty snacks, that they do
it out of habit, or that they do it because the snacks are
• One-third say they eat plant-based protein daily. While very available/convenient.
few say they are actively following a plant-based diet, 34% say
they consume plant-based protein daily. One-quarter also say • 1 in 4 consumers actively seek health benefits from foods.
they eat more plant-based protein than they did 12 months ago. Although many say they simply try to eat healthy in general, 23%
of consumers say they actively seek out foods or follow a diet for
• Similar number of Americans are dieting compared to 2018, health benefits. Most often the benefits they seek are weight
with clean eating diets most common. 38% of consumers say loss, energy, digestive health, and heart health.
they followed a specific eating pattern or diet in the past year,
similar to the 36% who did so in 2018. While intermittent fasting • Government agencies most trusted for recall info. 45% of
continues to be a relatively common choice, clean eating (added consumers say a government agency would be their top source
to the survey for the first time this year) is actually the most for information about a recall. This is especially true of older
widely cited diet that consumers say they follow. consumers. No other source garners even 10%.
5
FOODINSIGHT.ORGDemographics
FOODINSIGHT.ORGDemographics
Gender Household Income
Male 48% Less than $35,000 28%
Female 51 $35,000 to $49,999 12
Prefer not to say * $50,000 to $74,999 15
$75,000 to $99,999 13
$100,000 to $149,999 16
$150,000 and above 15
Age Don't know *
18 to 34 31% Prefer not to answer 1
35 to 49 25
50 to 64 26
65 to 80 18
Education
Less than high school 3%
Race/Ethnicity Graduated high school 30
Some college 21
White 69%
AA degree/technical/vocational 12
Hispanic/Latino/Spanish descent 17
Bachelor's degree 21
Black or African American 14
Graduate/professional degree 12
Asian or Pacific Islander 7
Other 2
7
FOODINSIGHT.ORGDemographics
US Region Marital Status
Northeast 18% Married 47%
South 38 Living with partner 10
West 24 Single, never married 28
Midwest 21 Divorced or separated 11
Widowed 4
Other *
Type of Location
Children’s Ages
Suburban 45%
Newborn to 2 years old 6%
Urban 27
3 to 5 years old 7
Rural 17
6 to 8 years old 7
Small town 12
9 to 17 years old 16
18 or older 35
BMI Score Do not have any children 42
Normal or Low 37% Prefer not to say 1
Overweight 30
Obese 31
Prefer not to answer height/weight 2
8
FOODINSIGHT.ORGDemographics
Medical Conditions Consumers are Multiple responses accepted
Currently Being Treated for
High blood pressure 25%
High cholesterol 23%
Stress/Anxiety/Depression 15%
Overweight/obesity 11%
Diabetes 8%
Gastrointestinal disorders 6%
Osteoporosis 4%
Heart disease 3%
Muscle strength/mobility 3%
Attention deficit hyperactivity disorder (ADHD) 2%
Cancer/cancer survivor 2%
Stroke 1%
None of the above 46%
9
FOODINSIGHT.ORGPrimary Purchase Drivers
10
FOODINSIGHT.ORGConsumers View Themselves in Good Health
Despite over half rating health as excellent/very good, three in five of respondents are classified as overweight or obese
Self-Reported Health Status
Excellent 53%
Of consumers indicate their health
is excellent or very good
Very good
2019
68%
Of consumers with income above
Good 2018 $75,000 rate health as excellent or
2017 very good, compared to 31% of
those with income less than
2016 $35,000
Fair
68%
Of college grads rate their health
Poor
as excellent or very good,
compared to 45% of those with
less than a college degree
0% 10% 20% 30% 40% 50%
11
Q1: How would you describe your own health, in general? (n=1,012)
FOODINSIGHT.ORGTaste and Price Remain Top Drivers
Taste is more important to older consumers while price is more important to younger ones; the importance of taste has increased
since 2018
Purchase Drivers Over Time
(% 4-5 Impact out of 5)
100%
2019
90%
Taste Taste 86
80% Price 68
Healthfulness 62
70% Price Convenience 57
Environmental 27
60% Healthfulness Sustainability
Convenience
50%
40%
30% Environmental
Sustainability*
20%
10%
0%
2012 2013 2014 2015 2016 2017 2018 2019
Q8: How much of an impact do the following have on your decision to buy foods and beverages? (n=1,012) 12
*Prior to 2019, Environmental Sustainability was asked simply as “Sustainability”
FOODINSIGHT.ORGTrust in Brand and Ingredient Recognition Have a
Significant Impact on Purchases
3 in 10 consumers say that recognizing the ingredients and trust in the brand have a great impact, nearly as high as price
Impact of Brand Trust and Recognizable Ingredients
5 - A great impact 4 3 2 1 - No impact
Taste 85%
Of those 65+ say trust
Your trust in the brand is a top driver vs.
roughly 66% younger
consumers
Price
Recognizing the ingredients that go into the product
88%
Healthfulness Of consumers with no
allergies in the
household rate taste as
Convenience most important
compared to 79% of
Environmental Sustainability consumers with
allergies in the
household
0% 20% 40% 60% 80% 100%
Q8: How much of an impact do the following have on your decision to buy foods and beverages? (n=1,012) 13
Q9: How much of an impact does the following have on your decision to buy foods and beverages? (n=1,012)
FOODINSIGHT.ORGDiets and Eating/Shopping Patterns
14
FOODINSIGHT.ORGClean Eating the Most Widely Cited Diet in 2019
Most common eating patterns/diets include clean eating and intermittent fasting
Followed A Diet in Past Year? Type of Diet Followed
Clean eating*
Intermittent fasting
Gluten-free diet
Low-carb diet
Ketogenic or high-fat diet
38% Weight-loss plan
Mediterranean diet
Yes Plant-based diet* 2019
Flexitarian*
2018
Vegetarian or vegan diet
Paleo Diet
Cleanse
Whole 30
DASH diet
2018: Low-FODMAP*
36% Yes Other
Q33: Have you followed any specific eating pattern or diet at any time in the past year? Select all that apply. (n=1,012) 0% 5% 10% 15%
15
*Indicates new diet added in 2019
FOODINSIGHT.ORGOver Half Of those Adopting a Diet Cite Weight
Loss as the Motivator
Wanting to feel better/have more energy is cited right behind weight loss
Motivators for Adopting a New Diet
(Of those who followed a specific eating pattern in past year)
I wanted to lose weight
I wanted to feel better and have more energy
I wanted to protect my long-term health/prevent future health conditions
I wanted to improve my physical appearance
I wanted to improve my health so I can have more independence in life
I wanted to prevent weight gain
A conversation with or diagnosis from a health care professional
A conversation with a friend or family member
A news article, blog post, or study that discussed the effects of my selected eating
patterns
Other
0% 20% 40% 60% 80%
16
Q34: Which of the following motivated you to make an effort to adopt a new eating pattern/diet? Select all that apply. (Of those who followed a specific eating pattern in past year, n=362)
FOODINSIGHT.ORGDiets Have Changed Compared to a Decade Ago
2 in 5 say that their diet is extremely or very different from what it looked like 10 years ago
How different is your overall diet now versus what it
looked like 10 years ago?
50%
Extremely different 39% 18 to 34 Of Hispanic/Latino consumers
Extremely/ say that their diet is
Very different extremely/very different
Very different
35 to 49 compared to 35% of non-
Hispanic white consumers
Somewhat different Extremely/Very
different
50 to 64
Not too different 28%
Not too/Not at 55%
all different Of consumers with allergies in
Not too different/ the household say their diet is
Not at all different
65 to 80
Not at all different extremely/very different from
10 years ago, vs. 35% of
0% 20% 40% 0% 20% 40% 60% consumer without an allergy
in the household
17
Q6: How different is your overall diet now versus what it looked like 10 years ago? (n=1,012)
FOODINSIGHT.ORGPeople Say They Are Eating Healthier Now
Limiting sugar intake and eating more fruit and vegetables are the top ways in which consumers’ diets have changed
Ways in Which Diet Has Changed
Consumers from the South are
Limiting sugar intake less likely than their counterparts
Eating more fruits and vegetables to report that their diet is better
Eating less carbohydrates now vs. 10 years ago
Eating healthier protein sources*
Better and healthier diet in general
Eating smaller portions or fewer unnecessary snacks
Watching and paying more attention to what you eat* 75% 80%
Net: Trends Of consumers with an income of
Eating more fresh, organic, less processed foods
Healthier $75k report having a better diet
Eating less "junk" and fast food
compared to 62% of consumers
Eating less unhealthy fats
with an income of less than $35k
Eating fewer calories
Switched to a vegetarian or vegan diet
Used to be a healthier person in general
Eating more unhealthy fats and sugars 9% 79%
Do not have the funds or time to make healthy choices Net: Trends Less Healthy Of consumers without children
Change in general: diet is not better nor worse under 18 report having a better
Changed diet due to health issues* diet compared to 66% of
Very little change consumers with children under 18
Other
Don’t know
0% 5% 10% 15% 20%
*Response text abridged 18
Q7: In what ways is your diet different from what it looked like 10 years ago? Please give as much detail as possible. (Of those who’s diet is different, n=386)
FOODINSIGHT.ORGOver One-Third Have Never Seen MyPlate
Female consumers and consumers who have tried a diet in the past year are particularly familiar with the icon
Familiarity with the MyPlate Graphic
2019 2018 2017 2016
I have seen it and know a lot about it 60%
Have seen the MyPlate
graphic
I have seen it and know a fair amount
about it
46%
I have seen it but know very little about it Of women know at least a
fair amount about the
MyPlate graphic compared
I have never seen it before to 30% of men
Not sure
0% 20% 40%
19
Q2: How familiar are you, if at all, with the following graphic? (n=1,012)
FOODINSIGHT.ORGSugar and Carbs Believed to be Most Likely to
Cause Weight Gain
One-quarter believe calories from all sources impact weight the same, an increase from 2018
Source of Calories Most Likely to Cause Weight Gain
Sugars 33%
Carbohydrates 27% Of those with a college degree
indicate sugars are the most
Fats likely to cause weight gain
Protein compared to 25% of those with
23% less than a college degree
All sources same
13% 28%
3% Of women say that
carbohydrates are most likely to
cause weight gain compared to
25% 18% of men
Not sure
9%
2011 2012 2013 2014 2015 2016 2017 2018 2019
20
Q3: What source of calories is the most likely to cause weight gain? (n=1,012)
FOODINSIGHT.ORGNearly 4 in 10 Unfamiliar with Mindful Eating
However, 3 in 5 are interested in learning more about mindful or intuitive eating
Familiarity and Interest in Mindful or Intuitive Eating
40%
49%
Consumers age 18-34 are familiar
Mindful or Intuitive Eating with the concept compared to 27%
NET familiarity: 37% of consumers age 50+
30% NET interest: 59%
42%
20% Of women are familiar with the
concept compared to 30% of men
10%
42%
Of consumers from the West are
familiar with the concept compared
0% to 30% of the Midwest
I have heard of it, and I am I have heard of it, but I do I have not heard of it, but I am I have not heard of it, and I do
interested in learning more not want to learn more interested in learning more not want to learn more
Q32: Which of the following best describes your familiarity and interest in the practice of “mindful or intuitive eating”? (n=1,012)
21
FOODINSIGHT.ORGDistracted Eating May be the New Normal
Only 13 percent say they always stop eating when they’ve had enough but not too much
Eating Patterns Related to
Mindful/Intuitive Eating
Always Often Sometimes Rarely Never Not sure 57%
Of consumers in very good health
I stop eating when I’ve had enough but not say that they stop eating when
too much they’ve had enough compared to
48% of consumers in good health
and 41% of consumers in fair/poor
I pay close attention to the flavors and health
textures of my food as I eat
I stop myself from eating if I’m not hungry 42%
Of African Americans state they
often or always try to limit
distractions when they eat compared
I try to limit distractions when I am eating
to 25% of non-Hispanic whites and
a meal or snack
20% of Hispanics
0% 10% 20% 30% 40% 50% 60% 70% 80% 90% 100%
22
Q29: How often do you do the following? (n=1,012)
FOODINSIGHT.ORGMindful Eating: Interest vs Practices
Consumers who report being interested in mindful/intuitive eating more often partake in mindful eating habits even if not familiar
Differences in Eating Patterns by Familiarity
and Interest in Mindful/Intuitive Eating
I stop eating when I’ve had enough but not too much
Heard of it, and I'm interested (n=216)
I pay close attention to the flavors and textures of my food
as I eat Heard of it, but I'm not interested (n=160)
Have not heard of it, but I'm interested (n=397)
Have not heard of it, and I'm not interested (n=239)
I stop myself from eating if I’m not hungry
I try to limit distractions when I am eating a meal or snack
0% 20% 40% 60%
23
Q29: How often do you do the following? (n-size varies)
FOODINSIGHT.ORGNearly Everyone Snacks At Some Point During the Week
Being hungry or thirsty and craving sweet and/or salty snacks are top reasons why people snack
Frequency of Snacking Reasons for Snacking
(Of those who snack)
I am hungry or thirsty
Multiple times a day
I crave sweet snacks
I crave salty snacks
Once a day Out of boredom
I need energy
A few days a week It is too long until my next meal
Snacks are easily available to me/convenient
It is a habit of mine
Once a week or less
Snacks are a treat/reward for me
I want something nutritious
Never
In response to negative emotions like feeling sad or anxious
In response to positive emotions like feeling happy or excited
0% 20% 40% As a way to procrastinate
Other
Q30: In a typical week, how often do you snack in addition to your main meals? (n=1,012) 0% 10% 20% 30% 40% 50% 24
Q31: Which of the following are the most common reasons why you choose to snack? Please select your top 3 reasons. (Of those who snack ever, n=986)
FOODINSIGHT.ORGInfrequent Snackers Driven More by Hunger and Thirst
Frequent snackers more often report doing so because of a craving or out of habit
Key Differences in Snacking By Frequency of Snacking
(Of those who snack)
I am hungry or thirsty
I crave sweet snacks Multiple times a day
Once a day
A few days a week
I crave salty snacks
Once a week or less
It is a habit of mine
Snacks are easily available to me/convenient
0% 20% 40% 60%
Q30: In a typical week, how often do you snack in addition to your main meals? (n=1,012) 25
Q31: Which of the following are the most common reasons why you choose to snack? Please select your top 3 reasons. (Of those who snack ever, n=986)
FOODINSIGHT.ORGPicky Eaters Are a Challenge For Parents
Only 13% say they experienced few to no barriers in introducing foods
Biggest Challenge When Introducing Foods to Children as Infants
(Of those who have a kid under 9 years)
Overcoming picky eating
Knowing what foods my child liked
Knowing how much to feed my child
Knowing when to feed my child
Knowing what foods are the healthiest for my child at that age
Affording nutritious food
Having adequate time to feed my child
I experienced few to no barriers
I have not yet introduced foods to my infant
0% 10% 20% 30% 40%
26
Q35: What was the biggest challenge that you experienced when starting to introduce foods to your children as infant(s)? (Of those who have children under 9 years, n=139)
FOODINSIGHT.ORGMajority of Consumers Shop In-Person At Least
Once a Week
Only one in eight consumers grocery shop online at least once a week
Grocery Shopping Patterns
77%
Of those with household
Multiple times a week Once a week Several times a month Once a month Less than once a month Never income of $75K+ grocery
shop in person weekly, vs.
57% of those with less than
$35K
In-person
16%
Of those who followed a
diet in that past year
69% At least once a week grocery shop online weekly,
vs. 11% of those who
didn’t follow a diet
Online
18%
Of consumers with children
under 18 years shop online
13% At least once a week at least once a week, vs.
roughly 11% of consumers
0% 20% 40% 60% 80% 100%
without children under age
18
27
Q10: How often do you buy groceries…? (n=1,012)
FOODINSIGHT.ORGPlant-Based Diets
28
FOODINSIGHT.ORGConsumers are Familiar with Plant-Based Diets
Three quarters are familiar with plant-based diets and half are interested in learning more
Familiarity and Interest in Plant-Based Diets
60%
50%
Plant-Based Diets
NET familiarity: 73%
40% NET interest: 51% 82%
Of consumers who have tried a
diet in the past say year that they
30% have heard of plant-based diets
compared to 68% who have not
tried a diet
20%
10%
0%
I have heard of it, and I am I have heard of it, but I do I have not heard of it, but I I have not heard of it, and I
interested in learning more not want to learn more am interested in learning do not want to learn more
more
Q12: Which of the following best describes your familiarity and interest with “plant-based diets”? (n=1,012)
29
FOODINSIGHT.ORGConsumers Split on Definition of Plant-Based
Vegan diets, those that are minimally processed, limited animal consumption and vegetarian diets most widely held definitions of
plant-based
Definition of Plant-Based Diets
(Of those who have heard of plant-based diets)
A vegan diet in which you avoid all animal products,
including eggs and dairy
A diet that emphasizes minimally-processed foods
that come from plants, with limited consumption of
animal meat, eggs, and dairy
A vegetarian diet in which you avoid eating animal
meat
A diet in which you try to get as many fruits and
vegetables as possible, with no limit on consuming
animal meat, eggs, and dairy
Other
Not sure
0% 20% 40%
30
Q13: Which of the following best matches how you would define a “plant-based diet”? Please select only one answer. (Of those who have heard of plant-based diets, n=742)
FOODINSIGHT.ORG1 in 4 Eat More Plant-Based Protein this Year
Over one-third eat plant-based protein at least once a day
Consumption of Animal vs. Change in Consumption of Protein Sources in
Plant-Based Protein the Past 12 Months
Animal Protein Animal Protein
More than 3 times a
day Plant-based Protein 34% Eat plant-based Eat much more now
Plant-based Protein
24% Eat much/somewhat
protein at least once a day more plant-based protein
Eat somewhat more
2-3 times a day now vs. 12 months ago
now
52% Eat animal protein at
Once a day Eat the same amount
least once a day
Eat somewhat less
A few times a week
now 12% Eat much/somewhat
more animal protein now
Once a week or less Eat much less now
vs. 12 months ago
Never consume Never consume
Not sure Not sure
0% 10% 20% 30% 40% 50% 0% 10% 20% 30% 40% 50%
Q41: How often do you consume animal protein (e.g., meat, fish, poultry, dairy, eggs) and plant-based protein (e.g., soy/tofu, nuts, beans and legumes) on average? (n=1,012)
Q42. Thinking about the last 12 months, how has your consumption of animal protein (e.g., meat, fish, poultry, dairy, eggs) and plant-based protein (e.g., soy/tofu, nuts, beans and legumes) changed? (n=1,012) 31
FOODINSIGHT.ORGHolidays and Eating Out Believed to Be Most Difficult
Times to Follow Plant-Based Diets
Half also believe buying food on a budget or getting the protein needed would be difficult
Ease of Completing Activities for Those on Plant-Based Diets
Net:
(Somewhat/
1 - Very difficult 2 3 4 5 - Very easy Very Difficult)
Stick with it through the holidays 61%
Find things to eat at restaurants 57%
68%
Of consumers age 65+ think it would
somewhat/very difficult to find things
Buy food/groceries on a budget 51% to eat at a restaurant, vs. 55% of
consumers younger than 35
Get all the protein they need from plant-based
49%
foods without eating animal meat/products
Get all of the vitamins and nutrients they need 42% 41%
Of non-Hispanic whites think it would
Cook for themselves and family members 38% somewhat/very difficult to find recipes
that taste good, vs. 26% and 28% of
Find recipes that taste good 36% Hispanics and African Americans
respectively
0% 20% 40% 60% 80% 100%
Q15: How easy do you think it would be for someone following a plant-based diet to…? (n=1,012)
32
FOODINSIGHT.ORGFood Allergies
33
FOODINSIGHT.ORG1 in 6 Consumers Report Having a Food Allergy in the
Household
More consumers with children under 18 years report an allergy in the household
Allergies in Household Allergies Outside of the Household
Other than the people in your household, do you
know anyone personally who has a food allergy?
I have food allergies
My spouse/partner has food
allergies
17%
At least one of my kids has food Have a food 37%
allergies allergy in the
household Yes
Someone in my household has
food allergies
No, no one in my household has
food allergies
0% 20% 40% 60% 80%
Q16: Do you or does anyone in your household have a doctor-diagnosed food allergy? Select all that apply. Please answer only about food allergies. Food allergies are immune system reactions
that occur after eating a certain food and do not include conditions like lactose intolerance or sensitivity to gluten. (n=1,012)
Q18: Other than the people in your household, do you know anyone personally who has a food allergy? (n=1,012)
34
FOODINSIGHT.ORGPeanut, Milk, and Shellfish Allergies are Most Common
One-third of consumers with an allergy in the household report that this allergy is extremely/very severe
Type of Allergy in Household Severity of Allergy
(Of those with an allergy in household) (Of those with an allergy in household)
30%
25% 7%
17%
Extremely severe
34%
20%
26%
Very severe
15%
Extrm./ 17%
Somewhat severe
10%
Very
Not too severe
Severe
Not at all severe
5%
33%
0%
Peanuts Milk Crustacean Tree nuts Eggs Fish Wheat Soybeans Other
shellfish
Q17: Which of the following doctor-diagnosed food allergies do the people in your household have? Select all that apply and answer for everyone in your household who has a food allergy. (Of those who have an allergy in household, n=167) 35
Q19: How severe is the most severe food allergy in your household? (Of those who have an allergy in household, n=167)
FOODINSIGHT.ORGReading Food Labels is Top Way to Manage Allergies
2 in 10 say they mostly avoid eating out entirely due to allergies
Ways Allergies Are Managed
(Of those who have an allergy in the household)
50%
45%
40%
35%
30%
25%
20%
15%
10%
5%
0%
Carefully read food Avoid certain types Make restaurants Take steps in the Have an action plan Cook mostly at Carry an Epi-Pen at Joined a local Other None of the above
labels/ingredients of restaurants or aware of the allergy kitchen to avoid should an allergy home/avoid eating all times support group
cuisines when eating out cross-contamination attack occur out
Q20: Which of the following are ways that you/your household manages the food allergy/allergies present in your household? Select all that apply. (Of those who have an allergy in household, n=167)
36
FOODINSIGHT.ORGParents Unsure When to Introduce Peanuts
Slightly more than one-third of parents with children under 9 believe it is when children turn one year old
When Parents Think Peanuts Should be
Introduced to the Average Infant
(Of those who have children under 9 years)
American Academy of
Pediatrics Guideline:* When they turn one year old
“…infants without eczema or any food 57%
allergy have age-appropriate peanut- Of consumers with an income of
containing foods freely introduced in At the same time you intoduce otherDoctors are Most Trusted Source for Allergy Info
Consumers with allergies in the household are no different compared to the overall population in terms of trusted sources
Most Trusted Source for Information on Food Allergies
Health care professional
Registered Dietitian Nutritionist (RDN)
Government agency*
Health-focused website (e.g., Mayo Clinic)
A food company or manufacturer
Friend or family member
Consumer advocacy groups
Health insurance providers
Retailer (e.g., supermarket)
Other
Would not trust anyone
0% 10% 20% 30% 40%
*Response text abridged 38
Q61: Imagine that you or someone you know is living with one or more food allergies. Who would you trust the most to provide you with information on food allergies? Select only one. (n=1,012)
FOODINSIGHT.ORGNutrients and Desired Health
Benefits
39
FOODINSIGHT.ORG1 in 4 Consumers Seek Health Benefits From Food
Weight loss, energy, and digestive health are the most sought-after benefits
Seek Health Benefits from Foods? Top Sought After Health Benefits
(Of those who seek health benefits from foods)
Weight loss/weight management
Energy
6%
Digestive health
Yes, I actively seek out foods or 23% Heart/Cardiovascular health
15%
follow a diet for health benefits Muscle health/strength
No, but I try to eat healthy in Brain function*
general
No, health benefits are not a
23% Bone health
Cancer protection/prevention
factor in my food choices YES Immune function
Emotional/mental health
Not sure
Lowering inflammation
Diabetes management*
Athletic/sports performance
56%
Other
None of the above
0% 20% 40% 60%
*Response text abridged
Q36: Do you seek out certain foods or follow a particular diet because of the health benefits that those foods/diet provide? (n=1,012) 40
Q39: Which of the following health benefits are you seeking to get from foods or nutrients? Select all that apply. (Of those who seek health benefits from foods, n=247)
FOODINSIGHT.ORGInterest in Heart Health, Weight Loss, Energy Benefits
Of those not actively seeking out health benefits from food, women are more interested in weight loss than men while older
consumers are more interested in heart/cardiovascular health than their younger counterparts
Seek Health Benefits from Foods? Interest in Certain Health Benefits
(Of those who do not seek health benefits from food)
Heart/Cardiovascular health
Weight loss/weight management
6%
Energy
Yes, I actively seek out foods or 23% Brain function*
15%
follow a diet for health benefits Cancer protection/prevention
77%
No, but I try to eat healthy in Digestive health
general Muscle health/strength
Diabetes management*
No, health benefits are not a
factor in my food choices
No/Not Immune function
Not sure Sure Bone health
Emotional/mental health
Lowering inflammation
Athletic/sports performance
56%
Other
None of the above
0% 20% 40% 60%
*Response text abridged
Q36: Do you seek out certain foods or follow a particular diet because of the health benefits that those foods/diet provide? (n=1,012) 41
Q40: Which of the following health benefits would you be most interested in getting from foods or nutrients? Please select the top 3 benefits (Of those who do not seek health benefits from foods, n=765)
FOODINSIGHT.ORGFiber and Prebiotics Perceived as More Healthful
this Year
As was seen in 2018, fiber, whole grains and protein from plant sources remain at the top
Perceived Healthfulness of Foods
Healthy Neither healthy nor unhealthy Unaware Unhealthy
Fiber
% Healthy by Gender
Whole grains
Men Women
Protein from plant sources
Omega-3 fatty acids Protein from
plant sources
Probiotics
Dairy* Omega-3s
Enriched refined grains
Prebiotics Probiotics
Unsaturated fats
Animal protein
Animal protein
Fortified foods 0% 20% 40% 60% 80% 100%
Sodium*
0% 20% 40% 60% 80% 100%
Q37: How would you rate the healthfulness of each of the following? (n=1,012) 42
*Indicates new addition to list starting 2019
FOODINSIGHT.ORGDesired Consumption Mirrors Perceived
Healthfulness
Older consumers more often than younger ones indicate that they try to consume fiber and whole grains
Consume or Avoid the Following
Try to consume Neither - Just try to be aware Don't consider Not sure Try to limit or avoid
Fiber % Try to Consume by Age
Whole grains
Omega-3 fatty acids
18-34
Protein from plant sources
35-49
Probiotics Fiber 50-64
65-80
Dairy
Enriched refined grains Whole grains
Animal protein
Prebiotics
Animal protein
Unsaturated fats
Fortified foods 0% 20% 40% 60% 80% 100%
Sodium
0% 20% 40% 60% 80% 100%
43
Q38: Do you generally try to consume or avoid the following? (n=1,012)
FOODINSIGHT.ORG1 in 4 Understand “Nutrient-Density”
One-third have not heard of it but want to learn more; younger consumers are more familiar with the concept
Familiarity and Interest in Nutrient-Density Familiarity and Understanding
by Age
40% I understand the concept
18-34
and often apply it when
shopping 35-49
Nutrient-Density
30% 50-64
NET Understand: 23% I understand the concept
but don’t often apply it 65-80
when shopping
20%
I have heard of the
concept, but I don’t
understand what it means
10%
I have not heard of the
concept, but I’m interested
in learning more
0%
I understand the I understand the I have heard of the I have not heard of the I have not heard of the
I have not heard of the
concept and often apply concept but don’t often concept, but I don’t concept, but I’m concept, and I do not
it when shopping apply it when shopping understand what it interested in learning want to learn more
concept, and I do not want
means more to learn more
0% 20% 40%
Q43: Which of the following best describes your familiarity and interest in the concept of “nutrient density”? (n=1,012)
44
FOODINSIGHT.ORGSugars and Sweeteners
45
FOODINSIGHT.ORGConsumers Take Multiple Actions to Limit Sugar
A higher percentage of 65+ consumers use the Nutrition Facts Panel to choose products with lower sugar and have stopped adding
sugar to products
Actions Taken to Limit/Avoid Sugars
Limiting/Avoiding (Of those limiting/avoiding sugars)
Sugars in Diet
Drinking water instead of caloric beverages
14% Eliminating certain foods and beverages from my diet
20%
Reducing the amount of carbs I consume
80%
No longer adding table sugar to foods and beverages
Using the Nutrition Facts label to choose products with less sugar*
Are trying to
limit/avoid Consume smaller portions
sugars
Reducing the number of calories I consume each day
Using low-calorie sweeteners instead of adding sugar
67%
Switching from full-calorie beverages to low- and no-calorie options
Ordering or purchasing "sugar-free" options when available
Avoid Limit
Other
Q44: Are you trying to limit or avoid sugars in your diet? (n=1,012) 0% 20% 40% 60% 80%
Q45: What action(s) are you taking to limit or avoid sugars? Check all that apply. (Of those limiting/avoiding sugars, n=819) 46
*Response text has been abridged
FOODINSIGHT.ORG3 in 10 Say They Don’t Sweeten Foods or
Beverages
Consumers choose low/no-calorie sweeteners to consumes less sugar, lose weight, consume fewer calories, and manage diabetes
Perceived Benefits of Using
Sweeteners Likely to Use Low/No-Calorie Sweeteners
(Of those who use low/no-calorie sweeteners)
Consume less sugar
33% Lose weight
Consume fewer total calories
36% 33% Manage diabetes or control blood sugar
Use low/no Maintain my weight
calorie
sweeteners Reduce carbohydrate intake
Improve or maintain dental health
31% Consume an appropriate amount of sugar
Consume an appropriate amount of total calories
Any type of sugar (table sugar, honey, maple syrup) Other
Low/no calorie sweeteners (aspartame, sucralose, stevia)
None of the above
I don't use any type of sugar or low/no-calorie sweeteners
0% 20% 40%
Q46: Which of the following are you more likely to use to sweeten foods and/or beverages? (n=1,012) 47
Q49: Which of the following, if any, do you believe consuming low/no-calorie sweeteners helps you do? (Select top answer.) (Of those who use low/no-calorie sweeteners, n=325)
FOODINSIGHT.ORGMultiple Reasons Why Consumers Don’t Sweeten
their Foods and Beverages
Consumers who avoid both sugars and low/no-cal sweeteners think that both can be unhealthy
Reasons For Not Using Sugar Reasons For Not Using Low/No-Calorie Sweetener
(Of those who don’t use sugar or low/no-calorie sweetener) (Of those who don’t use sugar or low/no-calorie sweetener)
I don’t need to add sweetness
I don’t want the extra calories I don’t need to add sweetness
I think it helps me lose/maintain weight
I think low-calorie sweeteners are unhealthy
I think sugar is unhealthy
I consume sugar in packaged foods and beverages,
but don’t add more myself I don’t like the taste of low-calorie
sweeteners
To reduce my carbohydrate intake
I consume low- or no-calorie sweeteners in
Improve or maintain my dental health packaged foods and beverages, but don’t
add more myself
To manage diabetes or control blood sugar
Advice from my healthcare professional
Advice from my healthcare professional
Major Reason
Major Reason
I follow a diet that forbids sugar I follow a diet that forbids low and no
Minor Reason Minor Reason
calorie sweeteners
I don’t like the taste of sugar
0% 20% 40% 60% 80% 100%
0% 20% 40% 60% 80% 100%
Q47: Why don’t you use any type of sugar (ex. Table sugar, honey, maple syrup) to sweeten your foods and/or beverages? (Of those who don’t use sugar or low/no-calorie sweeteners, n=331) 48
Q48: Why don’t you use any type of low or no calorie sweeteners (ex. Aspartame, Sucralose, stevia leaf extract) to sweeten your foods and/or beverages? (Of those who don’t use sugar or low/no-calorie sweetener, n=331)
FOODINSIGHT.ORGFood Production
49
FOODINSIGHT.ORGKnowing Where Food Comes From is Important
More than half say knowing where their food comes from is highly important; nearly half say the same about knowing a
manufacturer has a commitment to environmental sustainability
Important Factors When Purchasing Food
5 - Very important 4 3 2 1 - Not at all important
59% and 58%
Of Hispanics and African Americans,
Knowing where the food comes from
respectively, believe it is
very/somewhat important to know
Knowing that the manufacturer has a commitment that their food is produced in an
to producing food in an environmentally sustainable environmentally sustainable way
way compared to 41% of non-Hispanic
whites
Being able to access information about how my food
is produced
49% and 52%
Knowing that the food was produced with animal Of consumers from the South and
welfare in mind West respectively believe it is
very/somewhat important to know
Knowing the food was produced using modern that their food is produced in an
farming technologies environmentally sustainable way
compared to 38% of consumers
0% 20% 40% 60% 80% 100% from the Midwest
Q50: How important are the following factors in your decision to purchase a food or beverage? (n=1,012)
50
FOODINSIGHT.ORGTaste/Cleanliness are Key for Restaurant Choice
Past experience and customer service ranked below these factors
Important Factors When Choosing a Restaurant or Cafeteria
5 - Very important 4 3 2 1 - Not at all important
Multiple factors are more important to
Food quality / taste older consumers than youngers ones
when choosing where to eat out
Cleanliness
4 of 7 factors are more important to
Past experience women than men when choosing where
to eat out
Customer service
Menu with options for a range of diets (e.g., vegetarian, low- 66%
carb, paleo) Of consumers with an allergy in the
household say awareness of food allergies
Menu labeling (e.g., calorie counts) and ability to accommodate is
very/somewhat important compared to
Awareness of food allergies and ability to accommodate 34% of consumers without allergies in the
household
0% 20% 40% 60% 80% 100%
Q51: How important are the following factors when it comes to choosing a restaurant or cafeteria? (n=1,012)
51
FOODINSIGHT.ORGOver Half Say Sustainability is Important
Labeled as being locally grown top indicator for perceived environmental sustainability
Perceived Factors to Know if a Product is
Importance of Environmental Produced in an Environmentally Sustainable Way
Sustainability in Food Products Purchased (Of those who say it’s important their food be produced sustainably)
4% Labeled as being locally grown
6%
22% 68%
9% Of African Americans say it is Labeled as sustainably sourced
very/somewhat important to Labeled as non-GMO/not bioengineered
54% them vs. 52% of non-Hispanic
whites
(BE)
Labeled as organic
Important
27%
Recyclable packaging
33%
59%
Minimal packaging
Of women say it is
very/somewhat important to
Other
them vs. 49% of men
Very important
Somewhat important None of the above
Neither important nor unimportant
Not very important
Not at all important 0% 10% 20% 30% 40% 50% 60%
Don't know enough
Q52: How important is it to you that the food products you purchase or consume are produced in an environmentally sustainable way? (n=1,012)
Q53: You mentioned that it is important to you that food products are produced in an environmentally sustainable way. When shopping for foods and beverages, which of the following do you 52
look for as a way to know that a product is produced in an environmentally sustainable way? Select all that apply. (Of those who say it’s important their food be produced sustainably, n=554)
FOODINSIGHT.ORGMajority Say It’s Hard to Know Whether Food
Choices are Environmentally Sustainable
Consumers with a higher income are more likely to agree that it is hard to know whether food choices are environmentally
sustainable
Agree or Disagree: Agree or Disagree:
“It is hard for consumers to know whether the food “If it was easier to know whether my food choices were environmentally
choices they make are environmentally sustainable” sustainable, it would have a greater influence on the choices I make”
(Of those who agree it is hard to know)
Agree strongly
63% Agree strongly
63%
Strongly / Strongly /
Somewhat agree Somewhat agree Somewhat agree Somewhat agree
Neither agree nor Neither agree nor
disagree disagree
Somewhat disagree Somewhat disagree
9% 15%
Somewhat/ Somewhat/
Disagree strongly Strongly disagree Disagree strongly Strongly disagree
0% 20% 40% 60% 0% 20% 40% 60%
Q4: Do you agree or disagree with the following statement? "It is hard for consumers to know whether the food choices they make are environmentally sustainable.” (n=1,012) 53
Q5: Do you agree or disagree with the following statement? “If it was easier to know whether my food choices were environmentally sustainable, it would have a greater influence on the choices I make.” (Of those who agree it is hard to know, n=651)
FOODINSIGHT.ORGFewer Than 1 in 4 Have Heard of Regenerative Ag
While it is somewhat unfamiliar with consumers, over half are interested in learning more
Familiarity and Interest in Regenerative Agriculture % by Age
60%
18-34
I have heard of it, and I am
50% Regenerative Agriculture interested in learning more 35-49
NET familiarity: 22%
50-64
40% NET interest: 55%
65-80
I have heard of it, but I do
not want to learn more
30%
20% I have not heard of it, but I
am interested in learning
more
10%
I have not heard of it, and I
0% do not want to learn more
I have heard of it, and I am I have heard of it, but I do I have not heard of it, but I I have not heard of it, and I
interested in learning more not want to learn more am interested in learning do not want to learn more
more 0% 20% 40% 60%
Q54: Which of the following best describes your familiarity and interest in the practices of “regenerative agriculture”? (n=1,012)
54
FOODINSIGHT.ORGSame Nutrition Information, but Differences in
Perceived Healthfulness
Despite identical nutritional info, freshness, “all natural” description, familiarity, and environmental sustainability influence perception
55
Q11: Imagine you came across two food products that had the exact same Nutrition Facts panel. Would any of the following details lead you to believe that one of the products was more likely to be healthier? (n=1,012)
FOODINSIGHT.ORGLabeling is More Important When Shopping
Half of consumers say that none of the labeling information is important when eating away from home
Influence of Labels on Purchasing Behavior
60%
Shopping for food and beverages Eating away from home
50%
40%
30%
20%
10%
N/A N/A
0%
Natural No added Raised without Non-"GMO" Pesticide-free Locally-sourced Organic Recyclable Environmentally Sustainably Being made in a None of the
hormones or antibiotics packaging friendly sourced way that above
steroids minimizes food
waste
Q55: Which of the following, if any, do you do on a regular basis (that is, most times when you shop for foods and beverages)? Select all that apply. Buy foods and beverages because they are advertised on the label as…(Split Sample A, n=519) 56
Q56: Which of the following, if any, do you do on a regular basis (that is, most times when you eat away from home)? Select all that apply. Eat at restaurants because they advertised their foods and beverages as…(Split Sample B, n=493)
FOODINSIGHT.ORGSlight Decrease in Confidence Since 2018
Although overall confidence is down slightly, the movement is from “somewhat more confident” to “no change”
Change in Confidence Since
Regulation of Antibiotics
Two years ago, the US Food and Drug Administration 2019 2018*
prohibited growth-promotion uses of antibiotics and
now only allows antibiotics to fight illness in animals
producing food… 2% 3%
11% 13% 11% 13%
How does this change impact your level of confidence
in purchasing meat, poultry, egg, and milk products?
57% 62%
Are you…?
A lot more confident
More More
24%
Somewhat more confident 30%
No change Confident Confident
Somewhat less confident 44%
50%
A lot less confident
Q57: Two years ago, the US Food and Drug Administration prohibited growth-promotion uses of antibiotics and now only allows antibiotics to fight illness in animals producing food…
How does this change impact your level of confidence in purchasing meat, poultry, egg, and milk products? Are you…? (n=1,012) 57
*Question text changed in 2019 to add that the regulation was implemented two years ago.
FOODINSIGHT.ORGFood Ingredients
58
FOODINSIGHT.ORGAlmost 7 in 10 Have Confidence in Food Supply
Older consumers and men express more confidence than their respective counterparts; foodborne illness continues to be seen as
the top food safety issue and even saw an uptick from 2018
Confidence in U.S. Food Supply Most Important Food Safety Issues Today*
Very confident Foodborne illness from bacteria
68% Carcinogens or cancer-causing chemicals in
Very/Somewhat food
Somewhat confident confident Chemicals in food
Pesticides / pesticide residues
Not too confident Food additives and ingredients
27% Animal antibiotics
Not at all confident Not too/Not at all
confident Biotechnology / “GMO”s Ranked 1
Ranked 2-3
The presence of allergens in food
Not sure
Other
0% 20% 40% 60% 0% 20% 40% 60%
*Response text abridged
Q58: Overall, how confident are you in the safety of the US food supply? (n=1,012) 59
Q59: What in your opinion are the three most important food safety issues today? Please rank from 1 to 3, with 1=Most Important. (n=1,012)
FOODINSIGHT.ORGGov’t Agencies Are Top Info Source for Recalls
Consumers age 65+ trust government agencies to a greater degree than those younger than 35 years old
Top Source of Information in the Event of a Recall
Government agency*
60%
Consumer advocacy groups
Health care professional 50%
A food company or manufacturer
40%
Health-focused website (e.g., Mayo Clinic) Government Agency
Retailer (e.g., supermarket) Consumer advocacy groups
30%
Health care professional
Friend or family member
A food company/manufacturer
20%
Registered Dietitian Nutritionist (RDN)
Health insurance providers 10%
Other
0%
Would not trust anyone 18 to 34 35 to 49 50 to 64 65 to 80
0% 10% 20% 30% 40% 50% Age
*Response text abridged 60
Q60: Imagine that you saw on the news that there is a nationwide food recall of a product you regularly purchase. Who would you trust the most to provide you with more information about the recall if you wanted to learn more? Select only one. (n=1,012)
FOODINSIGHT.ORGOnly 1 in 6 Certain About Caffeine Consumption
Consumers remain split on whether naturally occurring caffeine differs from added caffeine
Knows the Amount of Caffeine in True or False:
Foods and Beverages Consumed Caffeine that is naturally occurring has the
(Of those who consume caffeine) same effect as caffeine that is added
2019 2018 2017 2016 2015 2014 2019 2018 2017 2016
Strongly agree
True
Net: 61%
Somewhat agree
False
Somewhat disagree
Not sure
Strongly disagree
0% 20% 40% 60%
0% 20% 40% 60%
Q62: Please indicate how much you agree or disagree with the following statement: I know the amount of caffeine that is in the foods and beverages I consume (Of those who consume caffeine. n=952)
Q63: Please indicate whether the following statement is true or false: 61
Caffeine that is naturally occurring in foods and beverages has the same effect as caffeine that is added to foods and beverages. (n=1,012)
FOODINSIGHT.ORGStatement About Arsenic Impacts Concern Level
Over one-third less concerned, however one in five are actually more concerned after reading the statement
Level of Concern about Arsenic in Foods and Beverages
Change in Level of Concern Before Change in Response
Level of Concern After Reading Statement
and After Reading the Following After Statement
Statement Level of Concern Before Reading Statement
Arsenic is one of many naturally occurring
10-Very high concern
elements in the air, water, rocks and soil. 21%
This means that it is common for a variety
of foods and beverages to naturally contain 8 to 9
38%
38%
trace amounts of arsenic that are not
harmful to consumers. Ongoing monitoring 6 to 7
of our food supply indicates there is no Less
reason to be alarmed about arsenic in the
consumable products that you enjoy. 4 to 5 concerned
Currently, there is no reason to change
your diet and you should feel confident in 2 to 3 41%
the ability of the U.S. government to
maintain the safety of our food supply.
1-No concern
0% 5% 10% 15% 20% 25% Less concerned No difference More concerned
Q64: On a scale of 1 to 10, how concerned are you about the possible presence of arsenic in the foods and beverages you purchase on a regular basis? (n=1,012) 62
Q65: Please read the following statement about arsenic: (See statement above). After reading this statement, how concerned are you, again on a scale of 1 to 10, about the possible presence of arsenic in the foods and beverages you purchase on a regular basis? (n=1,012)
FOODINSIGHT.ORGThank You
@FoodInsight
Food Insight
@FoodInsight
International Food Information Council Foundation
63
FOODINSIGHT.ORGYou can also read