Acceptability of Dry Dog Food Visual Characteristics by Consumer Segments Based on Overall Liking: a Case Study in Poland - MDPI
←
→
Page content transcription
If your browser does not render page correctly, please read the page content below
animals
Article
Acceptability of Dry Dog Food Visual Characteristics
by Consumer Segments Based on Overall Liking:
a Case Study in Poland
David Gomez Baquero 1 , Kadri Koppel 1, *, Delores Chambers 1 , Karolina Hołda 2 ,
Robert Głogowski 2 ID and Edgar Chambers IV 1 ID
 1   Center for Sensory Analysis and Consumer Behavior, Kansas State University, 1310 Research Park Drive,
     Manhattan, KS 66502, USA; dagomezb@ksu.edu (D.G.B.); delores@ksu.edu (D.C.); eciv@ksu.edu (E.C.)
 2   Department of Animal Breeding and Production, Warsaw University of Life Sciences, Ciszewskiego 8,
     Warsaw 02-786, Poland; karolina_holda@sggw.pl (K.H.); robert_glogowski@sggw.pl (R.G.)
 *   Correspondence: kadri@ksu.edu; Tel.: +1-785-532-0163

 Received: 27 April 2018; Accepted: 18 May 2018; Published: 23 May 2018

 Simple Summary: The present work aimed to explore the response of dog owners to the appearance
 of pet foods. The objective of this study was to understand the impact of the visual characteristics
 of dry dog food on the human consumers’ acceptance and beliefs they associate with the products.
 The acceptability of the appearance of dry dog foods by consumers is influenced by the number of
 different kibbles present, color(s), shape(s), and size(s) in the product. The results indicated that
 dry dog food manufacturers should take special consideration with the appearance of the kibbles
 to enhance the acceptability of their products. These findings can help dry dog food manufacturers
 meet the consumers’ needs with increasing benefits to the pet food and commodity industries.

 Abstract: Sensory analysis of pet foods has been emerging as an important field of study for the pet
 food industry over the last few decades. Few studies have been conducted on understanding the pet
 owners’ perception of pet foods. The objective of this study is to gain a deeper understanding on
 the perception of the visual characteristics of dry dog foods by dog owners in different consumer
 segments. A total of 120 consumers evaluated the appearance of 30 dry dog food samples with
 varying visual characteristics. The consumers rated the acceptance of the samples and associated
 each one with a list of positive and negative beliefs. Cluster Analysis, ANOVA and Correspondence
 Analysis were used to analyze the consumer responses. The acceptability of the appearance of dry
 dog foods was affected by the number of different kibbles present, color(s), shape(s), and size(s)
 of the kibbles in the product. Three consumer clusters were identified. Consumers rated highest
 single-kibble samples of medium sizes, traditional shapes, and brown colors. Participants disliked
 extra-small or extra-large kibble sizes, shapes with high-dimensional contrast, and kibbles of light
 brown color. These findings can help dry dog food manufacturers to meet consumers’ needs with
 increasing benefits to the pet food and commodity industries.

 Keywords: affective tests; consumer acceptance; consumer perception; appearance; dry dog food;
 kibble; cluster analysis

1. Introduction
    The pet food industry represents an important sector of the food processing industry. In 2015,
global pet food retail sales reached 70 billion USD with 20 billion USD corresponding to the combined
market in Europe [1]. By 2021, the dry pet food market in Europe is anticipated to reach over 11 billion
USD [2]. In 2017, the total pet care sales for Eastern Europe are estimated to reach 5.43 billion USD.

Animals 2018, 8, 79; doi:10.3390/ani8060079                                   www.mdpi.com/journal/animals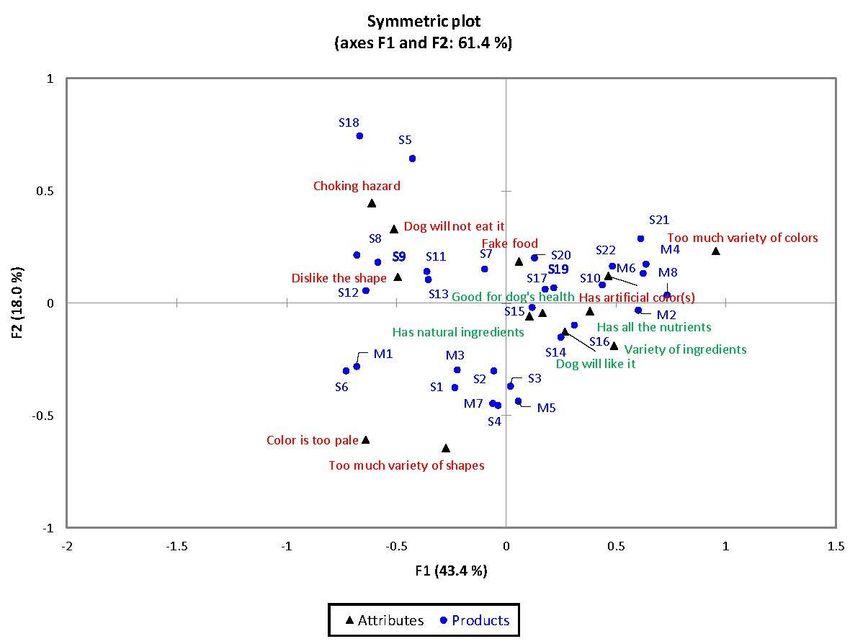
Animals 2018, 8, 79                                                                                  2 of 21

Poland represents the second largest pet food market in Eastern Europe accounting for 14.82% of the
regional market share [3]. Poland’s dog ownership is among the highest in the world. Approximately,
45% of Polish population lives with dogs [4] for an estimated total of 7.8 million dogs living in Polish
households [5]. The pet food market in Poland increased 9% in 2014 and represented an estimated
total of 639 million USD in 2015 [5]. Poland was ranked the eighth highest dry dog food producing
country in the world in 2015 with 584,000 metric tons [1].
      In the pet food industry, the development of successful products depends on a wide variety of
factors. As with human foods, the development of new products in this sector must consider both the
nutritional and the sensory aspects of the product. From the sensory perspective, the use of sensory
analysis methods is key to gain understanding of pet and owner behavior and to provide manufacturers
and researchers the means to study pet food selection. Nevertheless, research publications regarding
the sensory characteristics of pet food products are relatively new, as much of the work conducted
previously seems to be proprietary. As described by Koppel [6], the use of sensory evaluation
methods to study pet foods can be accomplished using humans, animals and instruments. Most of
the published work on sensory analysis of pet foods using humans has focused on using descriptive
sensory analysis methods to study the characteristics of the products. Di Donfrancesco et al. [7]
developed a lexicon to describe the appearance, aroma, flavor and texture characteristics of dry dog
food products using a trained human sensory panel. Koppel et al. [8] studied the effect of fiber
inclusion on the sensory characteristics and palatability of dry dog food products. In addition to dry
dog food, Pickering conducted studies to describe the flavor and texture characteristics of dry and
wet cat foods using a human sensory panel [9,10]. Some studies have been published on studying
the pet owners’ response to pet food products. Tengpongsathon and Phaosathienpan [11] studied the
importance of brand, price, type of food and nutrition on the consumers’ preferences for pet foods in
Thailand. Several works have been published on studying the attitudes of pet owners towards pet
food. Boya et al. [12] studied how the choice of dog food varies across different dog owners’ segments
and the similarity between the dog owner’s criteria at the time of purchasing food for themselves
vs. the criteria used when purchasing dog food. Michel et al. [13] investigated feeding practices and
attitudes dog and cat owners have towards pet foods and diets they use for feeding their companion
animals. Tesfom and Birch [14] studied similarities in the way dog owners buy food for their dogs vs.
food for themselves.
      As pet owners, humans make decisions at the time of purchasing pet food products. It is common
for dog food manufacturers to try to develop foods that satisfy the owners’ requirements as much as
they do with the pet requirements. From a sensory point of view, the product’s success depends on
the companion animal accepting the product as palatable. In addition, the pet owner’s perception
of the product is of great importance since the owner makes the purchase decision. From a sensory
perspective, the interaction dog owners have with dog food is usually through the senses of sight and
smell. Di Donfrancesco et al. [15] studied the overall acceptability, aroma acceptability and appearance
acceptability of dry dog food products by consumers in the United States. The results showed that
the appearance is more important than the aroma in driving the consumers’ liking of dry dog food
products. A wide variety of colors, geometric shapes, sizes and kibble mixtures can be found in the
dry dog food market. Companies strive to catch the customers’ attention by developing products with
innovative visual characteristics to make their products stand out over the competition. Given the
results by Di Donfrancesco et al. [15], further study is necessary to gain a deeper understanding on
what kind of visual characteristics are preferred by consumers and what are some of the factors driving
appearance liking by consumers in dry fog food products. Koppel et al. [16] studied this subject for
consumers in Thailand and found that Thai consumers liked kibbles with a bone shape and yellowish
color best.
      To address the study of consumer response to the appearance of dry dog food products, the present
work aimed: (1) to understand the impact of visual characteristics of dry dog food on human
consumers’ acceptance and beliefs; (2) to identify potential differences in the preferred visual attributes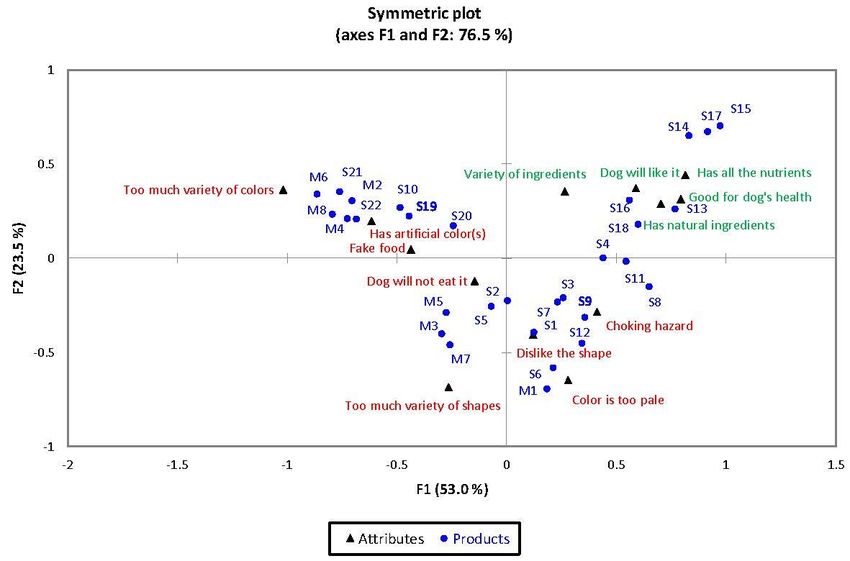
Animals 2018, 8, 79                                                                               3 of 21

by consumer segments in Poland based on their acceptance of the appearance of dry dog foods;
(3) to gain a deeper understanding of the impact of different visual characteristics on the overall
acceptability by the consumers; and (4) to study the association between the visual characteristics and
the beliefs consumers link to dry dog foods.

2. Materials and Methods

2.1. Samples
     Dry dog food samples (n = 30) of kibbles from commercially available dry dog foods were used.
The samples were prepared by selecting specific kibbles from a wide list of commercial products to
use them as a single-kibble sample or by mixing different kibbles to create multiple-kibble samples.
The samples were chosen to represent a wide variety of visual characteristics in terms of colors, sizes,
shapes and number of kibbles present in the samples (Table 1). To classify the size of the kibbles,
a relative size scoring method was used ranging from a relative size score of 1 (extra-small size) to
7 (extra-large size). Kibbles with similar colors were grouped together into general color categories
to facilitate the analysis of the data. The shape of the samples is described as an approximation to
common 3D shapes. All the commercial products were purchased in local pet stores/grocery stores in
the Manhattan, Kansas, US, prior to the test and after selection and preparation were stored under
frozen conditions until the day of testing. All the products were evaluated within the “best by” date
and no recalled products were used.

2.2. Participants
    The participants were screened to be: (1) 18 years of age or above; (2) dog owners; (3) to use dry
dog food to feed their dog(s); (4) to be responsible for purchasing the dog food or to participate in
making the purchase decision on which food is fed to the dog(s); and (5) not to have been diagnosed
with color vision deficiencies previously. A total of 120 participants were recruited and participated
voluntarily in the study. The demographics of the participants are shown in Table 2.
Animals 2018, 8, 79 4 of 21
Table 1. Description of the samples (n = 30) used and their visual characteristics.
Number of Relative Size(s)
Sample Sample Type Color(s) Shape(s)
Kibbles Present Score (1–7)
S1 Single-kibble 1 Bright gold 5 Bones
S2 Single-kibble 1 Bright gold 6 Clovers
S3 Single-kibble 1 Golden brown 6 Cylindrical ‘X’
S4 Single-kibble 1 Golden brown 4 Rounded cuboids
S5 Single-kibble 1 Amber brown 7 Sticks
S6 Single-kibble 1 Light brown 5 Discs
S7 Single-kibble 1 Shades of brown (from bright gold to medium brown) 7 Cylinders
S8 Single-kibble 1 Golden brown 2 Cuboids
S9 Single-kibble 1 Medium brown 4 Flat triangular prisms with center hole
S10 Single-kibble 1 Amber brown 4 Puffs (irregular)
S11 Single-kibble 1 Medium brown 3 Flat ‘X’
S12 Single-kibble 1 Medium brown 3 Flat cuboids with center hole
S13 Single-kibble 1 Medium brown 3 Flat cylinders
S14 Single-kibble 1 Medium brown 5 Rounded triangular prisms
S15 Single-kibble 1 Medium brown 4 Flat triangular prisms
S16 Single-kibble 1 Medium brown 6 Rack of ribs
S17 Single-kibble 1 Dark brown 5 Semi-flat cuboids
S18 Single-kibble 1 Extra-dark brown 1 Spheres
S19 Single-kibble 1 Medium green 3 Puffs
S20 Single-kibble 1 Dark green 6 Flat elongated cuboids with rounded corners
S21 Single-kibble 1 Red 3 Rounded cuboids
S22 Single-kibble 1 Red meat and white fat, marbled 6 Steaks
M1 Multiple-kibble 2 Light brown, Medium brown 4, 5 Discs, flat triangular prisms with center hole
M2 Multiple-kibble 2 Golden brown, Red 3, 4 Rounded cuboids
M3 Multiple-kibble 3 Light brown, Medium green, Medium brown 3, 4, 5 Discs, flat triangular prisms with center hole, puffs
M4 Multiple-kibble 3 Golden brown, Dark brown, Red 2, 3, 4 Rounded cuboids, flat cylinders
Discs, flat triangular prisms with center hole, puffs, flat triangular
M5 Multiple-kibble 4 Light brown, Medium green, Medium brown 3, 4, 5
prisms
M6 Multiple-kibble 4 Golden brown, Dark brown, Medium green, Red 2, 3, 4 Rounded cuboids, flat cylinders, puffs
Clovers, discs, cylindrical ‘X’, flat triangular prisms, flat triangular
M7 Multiple-kibble 5 Golden brown, Bright gold, Light brown, Medium brown 4, 5, 6
prisms with center hole
M8 Multiple-kibble 5 Bright gold, Golden brown, Dark brown, Medium green, Red 2, 3, 4, 5 Rounded cuboids, flat cylinders, puffs, rounded triangular prisms
A relative size scoring method ranging from 1 (smallest size) to 7 (largest size) was used to classify the size of the kibbles as follows: 1 = extra-small; 2 = small; 3 = small-to-medium;
4 = medium; 5 = medium-to-large; 6 = large; 7 = extra-large. All relative sizes were assigned based on the largest dimension for each of the kibbles, regardless of the shape.Animals 2018, 8, 79 5 of 21
Table 2. Summary of the demographics of the participants in the consumer study (%).
Male Female
Gender
40.8% 59.2%
18–34 35 or above
Age (years)
41.7% 58.3%
1 2 3 4 5 or more
Number of dogs owned
64.2% 22.5% 6.7% 3.3% 3.3%
Size of dog(s) (can choose more than Very small (0.5–5 kg) Small (5.1–11.0 kg) Medium (11.1–20.0 kg) Large (20.1–40.0 kg) Very large (more than 40 kg)
one answer if more than one dog) 5.8% 33.3% 36.7% 39.2% 9.2%
Money spent on each dog per Less than $15 $15–$50 More than $50
month (USD) 13.3% 68.3% 18.3%
Knowledgeable about pet food and Yes No
pet’s health 54.2% 45.8%
Important factor(s) considered when Improve dog’s Appearance of Dog(s) need(s) that food
Brand Price Dog(s) like(s) that food Ingredients/Raw materials
choosing dog food (can choose up to health in general the product because of a health condition
three answers) 30.8% 30.0% 50.8% 10.0% 70.8% 75.0% 6.7%
Clinic/Veterinary Small market Supermarkets/Convenience
Purchasing location Online Pet shops/Pet stores Market fairs
hospitals in living area stores
(check-all-that-apply)
54.2% 15.0% 10.0% 30.0% 44.2% 5.0%Animals 2018, 8, 79 6 of 21
2.3. Consumer Study
Consumer testing was performed in compliance with the Kansas State University (KSU)
Institutional Review Board #7710. A Central Location Test (CLT) was conducted at Warsaw University
of Life Sciences (Warsaw, Poland). Participants were recruited from the metropolitan area of Warsaw
via e-mail, phone, social media, flyers, and word-of-mouth. Test sessions were conducted using a
classroom setting and lasted 45 min. The number of participants at each session ranged from 1 to 14.
The consumers did not receive an incentive for participating in the study.
The samples were presented monadically to the consumers using a randomized Latin square
design [17]. Samples were presented in white 8-oz cups Styrofoam®® containers covered with lids and
labeled with three-digit codes.
2.4. Questionnaires
Each consumer was presented with one demographic questionnaire and 30 sets of dog food
questionnaires. The participants completed the demographic questionnaire prior to sample evaluation.
Next, consumers were asked to visually inspect each of the samples presented and to answer one set of
the dog food questionnaires for each of the products. The participants were asked to rate the Overall
Liking, Size Liking, Shape Liking and Color Liking for each of the samples using a 9-point hedonic
scale (ranging from 1 = “dislike extremely” to 9 = “like extremely”, 5 = “neither like nor dislike”).
After the hedonic questions, participants were presented with a list of thirteen positive and negative
functional terms in a check-all-that-apply question and asked to select all those they associated with
each of the samples. The following 5 positive and 8 negative terms were used:
• Positive terms: “Has natural ingredients/raw materials”, “Good for dog’s health”, “My dog
will like it”, “Has variety of ingredients/raw materials”, and “Has all the nutrients that my
dog(s) needs”.
• Negative terms: “Looks like fake food”, “Color is too pale”, “Consumption may cause choking
hazard”, “My dog will not eat it”, “I don’t like the shape of this sample”, “Has artificial color(s)”,
“Has too much variety of shapes”, and “Has too much variety of colors”.
The terms were selected based on previous work conducted and expertise on the topic.
2.5. Data Analysis
2.5.1. Cluster Analysis
To group consumers with similar liking patterns given the set of samples, cluster analysis was
performed using Agglomerative Hierarchical Clustering (AHC) method and Ward’s agglomeration
method on the Overall Liking scores. Demographics were calculated for each resulting cluster.
2.5.2. Analysis of Variance
Two-way Analysis of Variance (ANOVA) was performed to model each of the four acceptance
attributes Overall Liking, Size Liking, Shape Liking and Color Liking (dependent variable) as a function
of Sample and Consumer (explanatory variables) using a 95% level of significance. Tukey’s Honest
Significant Difference (HSD) pairwise comparison tests were performed for the ANOVA models using
Sample as factor for pairwise comparisons to determine significant differences among samples for
each acceptance attribute. The Analysis of Variance models for each of the four hedonic attributes
were performed: (1) across all 120 consumers; and (2) for each of the consumer clusters.
2.5.3. Correspondence Analysis
To analyze the results from the check-all-that-apply (CATA) question, a contingency table was
constructed by summarizing the times a term was checked by the consumers for each of the thirtyAnimals 2018, 8, 79 7 of 21
samples and for each of the Overall Liking clusters. Chi-square distance was used to test the
independence between samples and terms using a level of significance α = 0.05. Correspondence
Analysis was used to study the association between samples and attributes and to display the results
in two-dimensional maps.
All statistical analyses were performed using XLSTAT Version 2015.3.01 (Addinsoft, New York,
NY, USA).
3. Results
3.1. ANOVA of Overall Liking Scores
There was evidence of a significant effect by the two explanatory variables (sample and consumer)
on the Overall Liking, Size Liking, Shape Liking, and Color Liking mean scores for all the participants
and for each of the consumer clusters (Table 3). The results from the Type III SS indicate a significant
effect of the sample on the average score for Overall Liking, Size Liking, Shape Liking, and Color
Liking in all cases (Table 4).
Table 3. Summary of the two-way ANOVA tests for all the participants and for each of the three
consumer clusters. Overall Liking, Size Liking, Shape Liking and Color Liking as dependent variables.
Sample and Consumer as explanatory variables. A level of significance α = 0.05 was used.
Dependent Variable
Parameter Consumers
Overall Liking Size Liking Shape Liking Color Liking
All participants 0.314 0.351 0.367 0.324
Cluster 1 0.214 0.235 0.306 0.300
R2 Cluster 2 0.270 0.315 0.272 0.240
Cluster 3 0.313 0.359 0.400 0.415
All participants 10.652 12.606 13.512 11.179
Cluster 1 2.578 2.907 4.156 4.048
F
Cluster 2 6.157 7.650 6.212 5.264
Cluster 3 9.079 11.186 13.285 14.184
All participantsAnimals 2018, 8, 79 8 of 21
medium kibble sizes, low-dimensional contrast kibbles and traditional kibble shapes such as triangular
prisms (S14, mean score = 6.3; S15, mean score = 6.3), cuboids (S4, mean score = 5.6) and flat
cylinders (S13, mean score = 5.4); (2) single-kibble samples with colors in the shades of brown color
category (bright gold, golden brown, medium brown), large kibble sizes, low-dimensional contrast
kibbles and innovative kibble shapes such as the bones (S1, mean score = 5.4), the cylindrical ‘X’
(S3, mean score = 5.6) and the rack of ribs (S16, mean score = 5.9). According to the Tukey’s HSD test,
all these scores were found not to be significantly different to each other at the 95% confidence level.
Consumers overall rated lowest for Overall Liking: (1) single-kibble samples with colors in the
shades of brown color category (amber brown, light brown), kibble sizes ranging from medium-to-large
to extra-large, and a high-dimensional contrast kibble shape such as the sticks (S5, mean score = 3.7) and
the discs (S6, mean score = 3.8); (2) a single-kibble sample of extra-dark brown color, a low-dimensional
contrast kibble shape (spheres) and an extra-small kibble size (S18, mean score = 3.8); (3) a single-kibble
sample of medium brown color with holes present in the center of the kibbles (S12, mean score = 4.1);
(4) single-kibble samples of green colors (S19, mean score = 4.0; S20, mean score = 3.9); (5) a single-kibble
sample of red color (S21, mean score = 3.8); and (6) multiple-kibble samples containing kibbles with
some of the previous characteristics - the high-dimensional contrast discs and kibbles with holes
present in the center (M1, mean score = 4.2; M3, mean score = 3.8). According to the post-hoc test,
all these scores were found not to be significantly different to each other at the 95% confidence level
(Table A1a).
3.1.2. Size Liking
A high degree of discrimination was found among the consumers for size liking (Table A1a).
The average scores presented a range of 3.3 in the hedonic scale (minimum mean score = 3.1; maximum
mean score = 6.4). Samples rated highest include single-kibble samples of: (1) medium size
(S4, mean score = 5.8; S15, mean score = 6.0); (2) medium-to-large size (S14, mean score = 6.4;
S17, mean score = 5.8); and (3) large size (S2, mean score = 5.7; S3, mean score = 6.2;
S16, mean score = 6.0).
The consumers overall rated lowest for Size Liking single-kibble samples of: (1) extra-small
size (S18, mean score = 3.1); (2) small size (S8, mean score = 3.3); (3) small-to-medium size
(S11, mean score = 4.3; S12, mean score = 4.0; S13, mean score = 4.3); and (4) extra-large size
(S5, mean score = 3.3; S7, mean score = 4.3). Significant differences were found among these scores
according to the post-hoc test, with the score of sample S18 being not significantly different than the
scores of samples S5 and S8 only.
3.1.3. Shape Liking
A moderate degree of discrimination was found among the sample set (Table A1a).
The mean scores presented a range of 3.3 in the hedonic scale (minimum mean score = 3.2;
maximum mean score = 6.5). Samples rated highest overall for Shape Liking included: (1) single-kibble
samples of low-dimensional contrast kibbles and traditional shapes such as triangular prisms
(S14, mean score = 6.5; S15, mean score = 6.3), cuboids (S4, mean score = 6.2; S17, mean score = 5.9),
flat cylinders (S13, mean score = 5.8) and puffs (S19, mean score = 5.7); (2) single-kibble samples
with an innovative kibble shape such as the cylindrical ‘X’ (S3, mean score = 5.8) and the rack of
ribs (S16, mean score = 5.8); and (3) multiple-kibble samples containing kibbles with low-dimensional
contrast and traditional kibble shapes such as cuboids (M2, mean score = 5.9) and a mixture of cuboids,
flat cylinders and puffs (M6, mean score = 5.6).
Samples rated lowest for Shape Liking overall included: (1) single-kibble samples with a
high-dimensional contrast kibble shape such as the sticks (S5, mean score = 3.2) and the discs
(S6, mean score = 3.8); (2) single-kibble samples with holes present in the center of the kibbles
(S9, mean score = 4.1; S12, mean score = 4.1); and (3) multiple-kibble samples containing kibblesAnimals 2018, 8, 79 9 of 21
with high-dimensional contrast (discs) and holes present in the center (M1, mean score = 3.8;
M3, mean score = 3.9).
3.1.4. Color Liking
For Color Liking, a high degree of discrimination was found among the set of samples (Table A1a).
The average scores presented a range of 3.2 in the hedonic scale (minimum mean score = 3.4;
maximum mean score = 6.6). Samples rated highest by consumers overall include single-kibble
samples of medium brown colors (S11, mean score = 6.0; S13, mean score = 5.6; S14, mean score = 6.2;
S15, mean score = 6.6; S16, mean score = 5.9). According to the Tukey’s HSD test, only the score of
sample S13 was found to be significantly lower to the score of sample S15 at the 95% confidence level.
Samples rated lowest for Color Liking by consumers overall included: (1) a single-kibble sample
of red color (S21, mean score = 3.4); (2) single-kibble samples of green colors (S19, mean score = 3.5;
S20, mean score = 3.5); (3) a single-kibble sample of light brown color (S6, mean score = 3.6);
(4) multiple-kibble samples with a high-color contrast containing kibbles of red, green and shades of
brown colors (M6, mean score = 3.8; M8, mean score = 3.9); and (5) a multiple-kibble sample containing
kibbles with two of the previous characteristics—light brown and green colors (M3, mean score = 3.7).
3.2. Analysis by Consumer Clusters
3.2.1. AHC Analysis
Three consumer clusters were obtained with the following distribution of participants as shown in
Table A1b,c,d. Cluster 1 had the smallest number of consumers with only 12.5% of the participants (15),
cluster 2 represented 33.3% of the consumers (40) and cluster 3 included the highest number of
assessors with 54.2% (65). The demographics of the consumer clusters are shown in Table 5.
Table 5. Summary of demographics from the overall liking clusters (percentage of consumers).
Cluster Number Male Female
Cluster 1 20.0% 80.0%
Gender
Cluster 2 42.5% 57.5%
Cluster 3 44.6% 55.4%
Cluster Number 18–34 35 or Above
Age (years) Cluster 1 73.3% 26.7%
Cluster 2 45.0% 55.0%
Cluster 3 32.3% 67.7%
3.2.2. Cluster 1
Although significant differences were found for the Overall Liking, a low degree of discrimination
was found among the samples in cluster 1 (Table A1b). Sample S1 showed the highest average
score (mean score = 7.6), despite being not significantly different from following samples S11
(mean score = 7.5) and S14, S16 and S2 (mean score = 7.3). Sample S21 had a significantly lower
score (mean score = 5.0) than sample S1, but not significantly different from the other 28 samples.
All scores were above the neutral category (neither like nor dislike = 5.0), which shows a high level of
acceptability by consumers in cluster 1 for all 30 samples. Samples rated highest in Overall Liking are
single-kibble samples with colors in the shades of brown category (from bright gold to medium brown),
medium sizes (from small-to-medium to large), and with either traditional shapes (triangular prisms)
or more innovative shapes (bones, clovers, rack of ribs, flat ‘X’).
Consumers in cluster 1 overall rated lowest for Overall Liking single-kibble samples with a
distinctive visual characteristic from the pool of samples, such as: (1) red color (S21, mean score = 5.0);Animals 2018, 8, 79 10 of 21
(2) extra-dark brown color and extra-small size (S18, mean score = 5.5); and (3) a high-dimensional
contrast kibble shape such as the sticks (S5, mean score = 5.6) and the discs (S6, mean score = 5.6).
In terms of size, a higher degree of discrimination was found when compared to the other three
acceptance attributes. Samples S1 and S16 showed the highest score (mean score = 7.2) and were rated
significantly higher than samples S18 (mean score = 4.7) and S7 (mean score = 4.4). Samples rated
highest for Size Liking include: (1) single-kibble samples with kibble sizes in the medium-to-large range
such as medium (S15, mean score = 7.1), medium-to-large (S1, mean score = 7.2; S14, mean score = 7.1),
and large (S16, mean score = 7.2; S22, mean score = 7.1); and (2) a multiple-kibble sample containing
kibbles with sizes ranging from medium to large (M7, mean score = 7.0).
Consumers in cluster 1 rated lowest for Size Liking single-kibble samples with sizes in the two
ends of the size scale such as extra-small size (S18, mean score = 4.7), small size (S8, mean score = 4.9)
and extra-large size (S7, mean score = 4.4; S5, mean score = 5.1).
A low degree of discrimination was found among the samples. Sample S1 showed the highest
score (mean score = 8.0) and was rated significantly higher than sample S5 (mean score = 5.3) only.
Samples rated highest for Shape Liking include single-kibble samples with innovative shapes such
as bones (S1, mean score = 8.0), clovers (S2, mean score = 7.6), cylindrical ‘X’ (S3, mean score = 7.5),
steaks (S22, mean score = 7.4), and flat cuboids with center hole (S12, mean score = 7.4). Most of the
samples rated highest are in the shades of brown color category, except for the red meat and white fat
steaks (S22).
Samples rated lowest for Shape Liking by consumers in cluster 1 included: (1) single-kibble
samples with a high-dimensional contrast such as the sticks (S5, mean score = 5.3) and the discs
(S6, mean score = 6.0); and (2) single-kibble samples with a low-dimensional contrast such as the
cylinders (S7, mean score = 5.7) and the spheres (S18, mean score = 5.7).
For Color Liking, a low degree of discrimination between the samples was found among the
samples. Sample S1 showed the highest average score (mean score = 7.4) and was significantly
higher than sample S21 (mean score = 4.6) only. Samples rated highest in Color Liking are
single-kibble samples with shades of brown colors such as bright gold (S1, mean score = 7.4),
medium brown (S14, mean score = 7.2; S15, mean score = 7.1; S11, mean score = 7.1), and golden
brown (S8, mean score = 7.1).
Samples rated lowest for Color Liking in cluster 1 include: (1) single-kibble samples of red
(S21, mean score = 4.6), light brown (S6, mean score = 5.1), dark green (S20, mean score = 5.5),
and extra-dark brown (S18, mean score = 5.5) colors; and (2) a multiple-kibble sample with a high-color
contrast containing shades of brown, green and red colors (M6, mean score = 5.3).
3.2.3. Cluster 2
A high degree of discrimination was found among the samples by consumers in cluster 2
(Table A1c). Samples rated highest for Overall Liking include: (1) single-kibble samples with
innovative shapes such as the rack of ribs (S16, mean score = 6.4) and the steaks (S22, mean score = 6.4);
(2) single-kibble samples with traditional shapes such as flat triangular prisms (S15, mean score = 6.0);
and (3) multiple-kibble samples with high-color contrast and low-dimensional contrast such as M6
(mean score = 6.3), M2 (mean score = 6.1) and M8 (mean score = 6.0).
Consumers in cluster 2 rated lowest for Overall Liking: (1) single-kibble samples in the shades
of brown color category with a distinctive visual characteristic from the pool of samples such as
extra-dark color and extra-small size (S18, mean score = 2.7), a hole present in the middle of the kibble
(S9, mean score = 3.4; S12, mean score = 3.7), and a high-dimensional contrast kibble shape such as
the discs (S6, mean score = 3.8); and (2) a multiple-kibble sample containing two of the previously
mentioned characteristics (M1, mean score = 3.9).
In terms of size, a high degree of discrimination was found. Samples rated highest for Size Liking
include single-kibble samples of: (1) medium-to-large kibble size (S14, mean score = 6.4); and (2) large
sized kibbles (S3, mean score = 6.4; S16, mean score = 6.3; S22, mean score = 6.3).Animals 2018, 8, 79 11 of 21
Samples rated lowest for Size Liking by consumers in cluster 2 include single-kibble samples of:
(1) extra-small size (S18, mean score = 2.7); (2) small size (S8, mean score = 2.8); (3) small-to-medium
size (S11, mean score = 3.6; S13, mean score = 3.7; S12, mean score = 3.8); and (4) extra-large size
(S5, mean score = 3.4).
A high degree of discrimination was found among the sample set. Samples rated highest in terms
of Shape Liking include: (1) single-kibble samples with innovative shapes such as the rack of ribs
(S16, mean score = 6.5), the cylindrical ‘X’ (S3, mean score = 6.2), and the steaks (S22, mean score = 6.2);
(2) single-kibble samples with more traditional-looking shapes such as rounded triangular prisms
(S14, mean score = 6.2); and (3) multiple-kibble samples containing low-dimensional contrast kibbles
such as a mixture of rounded cuboids (M2, mean score = 6.2), and a mixture of rounded cuboids, puffs,
rounded triangular prisms, and flat cylinders (M8, mean score = 6.2).
Samples rated lowest for Shape Liking in cluster 2 include: (1) the extra-small spheres
(S18, mean score = 3.6); (2) single-kibble samples with high-dimensional contrast such as the sticks
(S5, mean score = 3.7) and the discs (S6, mean score = 4.0); (3) single-kibble samples with holes present
such as the flat cuboids with center hole (S12, mean score = 3.7) and the flat triangular prisms with
center hole (S9, mean score = 4.0); and (4) a multiple-kibble sample with high-dimensional contrast
containing discs and flat triangular prisms with center hole (M1, mean score = 3.9).
For Color Liking, a high degree of discrimination among the samples was found. Samples rated
highest include: (1) single-kibble samples with medium brown colors such as S15 (mean score = 6.1),
S16 (mean score = 6.0), S11 (mean score = 5.8) and S14 (mean score = 5.8); (2) the innovative red meat and
white fat raw steak-like kibbles (S22, mean score = 5.9); and (3) multiple-kibble samples with high-color
contrast such as combination of golden brown and red (M2, mean score = 5.8), and combination of
golden brown, dark brown and red (M4, mean score = 5.8).
Samples rated lowest for Color Liking by consumers in cluster 2 include: (1) single-kibble samples
in the shades-of-brown color category such as light brown (S6, mean score = 3.4), extra-dark brown
(S18, mean score = 3.5), medium brown (S12, mean score = 3.5; S9, mean score = 3.7), and dark
brown (S17, mean score = 3.9); (2) the single-kibble dark green sample (S20, mean score = 3.8);
and (3) a multiple-kibble sample in the shades of brown color category with low-color contrast
(M1, mean score = 3.7).
3.2.4. Cluster 3
A high degree of discrimination was found from consumers in cluster 3 (Table A1d). Samples rated
highest for Overall Liking included single-kibble samples with colors in the shades of brown category
(from golden brown to medium brown), medium sizes (from small-to-medium to medium-to-large)
and traditional-looking shapes such as triangular prisms (S14, mean score = 6.3; S15, mean score = 6.3),
flat cylinders (S13, mean score = 5.5), and rounded cuboids (S4, mean score = 5.4).
Samples rated lowest for Overall Liking in cluster 3 include: (1) single-kibble samples with
high-dimensional contrast such as the sticks (S5, mean score = 2.9); (2) single-kibble samples of
red color (S21, mean score = 2.8) and green color (S19, mean score = 3.1; S20, mean score = 3.1);
and (3) multiple-kibble samples with high-color-contrast containing green (M3, mean score = 2.9;
M5, mean score = 3.2), red (M4, mean score = 3.0), and green and red colors (M6, mean score = 3.1;
M8, mean score = 3.2).
For Size Liking, a high degree of discrimination was found from the consumers. Samples rated
highest include single-kibble samples of: (1) medium kibbles sizes (S15, mean score = 5.9;
S4, mean score = 5.7); (2) medium-to-large size (S14, mean score = 6.3; S17, mean score = 5.8);
and (3) large size (S3, mean score = 5.9).
Samples rated lowest for Size Liking in cluster 3 include single-kibble samples of: (1) extra-small
size (S18, mean score = 3.1); (2) small size (S8, mean score = 3.3); (3) small-to-medium size
(S12, mean score = 3.6); and (4) extra-large size (S5, mean score = 2.9; S7, mean score = 3.7).Animals 2018, 8, 79 12 of 21
A high degree of discrimination was found among the samples. Samples rated highest include
single-kibble samples with traditional-looking shapes such as triangular prisms (S14, mean score = 6.6;
S15, mean score = 6.2), rounded cuboids (S4, mean score = 6.3), cuboids (S17, mean score = 6.0), and flat
cylinders (S13, mean score = 5.9).
Samples rated lowest for Shape Liking in cluster 3 include: (1) single-kibble samples with
high-dimensional contrast such as the sticks (S5, mean score = 2.4) and the discs (S6, mean score = 3.1);
and (2) multiple-kibble samples with different characteristics fall in this category, all of which contain
discs and flat triangular prisms with center hole (M3, mean score = 3.0; M7, mean score = 3.1;
M1, mean score = 3.2; M5, mean score = 3.2).
For Color Liking, a high degree of discrimination was found among the sample set. Samples
rated highest include single-kibble samples with medium brown color (S15, mean score = 6.9;
S14, mean score = 6.3; S13, mean score = 5.9; S11, mean score = 5.8).
Consumers in cluster 3 rated lowest for Color Liking: (1) single-kibble samples of
red (S21, mean score = 2.3; S22, mean score = 2.7) and green (S19, mean score = 2.7) color;
and (2) multiple-kibble samples with high-color contrast where the red and/or green colors are
present (M6, mean score = 2.4; M8, mean score = 2.4; M4, mean score = 2.5).
3.2.5. Correspondence Analysis
A difference on the distribution of the functional terms consumers linked to the samples on each
cluster was found (Table 6).
Table 6. Chi-square distance tests of association between samples and terms from the CATA question
for all three clusters. A level of significance α = 0.05 was used.
Cluster No. 1 2 3
Chi-square (Observed value) 621.092 1327.974 3176.161
Chi-square (Critical value) 392.501 392.501 392.501
DF 348 348 348
p-valueAnimals 2018, 8, 79 13 of 21
S17) to which medium-to-dark brown colors, medium-to-large sizes and traditional shapes (except
Animals 2018, 8, x FOR PEER REVIEW 14 of 23
for S16) are characteristic; and (2) a high-color-contrast and low-dimensional-contrast multiple-kibble
sample (M2).with high-color contrast where the red and/or green colors are present (M6, mean score =
samples
Samples
2.4; M8, mean S6 (light
score =brown)
2.4; M4,and
mean M1 (light
score brown, medium brown) were associated with the term
= 2.5).
“Color is too pale”. As expected, samples M5 (discs, flat triangular prisms, flat triangular prisms with
3.2.5.
center Correspondence
hole, puffs) and M7 Analysis
(clovers, discs, cylindrical ‘X’, flat triangular prisms, flat triangular prisms
with center hole) were
A difference on related with theofterm
the distribution “Has tooterms
the functional muchconsumers
variety oflinked
shapes”. Samples
to the samplesS7
on(cylinders),
each
cluster was found (Table 6).
S8 (cuboids), S9 (flat triangular prisms with center hole), S11 (flat ‘X’), S12 (flat cuboids with center
hole) and S13 (flat cylinders) are associated with the terms “I don’t like the shape of this sample” and
Table 6. Chi-square distance tests of association between samples and terms from the CATA question
“My dog will not eat it”. Samples S18 (extra-small size) and S5 (extra-large size) were related with the
for all three clusters. A level of significance α = 0.05 was used.
term “Consumption may cause choking hazard”. As expected, high-color-contrast multiple-kibble
samples (M4, M6 and M8) were Cluster No. with the term
associated 1 “Has 2too much3variety of colors”. Samples
containing red kibblesChi-square
(S21, S22, (Observed
M2, M4, M6 value)
and M8)621.092 1327.974
and green 3176.161
kibbles (S19, S20, M6 and M8) were
Chi-square (Critical value) 392.501 392.501 392.501
related with the term “Has artificial color(s)”. Samples containing green (S19 and S20), red (S22) and
DF 348 348 348
amber brown (S10) were associated with the term “Looks like fake food”.
p-valueAnimals 2018, 8, 79 14 of 21
Animals 2018, 8, x FOR PEER REVIEW 15 of 23
(b) Cluster 2
(c) Cluster 3
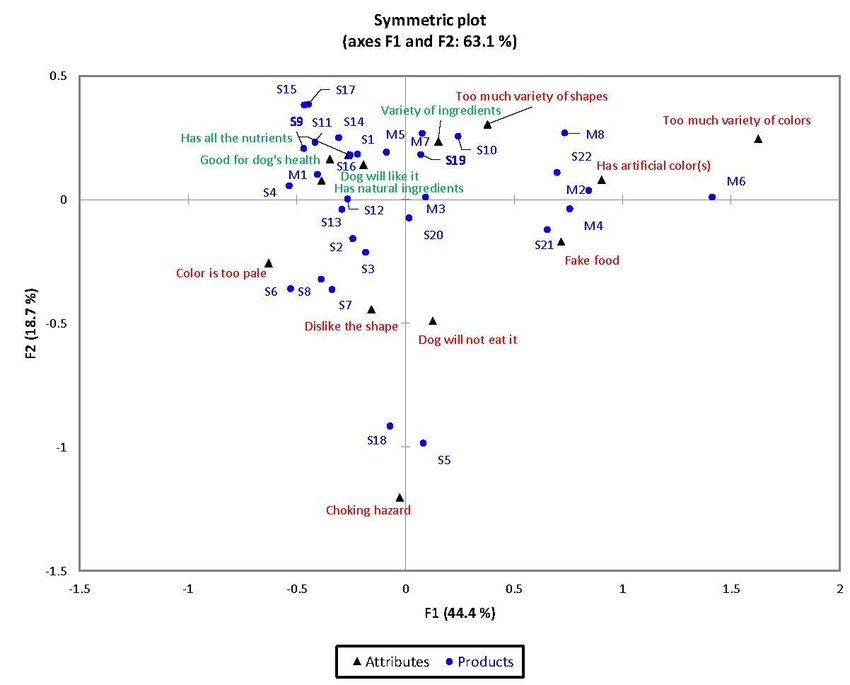
Figure 1. Correspondence Analysis maps between all thirty samples and all thirteen functional terms
Figure 1. Correspondence Analysis maps between all thirty samples and all thirteen functional terms
from the check-all-that-apply question. Positive terms shown in green; negative terms shown in red.
from the check-all-that-apply question. Positive terms shown in green; negative terms shown in red.
Samples S5 (extra-large size) and S18 (extra-small size) were associated with the term
“Consumption may
The terms “Has cause choking
artificial color(s)”hazard”. Samples
and “Looks likeS21,
fakeM2 and were
food” M4 contained redwith:
associated kibbles
(1)and were
single-kibble
samples of red (S21 and S22), green (S19 and S20) and amber brown (S10) colors; and (2) multiple-kibble
samples with high-color-contrast containing red (M2, M4, M6, and M8) and green (M6 and M8) colors.
As expected, high-color-contrast multiple-kibble samples (M2, M4, M6 and M8) were related withAnimals 2018, 8, 79 15 of 21
the term “Has too much variety of colors”. Samples S6 (light brown) and M1 (light brown, medium
brown) were associated with the term “Color is too pale”. Samples S8 (small size), S3 (large size)
and S7 (extra-large size) are related with the term “Consumption may cause choking hazard”.
The term “I don’t like the shape of this sample” was associated with: (1) samples containing
kibbles with disc shapes (S6 and M1); and (2) single-kibble samples with innovative shapes such
as holes in the center (S9, S12 and M1), bones (S1), cylindrical ‘X’ (S3) and cylinders (S7). As expected,
the three multiple-kibble samples with the highest variety in terms of shapes (M3, M5 and M7) were
related with the term “Has too much variety of shapes”. The term “My dog will not eat it” was
associated with: (1) single-kibble samples with innovative shapes such as clovers (S2) and sticks (S5);
and (2) multiple-kibble samples with a high variety of shapes (M3, M5 and M7).
4. Discussion
The results of this research showed that the acceptability of the appearance of dry dog food
by consumers is affected by the number of kibbles, color(s), shape(s), and size(s) present in the
product. These results complement the results by Di Donfrancesco et al. [15] who found that
the color of the kibbles and the size of them affect the liking of dry dog food by consumers.
The participants overall showed preference for single-kibble samples of brown colors, medium kibble
sizes, and traditional kibble shapes such as triangular prisms. It should be noted that samples
liked best overall presented a low-dimensional contrast kibble shape which is in agreement with
the results by Di Donfrancesco et al. [15] who found that samples containing kibbles with a high
uniformity of shape were liked better than samples with kibbles with a low uniformity of shape.
The consumers overall disliked kibbles of extra-small size and with the darkest brown color in the
sample set which is in accordance with the results by Di Donfrancesco et al. [15] and Koppel et al. [16].
In addition, kibbles of extra-large size were disliked by the participants overall which was reported
by Koppel et al. [16]. Also, kibbles of light brown color were disliked overall by the participants
which was previously found by Di Donfrancesco et al. [15]. In addition, the participants overall did
not rate multiple-kibble samples containing variety of colors, shapes and sizes highest. In contrast,
previous studies found that multiple-kibble samples were well received by the consumers in the US [15]
and in Thailand [16] which shows an interesting difference in the liking of the visual characteristics
of dry dog food by consumers in different countries. Furthermore, Koppel et al. [16] found that
consumers in Thailand liked best a single-kibble sample with a bone shape and received well dry
dog food with non-traditional kibble shapes which differs from the findings of the present study.
However, some similarities in the preferences of consumers towards the appearance of dry dog
food are identified across countries which provide guidelines pet food manufacturers could use as a
basis for product development targeting different markets on a global scale. Previous research has
shown the similarities/differences in the consumer perception and preferences when testing consumer
products across different countries [18–21]. This shows the importance of understanding the needs
and preferences of the target consumers on each market to achieve the development of successful
products. The results of this research and the differences found across countries in the liking of the
appearance of dry dog food evidences the importance of conducting further research on specific
markets to accomplish a successful marketing of pet foods.
As explained by Koppel [6], there are a number of factors that affect the purchase decision of dry
dog food which include price, brand, packaging, advertising claims, nutritional value and ingredients,
and specific characteristics of the product such as appearance (number of different kibbles, color(s),
shape(s), size(s)) and aroma. Also, the dog’s response to the product and the amount consumed by
the companion animal plays a key role on influencing the purchase decision, along with the health
benefits perceived by the owner and the digestive effect and characteristics of the stool. For this
reason, repurchase of a dry dog food product depends on its ability to meet the pet owners’ and the
companion animal’s needs along all the previously mentioned factors. Specific visual characteristics
of dry dog food that are perceived as satisfactory by the target population can increase the overallAnimals 2018, 8, 79 16 of 21
consumers’ degree of satisfaction with the product and improve the chance of repurchase. However,
manufacturers should strive to meet the consumers’ requirements for all the factors influencing the
purchase decision of dry dog food.
The results of the Correspondence Analysis showed that consumers associate specific visual
characteristics with positive beliefs such as “Has natural ingredients”, “Good for dog’s health”,
“Has variety of ingredients” and “Has all the nutrients that my dog(s) needs”. Likewise, the consumers
related specific visual characteristics with negative beliefs. Kumcu and Woolverton [22] found that
premium human food purchasers are more likely to purchase premium pet food for their pets.
This raises a question of whether dry dog food with visual characteristics that are well received
by the consumers and that is associated with positive beliefs is seen as being more premium quality
by the consumers. Furthermore, the same question can be made for pet food other than dry dog
food as the pet food market continues to diversify following the trend of humanization of pet foods.
This could be an interesting topic to address in further research projects. In addition, Kumcu and
Woolverton [22] found that young consumers are more likely to purchase premium pet foods despite
budget constraints. This tendency may be expected to persist and perhaps even to grow in the future
as young consumers age. As the pet food market continues to grow following the humanization trend,
consumers are demanding more specialized premium pet foods.
Samples containing red kibbles were perceived as “Looks like fake food” and “Has artificial
color(s). Genschow et al. [23] concluded in a previous study with human foods that red color functions
as a subtle stop signal that works even outside of a person’s focused awareness and may thereby
reduce incidental intake of foods and drinks. In another study, Bruno et al. [24] found that red plates
reduced the consumption of food and the use of hand cream, while the liking towards the samples
presented similar scores from all the plates. In addition, Bruno et al. also proved that their results were
neither dependent on the Michelson (luminance) contrast nor on the color contrast either, which led
them to suggest that the effect of the red color on consumption might simply be due to avoidance
associated with the color of the plate that was influencing the participants [24]. This human behavior
that has been reported previously regarding red color may not just be limited to human foods, but it
could also extend to the perception of humans towards pet foods. This could be an interesting topic
for further research on human perception of the visual characteristics of pet foods.
The present study took place in Warsaw, Poland, and Polish citizens from the metropolitan area of
Warsaw participated in the sessions. It should be pointed out that the results of this research represent
a good estimation for urban consumers in Poland but do not necessarily represent the preferences for
consumers in rural areas of Poland. However, the analysis performed using consumer clusters showed
the results from different consumer groups and enables a better representation of the variation that can
be found in the Polish market. In addition, Poland represents the second largest pet food market in
Eastern Europe [3] and the findings from this study may be of good use by manufacturers who market
their products in Eastern Europe as a basis for product development.
5. Conclusions
The degree of liking of the appearance of dry dog food samples by dog owners is influenced by the
number of different kibbles present, color(s), shape(s), and size(s) in the product. The results indicate
that dry dog food manufacturers should take special consideration with the visual characteristics
of the kibbles to satisfy the pet owners’ expectations and to enhance the acceptability of their
products. It is recommended for dry dog food manufacturers who market their products in Poland to
prioritize the production of single-kibble samples of brown colors (from golden brown to medium
brown), medium kibble sizes, and traditionally-looking kibble shapes such as triangular prisms.
Likewise, it is recommended for dry dog food companies to avoid the production of kibbles with
a high-dimensional-contrast shape such as discs and sticks, extra-small or extra-large sized kibbles,
and the use of light brown colors.Animals 2018, 8, 79 17 of 21
Author Contributions: This study was conceived and designed by K.K., E.C. and D.C. The study was executed
by K.K., D.C., D.G.B., K.H. and R.G. The data from the paper questionnaires was entered by K.H. and D.G.B.
D.G.B. analyzed the data and composed the manuscript. The manuscript was revised by K.K., E.C., and R.G.
Acknowledgments: This research was funded by the Center for Sensory Analysis and Consumer Behavior,
Kansas State University. The authors would like to thank the students from the Department of Animal Breeding
and Production, Warsaw University of Life Sciences for their help during the preparation and execution of the
consumer sessions.
Conflicts of Interest: The authors declare no conflict of interest.
Appendix A
Table A1. Summary of the Tukey’s Honest Significant Difference post-hoc comparison tests for the
ANOVA models for all the participants and for each of the three consumer clusters. Overall Liking,
Size Liking, Shape Liking and Color Liking as dependent variables. Analysis of Sample as factor for
multiple comparisons. A level of significance α = 0.05 was used. For each of the dependent variables,
samples not sharing the same letter differ significantly (on each column).
(a) All Participants
Dependent Variable
Sample
Overall Liking Size Liking Shape Liking Color Liking
(a) All participants
S14 6.3 a 6.4 a 6.5 a 6.2 ab
S15 6.3 a 6.0 abc 6.3 ab 6.6 a
S16 5.9 ab 6.0 abc 5.8 abc 5.9 abcd
S3 5.6 abcd 6.2 ab 5.8 abc 5.1 cdef
S4 5.6 abc 5.8 abcd 6.2 ab 5.0 cdefg
S17 5.2 bcdefgh 5.8 abcd 5.9 abc 5.0 defgh
S1 5.4 abcdef 5.7 abcdef 5.6 bc 4.8 efghi
S13 5.4 abcde 4.3 ij 5.8 abc 5.6 bcde
M2 4.7 cdefghij 5.6 abcdef 5.9 abc 4.3 fghijkl
S2 5.3 bcdefg 5.7 abcde 5.1 cd 4.7 efghijk
S11 5.2 bcdefg 4.3 ij 5.2 cd 6.0 abc
S22 4.8 cdefghi 5.7 abcdef 5.4 bc 4.1 fghijkl
S7 4.7 cdefghij 4.3 hij 5.2 cd 5.1 cdef
M8 4.6 efghijk 5.6 bcdef 5.6 bc 3.9 ijkl
S10 4.4 ghijkl 5.6 abcdef 5.4 bc 4.2 fghijkl
M6 4.5 fghijkl 5.2 cdefg 5.6 abc 3.8 jkl
M4 4.5 fghijkl 5.0 defghi 5.5 bc 4.1 ghijkl
S8 4.7 defghijk 3.3 kl 5.2 cd 5.0 cdefg
M7 4.4 ghijkl 5.1 cdefgh 4.3 de 4.3 fghijkl
S19 4.0 ijkl 5.1 defghi 5.7 abc 3.5 l
S21 3.8 jkl 5.1 cdefgh 5.6 bc 3.4 l
M5 4.3 hijkl 4.8 fghij 4.1 e 4.0 hijkl
S9 4.3 hijkl 4.5 ghij 4.1 ef 4.2 fghijkl
S12 4.1 ijkl 4.0 jk 4.1 ef 4.3 fghijkl
M1 4.2 ijkl 4.5 ghij 3.8 ef 4.2 fghijkl
S18 3.8 jkl 3.1 l 4.3 de 4.8 efghij
S20 3.9 ijkl 4.9 efghij 4.4 de 3.5 l
M3 3.8 jkl 4.6 ghij 3.9 ef 3.7 kl
S5 3.7 l 3.3 kl 3.2 f 4.3 fghijkl
S6 3.8 kl 4.6 ghij 3.8 ef 3.6 l
p-valueAnimals 2018, 8, 79 18 of 21
Table A1. Cont.
Dependent Variable
Sample
Overall Liking Size Liking Shape Liking Color Liking
(b) Cluster 1
S1 7.6 a 7.2 a 8.0 a 7.4 a
S14 7.3 ab 7.1 ab 7.1 ab 7.2 ab
S15 7.1 ab 7.1 ab 7.2 ab 7.1 ab
S16 7.3 ab 7.2 a 7.2 ab 6.6 ab
S2 7.3 ab 6.8 abc 7.6 ab 6.3 ab
S11 7.5 ab 6.3 abc 7.3 ab 7.1 ab
S3 6.8 ab 6.8 abc 7.5 ab 7.0 ab
M7 6.9 ab 7.0 ab 7.2 ab 6.3 ab
S4 7.0 ab 6.9 ab 6.9 ab 6.5 ab
M5 7.1 ab 6.8 abc 6.7 ab 7.0 ab
S17 6.9 ab 6.6 abc 7.1 ab 6.6 ab
S22 6.6 ab 7.1 ab 7.4 ab 5.8 ab
M8 7.0 ab 6.7 abc 7.1 ab 6.2 ab
S12 6.9 ab 6.5 abc 7.4 ab 6.0 ab
S10 6.6 ab 6.9 abc 6.8 ab 6.3 ab
M4 6.8 ab 6.8 abc 6.7 ab 6.3 ab
S19 6.1 ab 6.7 abc 7.0 ab 6.2 ab
S8 6.5 ab 4.9 abc 6.8 ab 7.1 ab
S13 6.8 ab 5.9 abc 6.2 ab 6.7 ab
S9 6.7 ab 6.1 abc 6.5 ab 6.5 ab
M3 6.6 ab 6.5 abc 6.7 ab 6.1 ab
M2 6.0 ab 6.6 abc 6.9 ab 6.0 ab
M1 6.7 ab 6.3 abc 6.2 ab 6.2 ab
M6 5.9 ab 6.8 abc 6.7 ab 5.3 ab
S7 6.1 ab 4.4 c 5.7 ab 6.5 ab
S20 6.1 ab 6.5 abc 6.1 ab 5.5 ab
S6 5.6 ab 6.0 abc 6.0 ab 5.1 ab
S5 5.6 ab 5.1 abc 5.3 b 5.7 ab
S21 5.0 b 5.4 abc 6.1 ab 4.6 b
S18 5.5 ab 4.7 bc 5.7 ab 5.5 ab
p-valueAnimals 2018, 8, 79 19 of 21
Table A1. Cont.
Dependent Variable
Sample
Overall Liking Size Liking Shape Liking Color Liking
S17 4.5 cdefgh 5.5 abc 5.4 abcdef 3.9 ef
S13 4.8 bcdefgh 3.7 efghi 5.4 abcdef 4.7 abcdef
S20 4.3 efgh 5.0 abcdef 4.8 bcdefgh 3.8 ef
M3 4.3 defgh 4.9 abcdefg 4.4 defgh 4.1 cdef
S8 4.2 efgh 2.8 hi 4.6 cdefgh 4.4 bcdef
S5 4.1 fghi 3.4 ghi 3.7 gh 4.9 abcdef
S9 4.0 ghi 4.2 cdefgh 4.0 efgh 3.7 ef
M1 3.9 ghi 4.6 bcdefg 3.9 fgh 3.7 ef
S6 3.8 hi 4.5 bcdefg 4.0 efgh 3.4 f
S12 3.7 hi 3.8 defghi 3.7 h 3.5 ef
S18 2.7 i 2.7 i 3.6 h 3.5 ef
p-valueAnimals 2018, 8, 79 20 of 21
References
1. Beaton, L. Global Pet Food Trends: Steady Growth to Continue. Available online: http://www.petfoodindustry.
com/articles/5643-global-pet-food-trends-steady-growth-to-continue (accessed on 22 April 2018).
2. Pet Food Market—Europe Industry Analysis, Size, Share, Growth, Trends and Forecast 2015–2021.
Available online: http://www.transparencymarketresearch.com/europe-pet-food-market.html (accessed on
22 April 2018).
3. Wall, T.; Keller, J. Infographic: Top 5 West, East European Pet Food Markets. Available online: http://www.
petfoodindustry.com/articles/6580-infographic-top-5-west-east-european-pet-food-markets (accessed on
22 April 2018).
4. Beaton, L. Diverse Pet Food Market Growth in Western, Eastern Europe. Available online: http:
//www.petfoodindustry.com/articles/6530-diverse-pet-food-market-growth-in-western-eastern-europe
(accessed on 22 April 2018).
5. Adamowski, J. Market Update: Poland’s Pet Food Market. Available online: http://www.petfoodindustry.
com/articles/5192-market-update-polands-pet-food-market (accessed on 22 April 2018).
6. Koppel, K. Sensory analysis of pet foods. J. Sci. Food Agric. 2014, 94, 2148–2153. [CrossRef] [PubMed]
7. Di Donfrancesco, B.; Koppel, K.; Chambers, E. An initial lexicon for sensory properties of dry dog food.
J. Sens. Stud. 2012, 27, 498–510. [CrossRef]
8. Koppel, K.; Monti, M.; Gibson, M.; Alavi, S.; Donfrancesco, B.D.; Carciofi, A.C. The effects of fiber inclusion
on pet food sensory characteristics and palatability. Animals 2015, 5, 110–125. [CrossRef] [PubMed]
9. Pickering, G.J. Optimizing the sensory characteristics and acceptance of canned cat food: Use of a human
taste panel. J. Anim. Physiol. Anim. Nutr. 2009, 93, 52–60. [CrossRef] [PubMed]
10. Pickering, G.J. Optimisation of dried cat food using a human taste panel: Methodology and characterisation
of flavour. Food Aust. 2009, 61, 30–36.
11. Tengpongsathon, K.; Phaosathienpan, S. Application of analytical hierarchy process for consumer preference
on pet food product in Thailand. In Proceedings of the International Symposium on Technology for
Sustainability, Bangkok, Thailand, 21–24 November 2012; pp. 313–316.
12. Boya, U.O.; Dotson, M.J.; Hyatt, E.M. A comparison of dog food choice criteria across dog owner segments:
An exploratory study. Int. J. Cons. Stud. 2015, 39, 74–82. [CrossRef]
13. Michel, K.E.; Willoughby, K.N.; Abood, S.K.; Fascetti, A.J.; Fleeman, L.M.; Freeman, L.M.; Laflamme, D.P.;
Bauer, C.; Kemp, B.L.E.; Doren, J.R.V. Attitudes of pet owners toward pet foods and feeding management of
cats and dogs. J. Am. Vet. Med. Assoc. 2008, 233, 1699–1703. [CrossRef] [PubMed]
14. Tesfom, G.; Birch, N. Do they buy for their dogs the way they buy for themselves? Psychol. Mark. 2010,
27, 898–912. [CrossRef]
15. Di Donfrancesco, B.; Koppel, K.; Swaney-Stueve, M.; Chambers, E. Consumer acceptance of dry dog food
variations. Animals 2014, 4, 313–330. [CrossRef] [PubMed]
16. Koppel, K.; Suwonsichon, S.; Chambers, D.; Chambers, E. Determination of intrinsic appearance properties
that drive dry dog food acceptance by pet owners in Thailand. J. Food Prod. Mark. 2017, 1–16. [CrossRef]
17. Freeman, G.H. Complete latin squares and related experimental designs. J. R. Stat. Soc. 1979, 41, 253–262.
18. Cardinal, P.; Zamora, M.C.; Chambers, E.; Carbonell Barrachina, Á.; Hough, G. Convenience sampling for
acceptability and CATA measurements may provide inaccurate results: A case study with fruit-flavored
powdered beverages tested in Argentina, Spain and U.S.A. J. Sens. Stud. 2015, 30, 295–304. [CrossRef]
19. Koppel, K.; Chambers, E.; Vázquez-Araújo, L.; Timberg, L.; Carbonell-Barrachina, Á.A.; Suwonsichon, S.
Cross-country comparison of pomegranate juice acceptance in Estonia, Spain, Thailand, and United States.
Food Qual. Prefer. 2013, 31, 116–123. [CrossRef]
20. Lee, J.; Chambers, E., IV; Chambers, D.H.; Chun, S.S.; Oupadissakoon, C.; Johnson, D.E. Consumer acceptance
for green tea by consumers in the United States, Korea and Thailand. J. Sens. Stud. 2010, 25, 109–132.
[CrossRef]
21. Rødbotten, M.; Tomic, O.; Holtekjølen, A.K.; Grini, I.S.; Lea, P.; Granli, B.S.; Grimsby, S.; Sahlstrøm, S.
Barley bread with normal and low content of salt; sensory profile and consumer preference in five European
countries. J. Cereal Sci. 2015, 64, 176–182. [CrossRef]
22. Kumcu, A.; Woolverton, A.E. Feeding Fido: Changing consumer food preferences bring pets to the table.
J. Food Prod. Mark. 2015, 21, 213–230. [CrossRef]You can also read