Evaluation of X-ray target materials to improve CT-based measurement of fiber orientations inside CF-SMC components - DIR 2019
←
→
Page content transcription
If your browser does not render page correctly, please read the page content below
International Symposium on
 Digital Industrial Radiology and Computed Tomography – DIR2019

      Evaluation of X-ray target materials to improve
     CT-based measurement of fiber orientations inside
                  CF-SMC components

                  Jan TEUWSEN 1, Florian BITTNER 2, Jens Peter STEFFEN 3
                        1
                          Volkswagen AG, D-38436 Wolfsburg, Germany
          2
            Fraunhofer Institute for Wood Research WKI, D-30453 Hannover, Germany
                      3
                        X-RAY WorX GmbH, D-30827 Garbsen, Germany
                                       Contact e-mail: jan.teuwsen@volkswagen.de

               Abstract. Carbon fiber sheet molding compounds (CF-SMC) are increasingly used
               in automotive and aerospace industries. The accuracy of fiber orientation
               measurement depends on the quality of the computed tomography (CT) results. This
               is significantly influenced by signal and contrast obtained when imaging the low
               absorption materials. Using standard tungsten X-ray targets as available in most
               commercially available microfocus CT scanners appears to be a compromise in terms
               of contrast and flux.
                     The authors compare the X-ray spectra and imaging properties achieved using
               tungsten, copper, and silver X-ray targets. Projections and volume data sets obtained
               from scanning a CF-SMC sample component using different X-ray targets are
               compared and evaluated using common quantities like grey value distribution and
               signal-to-noise ratio. Finally, the different volumes are analyzed by using a common
               software module and fiber orientation tensors are compared.

1. Introduction

        Over the last decades, compression molded discontinuous fiber composites (DFC)
such as carbon fiber sheet molding compounds (CF-SMC) have been used extensively for
interior and exterior, structural and non-structural composite applications in automotive and
aerospace industry [1] [2]. High performance CF-SMCs, such as the materials used in this
study (see section 2.1 Materials), are characterized by a high delamination resistance, near
quasi-isotropic in-plane stiffness, high out-of-plane strength and stiffness, and low notch
sensitivity [3]. The epoxy-based CF-SMC HexMC has a very short curing time, leading to a
84 % shorter molding time and an overall process time reduction of 44 % for a large part
(monocoque tub) compared to the same part produced in a resin transfer molding (RTM)
process [4]. In comparison to the RTM process, the easy and time saving compression
molding process leads to lower costs and also reduces the final amount of parts due to the
chance of part integration (fasteners, inserts) [1]. Since CF-SMC is suitable for high volume
production at low manufacturing costs and enables molding of complex three-dimensional
(3D) geometries [1], lightweight components made of CF-SMC are used for many industry
applications like window frames [2] [3], body panels, interior trims, seats, engine bay covers
and braces [5], handles, air intakes, central tunnel claddings, inner monocoques, suspension

                                                           1
License: https://creativecommons.org/licenses/by-nd/4.0/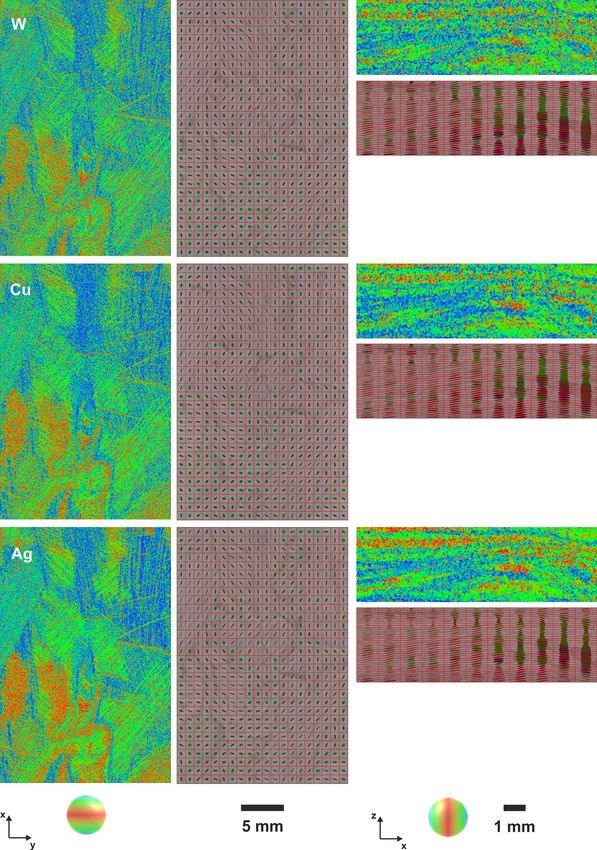
control arms, and several other cockpit parts for example in the latest Lamborghini research
and serial cars (Sesto Elemento, Veneno, Aventador, Huracán, and Urus) [3] [6] [7] [8].
        Due to the part design and the manufacturing process a characteristic microstructure
is induced in CF-SMC components. This process-induced microstructure is mainly
characterized by a locally varying fiber orientation and fiber concentration determining the
part’s mechanical properties. The DFC materials used in this study consist of thermoset resins
reinforced by transversely chopped carbon fiber tows (‘strands’, also called ‘chips’ or
‘platelets’ in literature) which are randomly distributed into a mat. The long carbon fibers are
strongly aligned in longitudinal direction of the strands. Materials with those randomly
oriented strands (ROS) are characterized by a high degree of heterogeneity (variability in
intra- and inter-part structure on the meso- and macro-scale) and seek to reach quasi-isotropic
mechanical properties [3] [9] [10]. Therefore, obtaining a realistic three-dimensional
representation of the local fiber orientations in a CF-SMC part is key for a better
understanding of the compression molding process, to be able to validate compression
molding process simulations or to map the gained fiber orientation information into a
structural mesh of an integrative (coupled) Finite Element Analysis (FEA) [11] [12]. In order
to ensure a proper component design regarding mechanical requirements and for quality
assurance of manufactured composite parts, the industry’s endeavor is to determine the
material’s microstructure for large areas or ideally for an entire part [12].
        In order to collect experimental 3D information about fiber orientation distributions
of heterogeneous fiber reinforced materials (such as CF-SMC), X-ray computed tomography
(CT) is widely used in industry due to the fact that it is easy to prepare samples and only
requires a difference in the linear X-ray attenuation coefficients of the matrix and the
reinforcement [13]. The inner structure/morphology of inhomogeneous materials like CF-
SMCs can be investigated three-dimensionally by micro-CT (µ-CT), which is a high
resolution X-ray computed tomography method, allowing an in-depth material
characterization [13].
        However, due to the lack of X-ray contrast between epoxy or vinyl ester resins and
carbon fibers, μ-CT scans are so far not useable to scan larger CF-SMC components and still
receive useful fiber orientation data. Obtaining CT data for an entire 3D part is always a
trade-off between scan volume size, possible resolution (voxel size) and the required
scanning time. Normally, attaining fiber orientations by CT scan data analysis of fiber
reinforced polymer parts requires a finer scan resolution than the fiber’s diameter, which by
implication limits the scan volume size [14].
        Useful μ-CT scans for CF-SMC parts need a sufficient resolution so that it is clearly
distinguishable between strands and resin by grey value differences enabling a fiber
orientation analysis with a common CT scan analysis software (e. g. VGStudio MAX,
Volume Graphics GmbH, Heidelberg, Germany). The analysis algorithm within VGStudio
MAX is intended to be used for the orientation analysis of discretely visible fibers [11] [15]
[16] [17] [18]. Yet with correctly set parameters and with local relative density gradients
between resin and fibers the image analysis principles are suited to be used for scans with
meso-scale resolutions where no single fibers, only coarser structures like fiber strands and
fiber bundles, respectively, are visible [12] [13]. Since microscopy shows that during
compression molding the fibers within one strand flow and orient together, deforming yet
remaining as an intact strand with locally highly aligned fibers, the density gradients of CT
scanned ROS-based materials are sufficient for a determination of local average strand
orientations even at a coarser scan resolution [11] [12] [13] [19]. In a CT scan of a ROS-
based material the smallest density gradient is present in in-strand-direction (along the
fibers), intermediate density differences are visible transverse to the strand orientation and
the highest density gradient occurs normal to the strand direction [13].

                                               2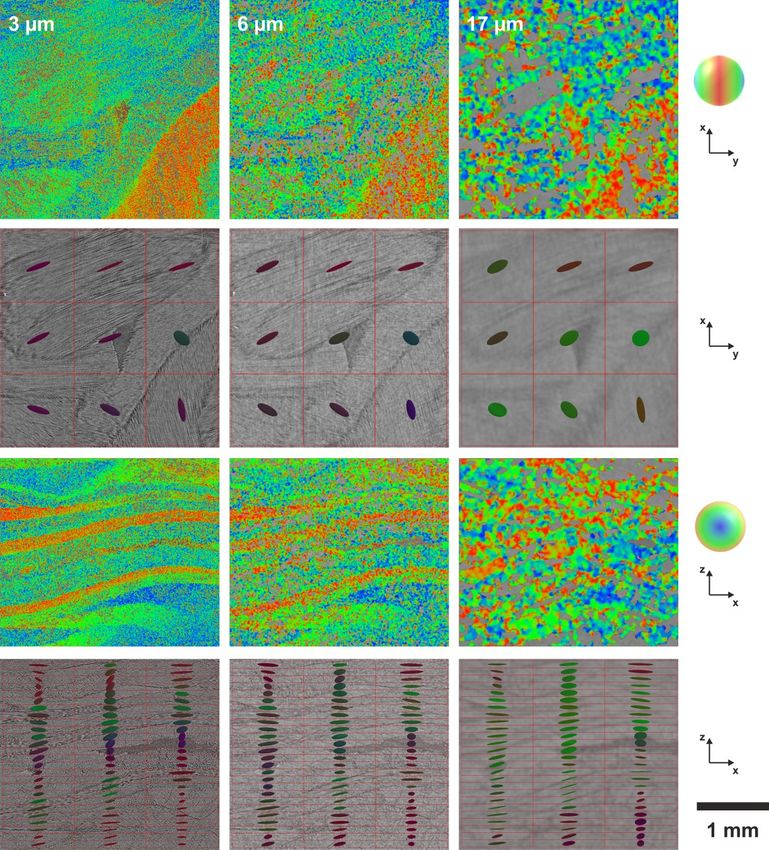
Denos uses a CT scan with a meso-scale resolution of 53 µm (voxel edge length) to
determine the heterogeneous internal microstructure of a 65 x 65 x 45 mm3 strand-based long
discontinuous fiber composite part [11] [20]. However, at that resolution and with the used
CT scan settings it is not possible to distinguish between single carbon fibers (⌀ ≈ 7 µm) and
the matrix or to discern strand boundaries (~ 100 µm thick) [11]. Although Denos’ CT scan
configuration is not able to represent distinct strand boundaries, it is still possible to receive
a mean local fiber orientation [11].
        Another common method to achieve bigger CT scan volumes at a reasonable
resolution is to merge several scan volumes generating a digital twin of the scanned part and
it’s microstructure. Kravchenko merged 8 scans with a volume of 30 x 30 x 5 mm3 each,
using a scan resolution of 15 µm [13]. At that resolution the CT scan quality is high enough
to discern between strands and suitable for reasonable fiber orientation analyses. Kravchenko
uses an analysis mesh size of 0.7 x 0.7 x 0.1 mm3, where each grid element contains about
13,000 voxels, which are used to determine a single orientation tensor from each of the
measured orientation vectors by a grey scale analysis [13]. The finer analysis resolution in
thickness direction better resolves the thin strands and enables gathering more detailed
information about the local strand orientation changes.
        The spectrum generated by the X-ray source significantly depends on the elemental
composition of the used target material. Tungsten (W) is widely used as target material for
microfocus X-ray sources. However, depending on the applied X-ray voltage and the
absorption behavior of the sample material, alternative target materials might deliver
beneficial spectrum characteristics that can improve CT measurement quality concerning the
separation capability of fiber and matrix for fiber orientation analysis. A higher μ-CT scan
quality, by means of a higher contrast between fiber and matrix, also enables to scan bigger
composite part volumes, fulfilling industry demands, where the fiber orientation within a
whole component is of interest.
        To study the effect of copper (Cu) and silver (Ag) targets in comparison to a standard
tungsten (W) target in μ-CT scans different carbon/epoxy composite samples are measured
with different voxel resolutions. Furthermore, X-ray source resolution, grey value
distribution as well as subjective image quality of the CT data are examined and comparative
fiber orientation analyses are performed.

2. Experiments

2.1 Materials

The high performance CF-SMCs examined in this study are Hexcel’s HexMC® and A.
Schulman’s Quantum AMC® 8593 HT. Both materials are designed for compression molding
of complex shaped parts in a heated metal tool. HexMC® is a DFC which consists of
unidirectional (UD) preimpregnated (prepreg) AS4/8552 carbon-epoxy tapes that are slit
longitudinally and chopped transversely into strands and then randomly distributed into a mat
[9] [10] [3]. Those ROS have nominal in-plane dimensions of 50 mm x 8 mm (2 in x 0.3 in)
and a thickness of approximately 0.15 mm containing high strength carbon fibers
impregnated by a fast curing Hexcel HexPly® M77 epoxy resin. The carbon fiber content is
62 % by weight, corresponding to 57 % fiber volume content and giving a material density
of 1.55 g/cm3.
        A. Schulman’s Quantum AMC® 8593 HT is a vinyl ester based SMC containing
chopped 25 mm long PAN based 3 K carbon fiber tows [21]. The carbon fiber weight content
is 50 %, giving a material density of 1.45 g/cm3.

                                                3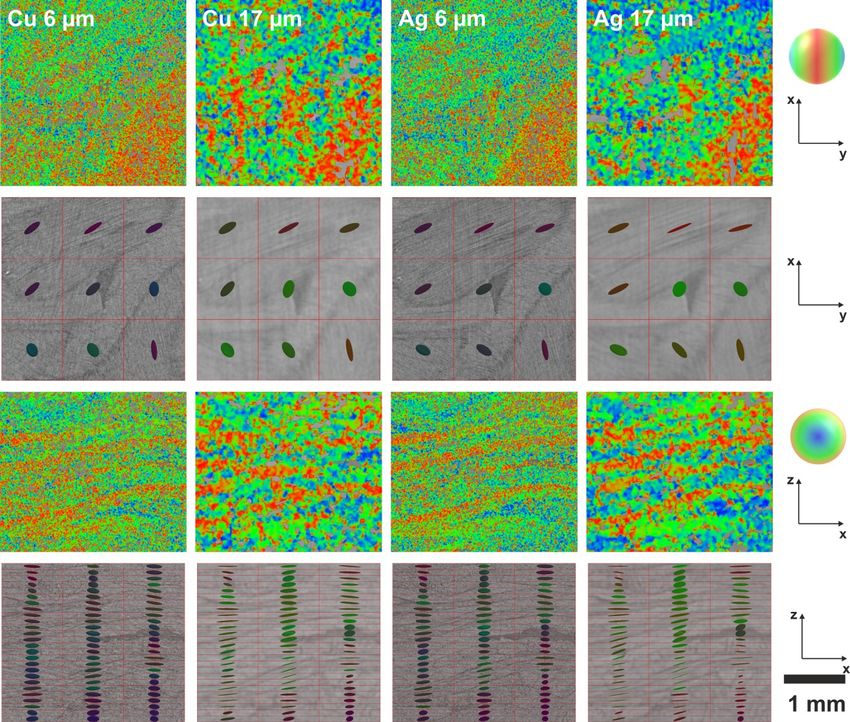
The samples analyzed in this study were cut out of plates (320 x 320 x 3.8 mm) (Fig.
1 and Fig. 2) that were manufactured with a high mold coverage of 94 % (low- to no-flow
conditions) in a 1000 ton (Dieffenbacher DCL 1000) compression molding machine at a
temperature of 135 °C, a pressure of 110 bar, a closing speed of 16 mm/s, and a closing time
of 480 s.

                                          R 12.5                                                 R 12.5

            Sample 1              Sample 3                                            Sample 2

320 mm                                               320 mm

                        320 mm                                                 320 mm

   Fig. 1. Used SMC plates (left: HexMC; right: AMC), position of the 310 x 310 mm initial raw material
 charges (dotted white boxes) and location of cut out material samples (white boxes). Colored boxes denote
                                            CT analysis regions.

 Fig. 2. Cut out material samples (colored boxes denote CT analysis regions with different scan resolutions)

2.2 Micro-CT Measurements

The CT measurements of three CF-SMC samples were performed on a CT-AlphaDuo device
(Procon X-Ray GmbH, Sarstedt, Germany) operated by the Fraunhofer WKI, Hannover,
Germany. The system is equipped with a 240 kV microfocus X-ray source XWT-240-TCHE
Plus (X-RAY WorX GmbH, Garbsen, Germany) and a PaxScan® 2530DX detector (Varian
Medical Systems, Inc., Salt Lake City, Utah, USA). While sample 1 was scanned with the

                                                     4
three selected target materials and in different resolutions, for sample 2 and 3 only the target
material was varied. The applied scan parameters are given in Tab. 1. To achieve comparable
exposures of the X-ray images for the different targets the exposure time was adjusted. To
maximize the scan resolution of the high aspect ratio samples scans at a voxel resolution of
6 and 17 µm were performed in helix mode. The scan of sample 1 at a resolution of 2.9 µm
was performed in conventional axial mode. At the same resolution identical sample volumes
were captured. For visualization and analysis of the volume data VGSTUDIO MAX 3.2
(Volume Graphics GmbH, Heidelberg, Germany) was used.

                                Tab. 1. Micro-CT measurement parameters
               Target     Voxel        X-ray     X-ray      FDD       Exposure Measuring Approx.
               material resolution    voltage   current                 time     time    I0 value
                           [µm]        [kV]      [µA]       [mm]        [ms]    [min]       [-]
                    W         2.9        50         75      1000        8 x 3000      960        30,500
                    W         6.3        65        140      600          8 x 300      135        35,000
                    Cu        6.1        65        140      600          8 x 500      225        31,500
    Sample 1
                    Ag        6.1        65        140      600          8 x 300      135        36,700
    (HexMC)
                    W        17.4        65        350      700          8 x 200       75        42,200
                    Cu       17.4        65        350      700          8 x 300      115        33,250
                    Ag       17.3        65        350      700          8 x 200       75        44,800
                    W        17.4        65        350      700          8 x 200       85        43,600
    Sample 2
                    Cu       17.4        65        350      700          8 x 400      170        44,000
     (AMC)
                    Ag       17.3        65        350      700          8 x 200       85        44,000
                    W        17.4        65        350      700          8 x 200       90        42,800
    Sample 3
                    Cu       17.4        65        350      700          8 x 400      180        45,000
    (HexMC)
                    Ag       17.4        65        350      700          8 x 200       90        43,600

2.3 JIMA Resolution Tests

To determine the effective image resolution of the selected setups, the JIMA resolution
pattern RT RC-02B [22] was imaged at the same settings that were used for the particular
CT scans. This includes target type, X-ray parameters, focus-to-detector distance (FDD),
magnification, and exposure time for the single projection. The tested parameters and
effective resolutions are listed in Tab. 2. The JIMA resolution was selected as the smallest
pattern size showing at least 10 % variation of the estimated modulation transfer function
(MTF) between the lines and spaces [23].

                     Tab. 2. JIMA resolution test parameters and determined resolution
          Target          X-ray       X-ray        FDD       Magni-        Exposure Effective
          material       voltage     current                 fication        time   resolution
                          [kV]        [µA]        [mm]                       [ms]      [µm]
               W           65          140         600         80 x         8 x 300         7
               Cu          65          140         600         80 x         8 x 500         7
               Ag          65          140         600         80 x         8 x 300         7
               W           65          350         700         95 x         8 x 200         15
               Cu          65          350         700         95 x         8 x 300         15
               Ag          65          350         700         95 x         8 x 200         15

                                                    5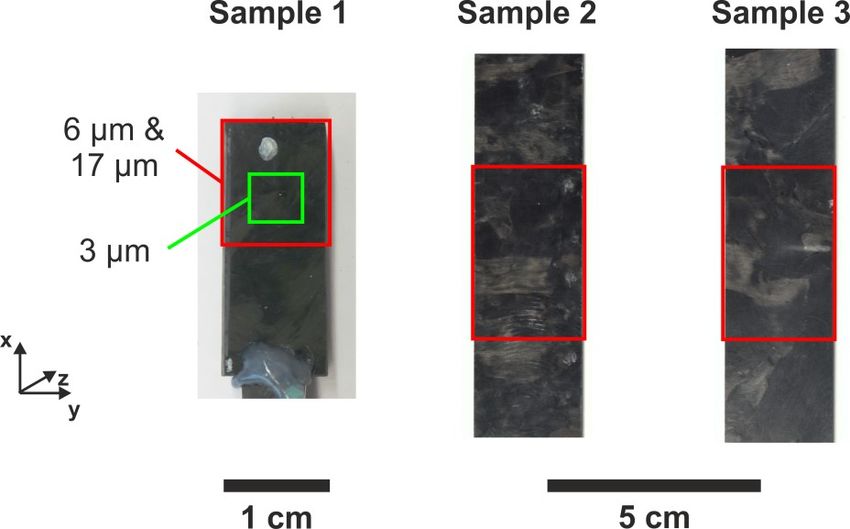
2.4 X-Ray Spectra Simulations of Different Transmission Targets

The software aRTist 2.10 published by Bundesanstalt für Materialforschung und -prüfung
(BAM, Berlin) [24] was used to simulate the X-ray spectra of the three transmission targets
applied in this study (Fig. 3). The simulation was performed for a voltage of 65 kV. At this
energy the resulting tungsten spectrum does not exhibit the characteristic K-shell emission
lines. The highest bremsstrahlung radiation in the considered energy range is delivered by
the silver target which also gives the most significant contribution of the K-shell emission
lines at 22 and 25 keV.

               Fig. 3. Simulated spectra of tungsten target, copper target, and silver target

3. Results and Discussion

        To investigate whether the different target materials have an effect on the ability to
differentiate fiber and matrix, sample 1 was scanned with different voxel resolutions and
fiber orientation analyses were applied to the same sample region. The fiber orientation
tensors obtained from the scan with the W target at the highest resolution (2.9 µm) serve as
reference for the other scan parameters. Samples 2 and 3 with slightly different compositions
have larger sample dimensions than sample 1 and serve as demonstrators for application-
orientated case studies.
        In contrast to the standard W target a grey value analysis of the reconstructed volume
data (Tab. 3) generally shows a shift of the grey values towards higher values by usage of
Cu and Ag as target materials. Although the relative distance between the fiber and the matrix
signals does not change significantly, the wider spreading of the grey value spectrum should
principally improve the ability to separate fiber and matrix for fiber orientation
measurements. For copper the higher grey values in exchange require higher measuring times
due to the lower X-ray intensity.
        JIMA resolution tests (cf. Tab. 2) have verified the resolution of the X-ray source for
the different target materials and X-ray parameters. With 7 and 15 µm, respectively, it is
comparable to the nominal voxel size of the CT scans. No difference in JIMA resolution is
noticeable for the different target materials.

                                                     6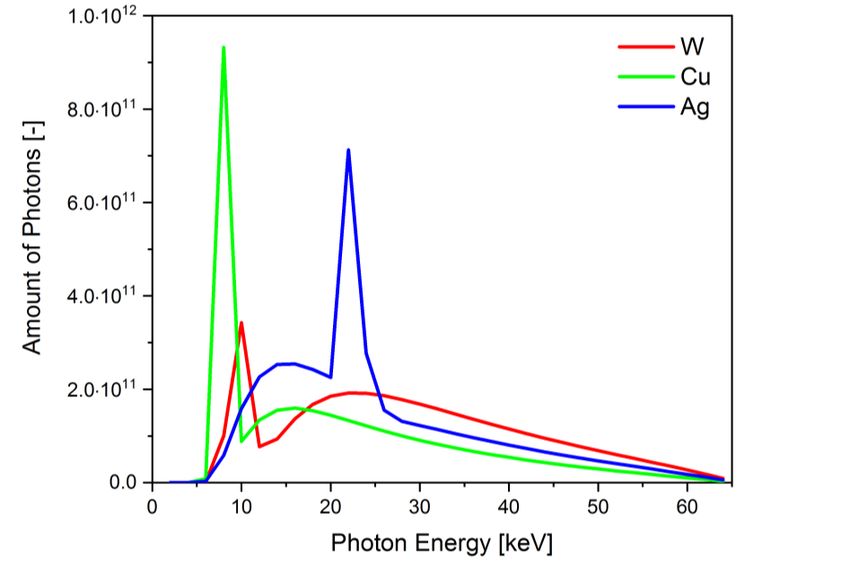
Tab. 3. Grey value distribution in dependence on target material
      Sample    Target       Voxel    Avg. grey value Avg. grey value   Relative difference
                material   resolution     matrix           fiber      grey value fiber/matrix
                              [µm]                                             [%]
                   W           2.9           1127              1570                   28.2
                   W           6.3           1446              1737                   16.8
                   Cu          6.1           2489              2916                   14.6
     Sample 1
                   Ag          6.1           2229              2644                   15.7
     (HexMC)
                   W          17.4           1308              1527                   14.3
                   Cu         17.4           1350              1520                   11.2
                   Ag         17.3           3366              3866                   12.9
                   W          17.4           7160              8003                   10.5
     Sample 2
                   Cu         17.4           8460              9564                   11.5
      (AMC)
                   Ag         17.3           7790              8943                   12.9
                   W          17.4           2987              3376                   11.5
     Sample 3
                   Cu         17.4           3600              4039                   10.9
     (HexMC)
                   Ag         17.4           3352              3845                   12.8

        The general effect of voxel resolution on detectable details is visible in Fig. 4, where
sectional images at the same positions of sample 1 are compared for voxel sizes of 3, 6 and
17 µm. With a voxel resolution of 3 µm individual carbon fibers can be detected. The fiber
orientation is clearly recognizable. This detail detectability at a voxel resolution of 3 µm
gives reason to expect a plausible representation of the real fiber orientations of the sample,
when a fiber orientation analysis is performed on these data.
        When a voxel resolution of 6 µm is applied, individual carbon fibers are still visible,
but the discrimination of fibers inside the strands deteriorates. For a resolution of 17 µm no
single fibers are recognizable. The structure and orientation of the strands and their layered
structure is still visible.
        While the grey value gradients, which are detectable in a scan with a voxel size of 6
or 17 µm allow the execution of a fiber orientation analysis for this type of material, the loss
of details unquestionably implicates an increased inaccuracy of the results. An evaluation of
the accuracy of the obtained orientation vectors, that is required for the conduction of
structural mechanics simulation, is out of the scope of this work. Therefore only a qualitative
comparison of detail detectability and obtained fiber orientations in dependence on the target
material is conducted.
        Fig. 5 to Fig. 8 compare sectional images of the different samples and voxel
resolutions for the different target materials. Only slight differences in the image quality are
observable. The scans of sample 1 acquired with the Ag target (Fig. 5 and Fig. 6) appear to
feature less noise than the scans with the W and Cu target. This is most notably in the areas
occupied by matrix, which should be a homogeneous area without structures. While the noise
level in all measurements of sample 2 and 3 (Fig. 7 and Fig. 8) appears comparable, the edge
contrast between strands and resin appears more distinct for the Cu and Ag target than for
the W target. Both a lower noise level and a higher contrast between fiber and matrix would
be beneficial for fiber orientation analyses.

                                                  7
Fig. 4. Cross-sectional CT images of sample 1 at different voxel resolutions, W target; top: in-plane view,
bottom: through-thickness view
Fig. 5. Comparison of different target materials for sample 1 at a voxel resolution of approx. 6 µm; top: in-
plane view, bottom: through-thickness view
8Fig. 6. Comparison of different target materials for sample 1 at a voxel resolution of approx. 17 µm; top: in-
plane view, bottom: through-thickness view
Fig. 7. Comparison of different target materials for sample 2 at a voxel resolution of approx. 17 µm; top: in-
plane view, bottom: through-thickness view
9Fig. 8. Comparison of different target materials for sample 3 at a voxel resolution of approx. 17 µm; top: in-
plane view, bottom: through-thickness view
Fig. 9 displays fiber orientation analyses of sample 1 based on the scans with the
standard W target. While the color-coded illustrations of the analysis results yield a direct
impression of fiber orientation, the mesh-based analysis with fiber orientation tensors per
volume element produces results suitable for transfer into structural mechanics simulation
software.
The color-coded illustration reveals a loss of precision that is caused by a lower voxel
resolution. At the highest resolution of approximately 3 µm the course of the different fiber
layers is reflected by the calculated fiber orientations. With decreasing voxel resolution the
general course of fiber orientations is still described by the analysis, but a loss in detail can
be observed. This is confirmed by the numerical results of fiber orientation summarized in
Tab. 4. For the scans with the W target deviations of the fiber orientation tensors in
comparison to the reference scan amount to max. 0.07. The scans of sample 1 with the Cu
and the Ag target (Fig. 10) result in comparable deviations of the fiber orientation tensors.
The relative distribution of fiber orientation components, with “xx” being the most
pronounced direction, is determined correctly from all scans except the scan with the Cu
target at a voxel resolution of 17 µm.
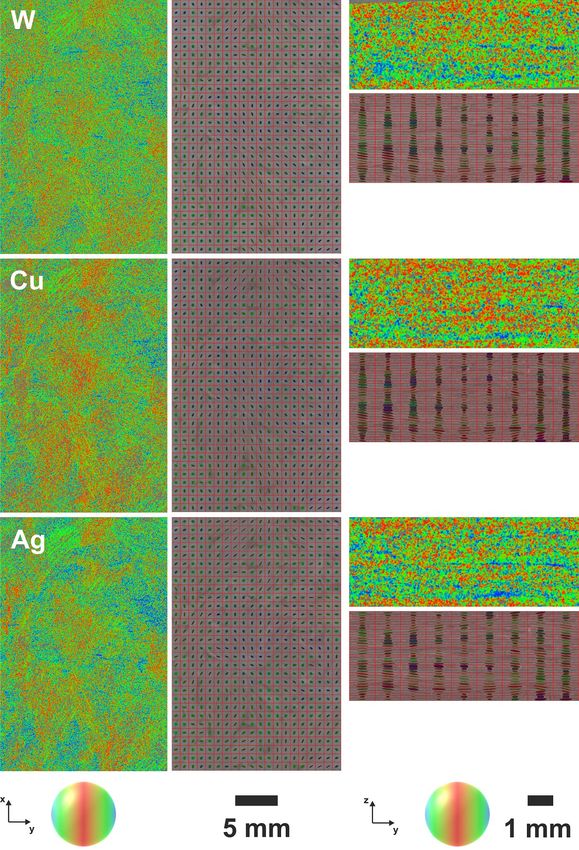
Fig. 11 and Fig. 12 illustrate the fiber orientation analyses of samples 2 and 3. In
comparison to sample 1 larger sample volumes have been scanned and the analysis regions
are 6 times larger. Especially for non-homogeneous fiber-reinforced plastics, like CF-SMC,
fiber orientation information over a representative sample volume is important to evaluate
component quality and to have adequate input data for structural mechanics simulations. For
this reason the determination of accurate fiber orientations from low-resolution CT scans is
of high relevance.
Since no reference scans at high resolution exist for samples 2 and 3, only a
qualitative evaluation of the results is possible. The depicted fiber orientations appear feasible
for all target materials. Tab. 5 and Tab. 6 show minor differences of the calculated fiber
orientation tensors, which are comparable in magnitude to the deviations observed for
sample 1.
10Fig. 9. Fiber orientation measurement of sample 1, W target. The color-coded images illustrate the local fiber
orientations (compare globe colors for fiber orientation). The mesh-images represent the fiber orientation per
unit cell. Each cell has dimensions of 1 x 1 x 0.1 mm³.
11Fig. 10. Fiber orientation measurement of sample 1, Cu and Ag target. The color-coded images illustrate the
local fiber orientations (compare globe colors for fiber orientation). The mesh-images represent the fiber
orientation per unit cell. Each cell has dimensions of 1 x 1 x 0.1 mm³.
Tab. 4. Fiber orientation measurements of sample 1 (difference to 2.9 µm scan is given in brackets)
Target Voxel xx yy zz
material resolution
[µm]
W 2.9 0.36 0.54 0.10
W 6.3 0.39 0.52 0.10
(0.03) (-0.02) (0.00)
Cu 6.1 0.43 0.43 0.14
(0.07) (-0.11) (0.04)
Ag 6.1 0.39 0.49 0.12
(0.03) (-0.05) (0.02)
W 17.4 0.43 0.51 0.06
(0.07) (-0.03) (-0.04)
Cu 17.4 0.47 0.46 0.06
(0.11) (-0.08) (-0.04)
Ag 17.3 0.44 0.51 0.05
(0.08) (-0.03) (-0.05)
12Fig. 11. Fiber orientation measurement of sample 2. The color-coded images illustrate the local fiber
orientations (compare globe colors for fiber orientation). The mesh-images represent the fiber orientation per
unit cell. Each cell has dimensions of 1 x 1 x 0.1 mm³.
13Fig. 12. Fiber orientation measurement of sample 3. The color-coded images illustrate the local fiber
orientations (compare globe colors for fiber orientation). The mesh-images represent the fiber orientation per
unit cell. Each cell has dimensions of 1 x 1 x 0.1 mm³.
14Tab. 5. Fiber orientation measurements of sample 2
Target Voxel xx yy zz
material resolution
[µm]
W 17.4 0.53 0.43 0.04
Cu 17.4 0.51 0.40 0.09
Ag 17.3 0.45 0.48 0.07
Tab. 6. Fiber orientation measurements of sample 3
Target Voxel xx yy zz
material resolution
[µm]
W 17.4 0.54 0.40 0.06
Cu 17.4 0.53 0.41 0.06
Ag 17.4 0.49 0.47 0.04
4. Summary and Outlook
In this study three different X-ray target materials (W, Cu, and Ag) were compared
regarding their performance in CT measurements of CF-SMC components.
All three target materials achieved equal resolutions using a JIMA test pattern. The
CT measurements showed that Cu and Ag targets cause a shift of the grey values to slightly
higher values in comparison to W target. Additional effects of the Cu and Ag target, which
have to be approved, are enhanced edge contrast and, for the Ag target, improved noise levels.
Because of a lower photon flux the Cu target requires about 1.5 times higher exposure times
compared to the W and the Ag target to achieve comparable I0 values.
In fiber orientation analysis no obvious advantages of the use of Cu and Ag targets
could be detected. Generally the accuracy of fiber orientation analysis was observed to
diminish with decreasing voxel resolution. Analyses based on scans with the Cu and Ag
targets showed comparable differences to the reference high resolution scan as scans with
the standard W target.
However, the general course of fiber orientations is described correctly also at a low
voxel resolution of approximately 17 µm, which might be sufficient for some applications.
At this voxel resolution samples with a diameter of approximately 20 mm and an even higher
length have been scanned and fiber orientation analysis was performed.
Regarding the reference values for fiber orientation, a high resolution scan is assumed
to deliver orientation values of high accuracy. However, no direct evidence for this
assumption exists. To thoroughly evaluate the correctness of a fiber orientation analysis a
reference sample of known fiber orientations would be required. Accordingly no final
conclusion about the ability of the alternative target materials Cu and Ag to improve the µ-
CT scan quality for fiber orientation analysis can be drawn. The development of suitable
reference samples for SMC materials might be subject of further studies.
References
[1] Automobili Lamborghini S.p.A., "Technical Data Sheet Forged Composites.", 2017. Available: https://
www.lamborghini.com/sites/it-en/files/DAM/lamborghini/forged/Forged%20presentation_EN.pdf.
[Accessed April 23, 2019].
15[2] The NORDAM Group, Inc., "Boeing 787 features composite window frames", Reinforced Plastics, vol.
51, no. 3, p. 4, 3 51 2007.
[3] M. Tuttle, T. Shifman and B. Boursier, "Simplifying Certification of Discontinuous Composite Material
Forms for Primary Aircraft Structures", in SAMPE, Seattle, Washington, USA, 2010.
[4] L. De Oto, "Carbon Fiber Innovation for High Volumes - The Forged Composite", in JEC Composites
Show Paris 2011, Paris, France, 2011.
[5] Hexcel Cooperation, "Hexcel Case Study: Audi R8 Carbon Fiber X-Brace", 2018. Available:
https://www.hexcel.com/user_area/content_media/raw/HexcelCSAudiv7web(1).pdf. [Accessed April 25,
2019].
[6] B. Boursier, "New possibilities with HexMC, a high performance moulding compound", in SAMPE
Conference, Paris, France, 2001.
[7] P. Feraboli, F. Gasco, B. Wade, S. Maier, R. Kwan, A. Masini, L. De Oto and M. Reggiani, "Lamborghini
"Forged Composites®" Technology for the Suspension Arms of the Sesto Elemento", in 26th American
Society for Composites (ASC) Annual Technical Conference, Montreal, Quebec, Canada, 2011.
[8] Volkswagen AG - Group Research, Internal Documents, Wolfsburg, Germany, 2019.
[9] Hexcel Corporation, Stamford, Connecticut, USA, "HexMC User Guide", 2019. Available:
https://www.hexcel.com/user_area/content_media/raw/HexMC_UserGuide.pdf. [Accessed April 23,
2019].
[10] Hexcel Corporation, Stamford, Connecticut, USA, "HexMC®-i Moulding Compound - Carbon Epoxy
HexMC®-i / C / 2000 / M77." Data sheet, 2019. Available: https://www.hexcel.com/user_are
a/content_media/raw/HexMCi_C_2000_M77_DataSheet.pdf. [Accessed April 23, 2019].
[11] B. R. Denos and B. R. Pipes, "Local Mean Fiber Orientation via Computer Assisted Tomography Analysis
for Long Discontinuous Fiber Composites", in Proceedings of the American Society for Composites:
Thirty First Technical Conference, Williamsburg, Virginia, USA, 2016.
[12] B. R. Denos, "Fiber Orientation Measurement in Platelet-Based Composites via Computed Tomography
Analysis", vol. 10608588, Purdue University, Purdue: ProQuest Dissertations Publishing, 2017.
[13] S. G. Kravchenko, "Failure Analysis in Platelet Molded Composite Systems", West Lafayette, Indiana,
USA: Purdue University, School of Aeronautics and Astronautics, 2017. PhD Thesis.
[14] S. C. Garcea, Y. Wang and P. J. Withers, "X-ray computed tomography of polymer composites",
Composites Science and Technology, vol. 156, pp. 305-319, 2018.
[15] H. Shen, S. Nutt and D. Hull, "Direct observation and measurement of fiber architecture in short fiber-
polymer composite foam through micro-CT imaging", Composites Science and Technology, vol. 64, no.
13, pp. 2113-2120, 2004.
[16] T. Riedel, "Evaluation of 3D fiber orientation analysis based on x-ray computed tomography data", in
Conference on Industrial Computed Tomography (ICT), Wels, Austria, 2012.
[17] S. Goris and T. A. Osswald, "Progress on the characterization of the process-induced fiber microstructure
of long glass fiber-reinforced thermoplastics", in Proc 16th SPE Automot Compos Conf Exhib (ACCE),
Novi, Michigan, USA, 2016.
[18] D. Maier, T. Dierig, C. Reinhart and T. Günther, "Analysis of Woven Fabrics and Fiber Composite
Material Aerospace Parts using Industrial CT Data", in 5th International Symposium on NDT in
Aerospace, Singapore, 2013.
[19] L. Brömstrup, "Fließpresssimulation kohlenstofffaserverstärkter Sheet Molding Compounds –
Potentialanalyse der Einzelfasersimulation", Bachelor Thesis, Volkswagen AG, Wolfsburg, 2018.
[20] B. R. Denos, D. E. Sommer, A. J. Favaloro, B. R. Pipes and W. B. Avery, "Fiber orientation measurement
from mesoscale CT scans of prepreg platelet molded composites", Composites Part A: Applied Science
and Manufacturing, vol. 114, pp. 241-249, 2018.
[21] A. Schulman. Technical Data Sheet, "https://engineeredcomposites.aschulman.com/data-sheets", 2019.
Available: https://cdn2.hubspot.net/hubfs/2015678/Engineered%20Composites%20/Documents/Product
%20PDFs/Quantum/ASI-TDS-AMC%208593%20HT%20rev.pdf. [Accessed May 6, 2019].
[22] JIMA, "Japan Inspection Instruments Manufacturers’ Association", Available: http://www.jima.jp/engli
sh/assen-e.html. [Accessed May 2, 2019].
[23] N. Flay and R. Leach, "Application of the optical transfer function in X-ray computed tomography – a
review", National Physical Laboratory (NPL), Report ENG 41, Teddington, Middlesex, United Kingdom,
2012.
16[24] C. Bellon and G.-R. Jaenisch, "aRTist – Analytical RT Inspection Simulation Tool", in DIR 2007 -
International Symposium on Digital industrial Radiology and Computed Tomography, Lyon, France, June
25-27, 2007.
17You can also read