Laser Diffraction as An Innovative Alternative to Standard Pipette Method for Determination of Soil Texture Classes in Central Europe - MDPI
←
→
Page content transcription
If your browser does not render page correctly, please read the page content below
water
Article
Laser Diffraction as An Innovative Alternative to
Standard Pipette Method for Determination of Soil
Texture Classes in Central Europe
Dušan Igaz 1, *, Elena Aydin 1, * , Miroslava Šinkovičová 1 , Vladimír Šimanský 2 , Andrej Tall 3
and Ján Horák 1
 1   Department of Biometeorology and Hydrology, Slovak University of Agriculture, 94976 Nitra, Slovakia;
     mirka.sinkovic@gmail.com (M.Š.); jan.horak@uniag.sk (J.H.)
 2   Department of Soil Science, Slovak University of Agriculture, 94901 Nitra, Slovakia;
     vladimir.simansky@uniag.sk
 3   Institute of Hydrology Slovak Academy of Sciences, 84104 Bratislava, Slovakia; tall@uh.savba.sk
 *   Correspondence: dusan.igaz@uniag.sk (D.I.); elena.aydin@uniag.sk (E.A.)

 Received: 24 March 2020; Accepted: 22 April 2020; Published: 26 April 2020

 Abstract: The paper presents the comparison of soil particle size distribution determined by standard
 pipette method and laser diffraction. Based on the obtained results (542 soil samples from 271 sites
 located in the Nitra, Váh and Hron River basins), regression models were calculated to convert
 the results of the particle size distribution by laser diffraction to pipette method. Considering one
 of the most common soil texture classification systems used in Slovakia (according to Novák), the
 emphasis was placed on the determination accuracy of particle size fraction
Water 2020, 12, 1232 2 of 16
distribution is essential for water movement in the soil profile as it influences infiltration rate, water
holding capacity, water content constants, and hydraulic conductivity, and the overall hydrological
balance of the area [8–10]. The results of the particle size analyses are of key importance for plant
fertilization and liming, and also for the actual cultivation of the soil, e.g., determination of difficultness
and effortfulness of agronomical interventions.
The size of soil particles plays the most important role in their distribution in the soil. The
representation of individual particle size fractions can be obtained in several ways. The most
common method of particle size determination is sieving of soil using the set of sieves [11], finer
fractions are obtained using sedimentation methods. Sedimentation methods are based on the Stokes’
Law—formulated in 1851: “The resistance of liquid to the fall of solid spherical particles varies
according to the particle radiuses not their surface” [12,13]. Sedimentation methods are based on the
principle that the particle sedimentation drop velocity in water suspension depends on the particle size
and the liquid properties. Pipette method (PM) belongs to the group of methods using nonrepetitive
sedimentation of soil particles, which is considered to be one of the least demanding, but the most
accurate (accuracy of 2.3%), methods in soil science ever. However, a rather lengthy duration of the
particle size analysis is its disadvantage [5,14]. In Slovakia and abroad, the pipette method is still the
most commonly used method in soil science practice [5,14,15]. Additionally, with the development of
sophisticated instrumentation, direct (such as microscopy) and indirect optical methods (such as laser
diffraction) have been used, especially in recent decades. Rather recently, Allen [16] has started to use
the laser diffraction method (LD) for particle size distribution determination in soil science, and its
applicability in soil science and related fields has begun to increase in the recent years [1,3,17,18]. Laser
diffraction analysis determines the particle size indirectly based on the angle of the reflected laser beam
from the particle with inverse proportionality [19]. It is a relatively simple and fast method [20,21],
but there is no uniform standard methodology for soil sample preparation and the analysis itself.
Although ISO 13320:2009 [22] recommends preparing a sample of the analyzed material by adding a
dispersing agent dropwise, the consistency of the resulting paste is strongly left to subjective opinion
and experience of the operating staff. Moreover, the results on particle size distribution for the same
sample determined by laser diffraction and pipette method are not equal due to the different physical
principles on which the methods are based. This incompatibility in the results can limit the applicability
of laser diffraction soil analysis in engineering and computer modelling [19,22–26].
In the past decade, several authors have been involved in the determination of particle size
distribution by LD, trying to unify the obtained results with the standard PM in soil science [1,3,27–32].
The differences in their results and methodologies are based mainly on the different methods of soil
sample preparation prior to analysis (such as different amounts of soil and dispersion agents used),
different LD devices and their settings. Since the conversion of results from LD to PM is influenced by
a number of factors and the results cannot be compared without further processing [27,33–35], there is
an effort to create regression models that allow recalculation of the LD results to values comparable to
sedimentation methods. Statistical analysis of the results obtained by LD and PM has been performed
abroad by several authors [23,28,29,36–38]. However, statistical relationships derived by one author
are rarely applicable to other authors due to differences in LD instrumentation, measurement range,
use of Mie or Fraunhofer calculation theory, and, last but not least, interpretation of the obtained results
in different particle size and soil texture classification systems.
Soil texture classes are determined based on the percentage representation of individual particle
size fractions, using different classification systems worldwide. One of the most commonly used is the
soil texture triangle classification according to United States Department of Agriculture (USDA) [39]
that uses the representation of the three basic particle size fractions of sand (0.005–2 mm), silt
(0.002–0.005 mm), and clay (particles below 0.002 mm). According to Bedrna and Ofránus [40], the
usage of USDA triangle classification in Slovakia is only recent and primarily used for specification
of particle size distribution of mineral soils in the morphogenetic soil classification [41]. However,
there are also other particle size fraction classification systems used alongside USDA (Table S1),Water 2020, 12, 1232 3 of 16
and while some are at least partially compatible with the USDA system [42,43], the rest is hardly
comparable due to focus on different particle size fractions. Many countries in Central and Eastern
Europe (e.g., Czech Republic, Slovakia, Bulgaria) as well as countries of former USSR and China
adopted the classification of particle size fractions according to Kachinski [44,45]. The simplified
classification according to Kachinski was also adopted for the purposes of past soil surveys done on
the national level in Slovakia. The soil texture classification system of Slovakia (Novak’s classification)
originates in the Kachinski system, and soil texture is evaluated according to the percentage particles
below 0.01 mm [5] (Table 1). General soil texture classes (light, medium heavy, and heavy soils)
refer to easiness in cultivation and the impact of cultivation tools on the soil [44]. A complex soil
survey (CSS) (1960–1970) collected information on soil texture and other basic soil properties in the
agricultural soils in the former Czechoslovakia. The subsequent soil quality evaluation (soil bonitation)
(1972–1978) [46] used the collected information, along with other purposes, to elaborate maps of
evaluated (bonitated) soil-ecological units (ESEU). Up till now, the maps of ESEU have been widely
used for land consolidation and landscape conservation projects [47,48]. This system also provides data
for legislation, determination of land tax, for exchange of land, and for decision-making by authorities
in cases of interest to use agricultural land for nonagricultural purposes [49].
Table 1. Classification of soil texture classes according to Novák [50].
Particles with Diameter
Soil Texture Class General Soil Texture ClassWater 2020, 12, 1232 4 of 16
2. Materials and Methods
2.1. Study Area
The area of interest (total area 24,234 km2 ) consisted of three neighboring basins of Váh River
(total area = 14,268 km2 ), Nitra River (total area = 4501 km2 ), and Hron River (total area = 5465 km2 )
Water 2020, 12, x FOR PEER REVIEW 5 of 16
located in the western and central part of Slovakia (Figure 1). According to the orographic division,
purposes
the territoryofisour study,inthe
located thesame soil samples
orographic were analyzed
sub-system by the particle
of the Carpathian size analyzers
Mountains and theusing laser
Pannonian
diffraction method.
Basin [51].
Figure1.1.Location
Figure Locationand
andthe
thenumber
number of
of sampling
sampling sites
sites in
in the
theNitra,
Nitra,Váh,
Váh,and
andHron
HronRiver
Riverbasins
basins[52].
[52].
2.2.The
Soilterrain
Analysis ofbyVáhPipette
River Method
basin is very complex and includes all types of relief, from the plains and
hills upCarbonates
to the mountains
(CaCO3)ofwere highremoved
altitude.fromThe amajority of the basin’s
representative soil samplealtitude rangesfrom
prepared fromair-dried
400 m up
toand
800 sieved
m. In terms of climatic conditions, the basin belongs to a warm,
fine soil (particlesWater 2020, 12, 1232 5 of 16
of 200–250 m where the average annual air temperature 9.5 ◦ C with an annual rainfall in the range
of 550–700 mm. The moderate climate area is represented from the altitudes of 750–800 m where the
average annual air temperature reaches 6–8 ◦ C and average annual rainfall is 700–900 mm. The higher
altitudes belong to a cold climate area with an average annual air temperature of 4–5 ◦ C and rainfall of
more than 900 mm. The soils in the basin are mainly Chernozems and Luvisols; Rendzic Leptosols,
Calcaric Cambisols, Fluvisols, Podzols, and Stagnosols are represented less often. Agricultural land
accounts for 47.2% of the river basin area.
Soil sampling in the above-mentioned basins was conducted as a part of a bigger study, in which
the disturbed and undisturbed soil samples were taken from specific locations and were used for
soil analysis of the basic physical and hydrophysical properties. The results were reported in the
scientific monograph by Skalová et al. [51]. The location of sampling areas was determined according
to maps of ESEU to obtain a network of sampling locations representing approximately the area of
6 × 6 km2 . The sampling point was chosen at least 300 m aside from the expected border of specific
ESEU (there is a potential of its shifting within a year due to tillage etc.). Information of soil texture
classes from maps of ESEU was used to ensure that the general percentage distribution of soil texture
classes on the agricultural land in the basins would correspond to the representation of soil texture
classes at the sampling sites. For the purposes of soil texture analysis by pipette method, disturbed soil
samples were taken only from agricultural land from two depths, 15–20 cm and 40–45 cm (Figure S1).
In total, 542 samples were taken from 271 sampling sites (Figure 1), consisting of 190, 176, and 176
samples from the Nitra, Váh, and Hron River basins, respectively (Figures S2–S4). Subsequently, for
the purposes of our study, the same soil samples were analyzed by the particle size analyzers using
laser diffraction method.
2.2. Soil Analysis by Pipette Method
Carbonates (CaCO3 ) were removed from a representative soil sample prepared from air-dried
and sieved fine soil (particlesWater 2020, 12, 1232 6 of 16
index [34]. The Mastersizer2000 laser analyzer (Malvern, UK) (LD_2000) (Figure S6) was operated by
the Malvern SOP software, and some tasks were also performed manually. The measurements were
conducted in the full measuring range of the device (0.02–2000 µm). The instrument settings were the
same as in the case of the former analyzer.
Each sample was measured at least three times until the differences in the percentage of clayey
fraction for three individual measurements were less than 2%. Results on soil particle size distribution
were reported in the cumulative particle size fractions according to CSS classification:Water 2020, 12, 1232 7 of 16
Water 2020, 12, x FOR PEER REVIEW 7 of 16
Water 2020, 12, x FOR PEER REVIEW 7 of 16
Figure
Figure 2. Comparison
2. Comparison ofof cumulativeparticle
cumulative particle size
size fractions
fractionsrepresentation
representationdetermined
determinedbybyAnalysette22
Analysette22
MicroTec plus (LD_22) and Mastersizer2000 (LD_2000) and pipette method (PM)
MicroTec plus (LD_22) and Mastersizer2000 (LD_2000) and pipette method (PM) for soil samples for soil samples
from
from three river basins. LD, laser diffraction.
three river basins. LD, laser diffraction.
Figures
Figures 3–53–5 present
present thethe relationshipsfor
relationships forthree
three regression
regression models
modelswith withthe highest
the values
highest of the
values of the
determination coefficient
Figure 2. Comparison 2ofR 2 between
cumulative the
particleparticle size
size fractions distribution
representation as observed
determined by LD and
by Analysette22
determination coefficient R between the particle size distribution as observed by LD and PM analyses. PM
MicroTec plus (LD_22) and Mastersizer2000 (LD_2000) and pipette method (PM) for soil samples
Theanalyses.
regressionThe regression
function forfunction for the polynomial
the polynomial trend has the
from three river basins. LD, laser diffraction.
trend has the following
following general form:
general form:
Y = b2 × X2 + b1 × X1 + b0, (1)
Y = b2 for
Figures 3–5 present the relationships × X2 + b1
three × X1 + b0,
regression models with the highest values of the (1)
where Y—dependent
determination variable.
coefficient R2 between the particle size distribution as observed by LD and PM
where b2—coefficient 2.
analyses. The regression function for the polynomial trend has the following general form:
X2—independent variable 2.
Y—dependent variable.1. Y = b2 × X2 + b1 × X1 + b0, (1)
b1—coefficient
X1—independent
b2—coefficient
where 2.
Y—dependent variable 1.
variable.
b0—constant.
X2—independent variable
b2—coefficient 2. 2.
X2—independent
b1—coefficient 1. variable 2.
b1—coefficient 1.
X1—independent variable 1.
X1—independent variable 1.
b0—constant.
b0—constant.
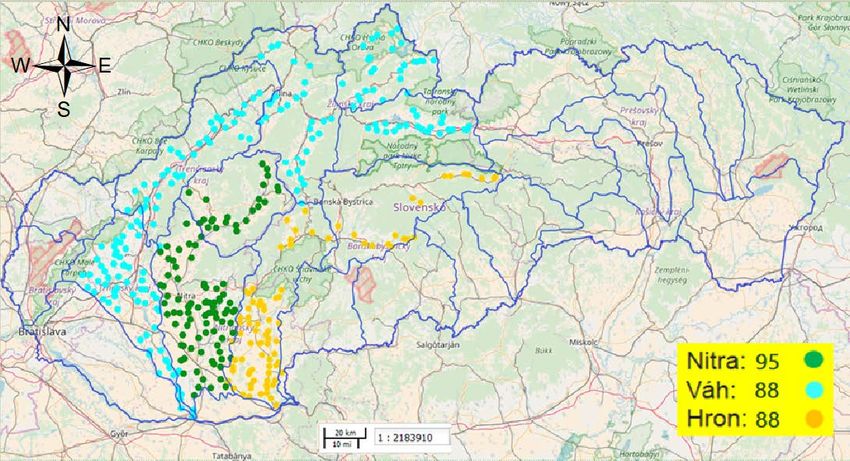
Figure 3. Linear regression correlation between pipette method (PM) and laser diffraction method for
all soil samples as determined by Analysette22 MicroTec plus (LD_22) and Mastersizer2000
(LD_2000).
Figure 3. Linear
Figure regression
3. Linear correlation
regression correlationbetween
between pipette method(PM)
pipette method (PM)
andand laser
laser diffraction
diffraction method
method for for
allsamples
all soil soil samples as determined
as determined by Analysette22
by Analysette22 MicroTecMicroTec plus (LD_22)
plus (LD_22) and Mastersizer2000
and Mastersizer2000 (LD_2000).
(LD_2000).Water 2020, 12, 1232 8 of 16
Water 2020, 12, x FOR PEER REVIEW 8 of 16
Figure 4. Exponential regression correlation between pipette method (PM) and laser diffraction
method for all soil samples as determined by Analysette22 MicroTec plus (LD_22) and
Mastersizer2000 (LD_2000).
The polynomial regression model appeared to be the best fitting, when the coefficient of
determination at the selected level of significance alpha = 0.05 was 0.7664 for Analysette22 MicroTec
plus and 0.8467 for Mastersizer2000 (Figure 5). These values indicate that the selected regression
model explained the variability to approximately 76.64% and 84.67% for Analysette22 MicroTec plus
Exponential regression
Figure 4. Exponential regression correlation
correlation between
between pipette
pipette method
method (PM)
(PM) and
and laser
laser diffraction
and Mastersizer2000, respectively, while the rest was related to unexplained variability, the effect of
method for
forall all
soil soil
samples as determined
samples by Analysette22
as determined MicroTec plus
by Analysette22 (LD_22) and
MicroTec plusMastersizer2000
(LD_22) and
random factors and other unspecified effects.
(LD_2000).
Mastersizer2000 (LD_2000).
The polynomial regression model appeared to be the best fitting, when the coefficient of
determination at the selected level of significance alpha = 0.05 was 0.7664 for Analysette22 MicroTec
plus and 0.8467 for Mastersizer2000 (Figure 5). These values indicate that the selected regression
model explained the variability to approximately 76.64% and 84.67% for Analysette22 MicroTec plus
and Mastersizer2000, respectively, while the rest was related to unexplained variability, the effect of
random factors and other unspecified effects.
Polynomial regression
Figure 5. Polynomial regression correlation
correlation between
between pipette
pipette method
method (PM)
(PM) and
and laser
laser diffraction
method for
forall all
soil soil
samples as determined
samples by Analysette22
as determined MicroTec plus
by Analysette22 (LD_22) and
MicroTec plusMastersizer2000
(LD_22) and
(LD_2000).
Mastersizer2000 (LD_2000).
The selected
The polynomial regression
models model appeared
were statistically to be95%
verified with thereliability
best fitting, when
for both usedthelaser
coefficient
analyzersof
determination
(Table 2). In the at one-way
the selected level ofsection,
ANOVA significance alphathe
we tested = 0.05
nullwas 0.7664 forwhether
hypothesis, Analysette22 MicroTec
the model was
plus and 0.8467 for Mastersizer2000 (Figure 5). These values indicate that the selected
appropriate, and whether the variables of the model were correlated with the dependent variable. regression
model
The explained
F test was used thetovariability to approximately
evaluate this claim, where the76.64% andSignificance
overall 84.67% for Analysette22
F values wereMicroTec plusWater 2020, 12, 1232 9 of 16 meant that the models were chosen correctly. In case of Analysette22 MicroTec plus, the polynomial regression model was overall statistically significant (Significance F = 0
Water 2020, 12, 1232                                                                              10 of 16

by both analyzers, the differences between the estimated values for PMestPM (polynomial model)
and measured values (PMme ) were relatively small (up to 6%) for fractions
Water 2020, 12, 1232                                                                                 11 of 16

classes occurring in the basins similar to the representation of soil samples in the dataset, we assume
that the methodology can be used for soil texture analysis in the mentioned basins as well as in areas
with similar conditions. In total, 542 soil samples were used in this study, of which 271 were used for
determining the relationship between PM and LD measurements. Some other published studies are
based on a dataset of 10–37 samples [30,53,55,56]. Miller and Schaetzl [57] published a study with 1485
samples, however those were analyzed only by LD as the study was aimed to precision of soil particle
size analysis using LD.
      Konert and Vandenberghe [58] published a study comparing the PM with the LD and found that
while there was only a slight difference between the representation of sand fraction determined by both
methods, the representation of clay fraction (
Water 2020, 12, 1232 12 of 16
the laser analyzers made by the same producer (e.g., Sochan et al. [60]). Finally, Mastersizer2000 has a
wider measuring range (0.02–2000 µm) in comparison with Analysette22 MicroTec plus (0.08–2000 µm)
and it results in different detection limits [38].
4.3. Comparison of PM and LD Method
Eshel et al. [38] suggest that the choice between the particle size analysis methods should be
balanced depending on their pros and cons. The advantage of LD in comparison with PM in general is
the considerably shorter time of analysis, need of a small sample for analysis, and that distribution of
group of size fractions is evaluated at the same time. Thus, elaborating the particle size distribution
curve is not limited. In contrary, according to Eshel et al. [38] the disadvantage of LD is the high
cost of the instrumentation and the lack of a database that would correlate LD-derived distribution
of particle sizes with soil properties, similarly to the extensive database existing for PM. Moreover,
every laboratory aiming to use LD for particle size distribution of soil samples or samples of similar
heterogenic composition must firstly solve the issue of correlating the LD measurements by specific
instrument with standard methods. Otherwise, the LD measurements have only limited usage (such
as monitoring the change in particle size distribution over time) and should not be used directly for
soil texture classification.
Varga et al. [55] also pointed out the lack of studies about the performance of commercially
available LD devices. The authors further added that robustness, reproducibility, and comparability of
grain size data obtained with various devices is a basic issue and associated uncertainties are rarely
considered. Dumbrovský et al. [53], along with other authors, mentioned the possibility of LD analysis
to calculate the results for any soil fraction classification. Of course, this can be done also for PM as
there are various soil classification systems used worldwide, however the classification needs to be
specified prior to the measurement because of different particle settling times. In case of LD, as the
results are stored in the database, they can be recalculated post-measurement without the need of
additional measurements. The only limitation for LD in this way is the measurement range. While in
the past, due to the limited measuring range, LD had to be combined with another method of particle
size distribution (such as sieving), it is not an issue nowadays as the devices reach the upper threshold
of 2 mm. As the technology develops further, the measuring range of LD devices is extending up
to 0.01–3000 µm in case of Mastersizer3000 with a Hydro Lv and Horiba Partica La-950 v 2 used in
the study of Varga et al. [55]. We assume that the wide range of measurement and the short time of
analysis (approximately 6 min for one cycle including cleaning) can also contribute to more accurate
analyses, since more repetitive measurements can be done in considerably shorter time in comparison
with sedimentation methods.
5. Conclusions
Determination of particle size distribution and the subsequent soil texture class is one of the most
fundamental soil analyses. Although laser diffraction has a big potential in soil science applications,
our study also confirmed the necessity of comparison with standard methods.
Our investigations focused on the particle size distribution of fractions according to simplified
classification by Kachinski that was used in complex soil survey in former Czechoslovakia and
comparison of the results. In total, 542 soil samples from two depths (15–20 cm and 40–45 cm)
collected in Nitra, Hron, and Váh River basins in Slovakia were analyzed by pipette method and two
state-of-the-art laser diffraction devices—Analysette22 MicroTec plus and Mastersizer2000.
We aimed especially at fractionWater 2020, 12, 1232 13 of 16 Considering one of the most common soil texture classification systems used in Slovakia (according to Novák), the emphasis was placed on the determination accuracy of particle size fraction
Water 2020, 12, 1232                                                                                           14 of 16

7.    Fotyma, M.; Igras, J.; Tkaczyk, P.; Pikuła, D. Soil testing methods and fertilizer recommendations in
      Central–Eastern European countries. Monography. Fertil. Fertil. 2008, 30, 1–110. Available online:
      http://nawfert.iung.pulawy.pl/zeszyty/pelne/30%202008.pdf (accessed on 14 April 2020).
8.    Bárek, V.; Halaj, P.; Igaz, D. The influence of climate change on water demands for irrigation of special plants
      and vegetables in Slovakia. In Bioclimatology and Natural Hazards; Springer: Dordrecht, The Netherlands,
      2009; pp. 271–282.
9.    Tárník, A.; Igaz, D. Quantification of soil water storage available to plants in the Nitra river basin. Acta Sci.
      Pol. 2015, 14, 209–216. [CrossRef]
10.   Mikloš, M.; Igaz, D.; Šinka, K.; Škvareninová, J.; Jančo, M.; Vyskot, I.; Škvarenina, J. Ski piste snow ablation
      versus potential infiltration (Veporic Unit, Western Carpathians). J. Hydrol. Hydromech. 2020, 68, 28–37.
      [CrossRef]
11.   Gee, G.W.; Bauder, J.W. Particle-size analysis. In Methods of Soil Analysis, Part 1 Physical and Mineralogical
      Methods, 2nd ed.; Klute, A., Ed.; SSSA: Madison, WI, USA, 1986; pp. 383–409.
12.   Muggler, C.C.; Pape, T.; Buurman, P. Laser grain-size determination in soil genetic studies 2. Clay content,
      clay formation, and aggregation in some Brazilian oxisols. Soil Sci. 1997, 162, 219–228. [CrossRef]
13.   Lal, R.; Shukla, M.K. Principles of Soil Physics; Marcel Dekker: New York, NY, USA, 2004.
14.   Hrivňáková, K.; Makovníková, J.; Barančíková, G.; Bezák, P.; Bezáková, Z.; Dodok, R.; Grečo, V.; Chlpík, J.
      Jednotné Pracovné Postupy Rozborov Pôd [Uniform Working Procedures for Soil Analyzes]; VUPOP: Bratislava,
      Slovakia, 2011. (In Slovak)
15.   Soil Survey Staff. Soil Survey Field and Laboratory Methods Manual; Soil Survey Investigations Report No. 51,
      Version 2.0; Burt, R., Soil Survey Staff, Eds.; U.S. Department of Agriculture, Natural Resources Conservation
      Service: Lincoln, NE, USA, 2014. Available online: https://www.nrcs.usda.gov/Internet/FSE_DOCUMENTS/
      stelprdb1244466.pdf (accessed on 2 February 2020).
16.   Allen, T.A. Particle Size Measurement, 4th ed.; Chapman and Hall: London, UK, 1990.
17.   Vendelboe, A.L.; Moldrup, P.; Schjønning, P.; Oyedele, D.J.; Jin, Y.; Scow, K.M.; De Jonge, L.W. Colloid release
      from soil aggregates: Application of laser diffraction. Vadose Zone J. 2012, 11, 1539–1663. [CrossRef]
18.   Zumr, D.; Mützenberg, D.V.; Neumann, M.; Jeřábek, J.; Laburda, T.; Kavka, P.; Johannsen, L.L.; Zambon, N.;
      Klik, A.; Strauss, P.; et al. Experimental setup for splash erosion monitoring—Study of silty loam splash
      characteristics. Sustainability 2020, 12, 157. [CrossRef]
19.   Kondrlová, E.; Igaz, D.; Horák, J. Principles of soil particle size analysis by indirect optical method:
      Advantages and disadvantages of laser diffraction analysis. Mater. Methods Technol. 2013, 7, 492–501.
20.   Goossens, D.; Buck, B. Dust emission by off-road driving: Experiments on 17 arid soil types Nevada, USA.
      Geomorphology 2009, 107, 118–138. [CrossRef]
21.   Stanley, K.E.; Schaetzl, R.J. Characteristics and paleoenvironmental significance of a thin, dual-sourced loess
      sheet, north-central Wisconsin. Aeolian Res. 2011, 2, 241–251. [CrossRef]
22.   ISO 13320:2009 (BS ISO 13320:2009). Particle Size Analysis-Laser Diffraction Methods; International Organization
      for Standardization: Geneva, Switzerland, 2009.
23.   Vandecasteele, B.; De Vos, B. Relationship between soil textural fractions determined by
      the sieve-pipette method and laser diffractometry.                  IBW Bb R 2003, 1–19.                Available
      online: https://www.researchgate.net/publication/273948901_Relationship_between_soil_textural_fractions_
      determined_by_the_sieve-pipette_method_and_laser_diffractometry (accessed on 14 April 2020).
24.   Šinkovičová, M.; Igaz, D.; Čimo, J.; Halaj, P. Preparation methodology of soil samples for laser diffraction.
      Mater. Methods Technol. 2016, 10, 191–197.
25.   Šinkovičová, M.; Igaz, D.; Kondrlová, E.; Jarošová, M. Soil particle size analysis by laser diffractometry:
      Result comparison with pipette method. IOP Conf. Ser. Mater. Sci. Eng. 2017, 245, 072025. [CrossRef]
26.   Kondrlová, E.; Igaz, D.; Grešová, L.; Horák, J. Porovnanie spôsobov prípravy pôdnych vzoriek a metód
      merania distribúcie zrnitostných frakcií pôd v povodí rieky Nitra [Comparison of methods of soil samples
      preparation and methods of measurement of grain size fractions of distribution in Nitra River basin]. Acta
      Hortic. Regiotect. 2012, 15, 27–30. (In Slovak)
27.   Kondrlová, E.; Igaz, D.; Horák, J.; Čimo, J. Comparison of sample preparation methods for laser diffraction
      to determine the particle size distribution of medium fine soils. In Proceedings of the Land Degradation and
      Challenges in Sustainable Soil Management: 8th International Soil Science Congress, Izmir, Turkey, 15–17
      May 2012; pp. 432–437.
Water 2020, 12, 1232 15 of 16
28. Kun, Á.; Katona, O.; Sipos, G.; Barta, K. Comparison of pipette and laser diffraction methods in determining
the granulometric content of fluvial sediment samples. J. Environ. Geogr. 2013, 6, 49–54. [CrossRef]
29. Yang, X.; Zhang, Q.; Li, X.; Jia, X.; Wei, X.; Shao, M. Determination of soil texture by laser diffraction method.
Soil Phys. Hydrol. Soil Sci. Soc. Am. J. 2015, 79, 1556–1566. [CrossRef]
30. Taubner, H.; Roth, B.; Tippkötter, R. Determination of soil texture: Comparison of the sedimentation method
and the laser-diffraction analysis. J. Plant Nutr. Soil Sci. 2009, 172, 161–171. [CrossRef]
31. Mihalache, D.; Ilie, L.; Marin, D.I.; Calciu, I. The new methods for measuring soil texture. In Seria
Agricultură-Montanologie-Cadastru; Analele Universităţii: Craiova, Romania, 2010; Volume 40, pp. 486–490.
32. Jena, R.; Jagadeeswaran, R.; Sivasamy, R. Analogy of soil parameters in particle size analysis through laser
diffraction techniques. Indian J. Hill Farm. 2013, 26, 78–83.
33. Kondrlová, E.; Igaz, D.; Horák, J. Effect of calculation models on particle size distribution estimated by laser
diffraction. J. Ege Univ. Fac. Agric. 2015, 52, 21–27.
34. FRITSCH. Laser Equipment for Particle Analyzer 2016. Available online: http://www.ilabo.cz/UserFiles/File/
eshop/672/d_ANALYSETTE%2022%20CZ.pdf (accessed on 1 February 2020).
35. Kerry, R.; Rawlins, B.G.; Oliver, M.A.; Lacinska, A.M. Problems with determining the particle size distribution
of chalk soil and some of their implications. Geoderma 2009, 152, 324–337. [CrossRef]
36. Di Stefano, C.; Ferro, V.; Mirabile, S. Testing the grain-size distribution determined by laser diffractometry
for sicilian soils. J. Agric. Eng. 2011, 42, 39–46. [CrossRef]
37. Kowalenko, C.G.; Babuin, D. Inherent factors limiting the use of laser diffraction for determining particle
size distributions of soil and related samples. Geoderma 2013, 193–194, 22–28. [CrossRef]
38. Eshel, G.; Levy, G.J.; Mingelgrin, U.; Singer, M.J. Critical evaluation of the use of laser diffraction method for
particle-size distribution analysis. Soil Sci. Am. J. 2004, 68, 736–743. [CrossRef]
39. Soil Survey Staff. Soil Taxonomy: A Basic System of Soil Classification for Making and Interpreting Soil Surveys;
Natural Resources Conservation Service: Washington, DC, USA, 2010.
40. Bedrna, Z.; Ofránus, T. Aplikácia novej klasifikácie textúry v geografii pôd Slovenska. [Application of new
soil texture classification in geography of Slovakia]. Geogr. J. 2013, 65, 161–169. (In Slovak)
41. Balkovič, J.; Bedrna, Z.; Bublinec, E.; Čurlík, J.; Dlapa, P.; Fulajtár, E.; Gregor, J. Morfogenetický Klasifikačný
Systém Pôd Slovenska. Bazálna Referenčná Taxonómia [Morphogenetic Soil Classification System of Slovakia], 2nd
ed.; NPPC VÚPOP: Bratislava, Slovakia, 2014. (In Slovak)
42. Gleboznawcze, P.T. Particle size distribution and textural classes of soils and mineral materials - classification
of Polish Society of Soil Science 2008. Pol. Soil Sci. Annu. 2009, 60, 5–16.
43. IUSS Working Group WRB. World Reference Base for Soil Resources 2014, Update 2015. International Soil
Classification System for Naming Soils and Creating Legends for Soil Maps; World Soil Resources Reports No. 106;
FAO: Rome, Italy, 2015.
44. Hristov, B. The importance of soil texture in soil classification systems. J. Balk. Ecol. 2013, 16, 137–139.
45. Deng, J.; Ma, C.; Yu, H. Different soil particle-size classification systems for calculating volume fractal
dimension—A case study of Pinus sylvestris var. Mongolica in Mu Us Sandy Land, China. Appl. Sci. 2018, 8,
1872. [CrossRef]
46. Ilavská, B. Využitie údajov VUPOP pri pozemkových úpravách. [Use of SSCRI Data for Land Consolidation].
In Workshop of Land Consolidation; SZG: Bratislava, Slovakia, 2001. (In Slovak)
47. Petrovič, F.; Stranovsky, P.; Muchová, Z.; Falt’an, V.; Skokanová, H.; Havlíček, M.; Gábor, M.; Spulerová, J.
Landscape-ecological optimization of hydric potential in foothills region with dispersed settlements—A
case study of Nová Bošáca, Slovakia. Appl. Ecol. Environ. Res. 2017, 15, 379–400. Available online:
http://www.aloki.hu/pdf/1501_379400.pdf (accessed on 20 February 2020). [CrossRef]
48. Súl’ovský, M.; Falt’an, V.; Skokanová, H.; Havlíček, M.; Petrovič, F. Spatial analysis of long-term land-use
development in regard to physiotopes: Case studies from the Carpathians. Phys. Geogr. 2017, 38, 470–488.
[CrossRef]
49. VÚMOP. Research Institute for Soil and Water Conservation, Praha: An Overview of Performance and Results
Obtained in 1993 with a Short Account of History; Výzkumný Ústav Meliorací a Ochrany Půdy: Praha, Czech
Republic, 1994.
50. Šimanský, V.; Polláková, N.; Chlpík, J.; Kolenčík, M. Návody na Cvičenia z Pôdoznalectva [Guidelines for Soil
Science Practicals]; Slovenská Pol’nohospodárska Univerzita v Nitre: Nitra, Slovakia, 2017. (In Slovak)Water 2020, 12, 1232 16 of 16
51. Skalová, J.; Kotorová, D.; Igaz, D.; Gomboš, M.; Nováková, K. Regionalizácia Pedotransferových Funkcií
Vlhkostných Retenčných Kriviek Pôdy [Regionalization of Pedotransfer Functions of Soil Moisture Retention Curves];
STU: Bratislava, Slovakia, 2015. (In Slovak)
52. Hydrophysics Web Server. 2020. Available online: http://fzki.uniag.sk/hydrophysics/ (accessed on 10
February 2020).
53. Dumbrovský, M.; Larišová, L.; Sobotková, V.; Kulihová, M. Comparison of different texture analysis for soil
erodibility calculations of loamy and sandy-loam soils in Moravian regions. Acta Univ. Agric. Silvic. Mendel.
Brun. 2019, 67, 383–393. [CrossRef]
54. Ließ, M.; Glaser, B.; Huwe, B. Uncertainty in the spatial prediction of soil texture. Comparison of regression
tree and Random Forest models. Geoderma 2012, 170, 70–79. [CrossRef]
55. Varga, G.; Gresina, F.; Újvári, G.; Kovács, J.; Szalai, Z. On the reliability and comparability of laser diffraction
grain size measurements of paleosols in loess records. Sediment. Geol. 2019, 389, 42–53. [CrossRef]
56. Orzechowski, M.; Smólczyński, S.; Długosz, J.; Poźniak, P. Measurements of texture of soils formed from
glaciolimnic sediments by areometric method, pipette method and laser diffraction method. Sci. Annu. 2014,
65, 72–79. [CrossRef]
57. Miller, B.A.; Schaetzl, R.J. Precision of soil particle analysis using laser diffractometry. Soil Sci. Am. J. 2011,
76, 1719–1727. [CrossRef]
58. Konert, M.; Vandenberghe, J. Comparison of laser grain size analysis with pipette and sieve analysis:
A solution for the underestimation of the clay fraction. Sedimentology 1997, 44, 523–535. [CrossRef]
59. Beuselinck, L.; Govers, G.; Poesen, J.; Degraer, G.; Froyen, L. Grain-size analysis by laser diffractometry:
Comparison with the sieve-pipette method. Catena 1998, 32, 193–208. [CrossRef]
60. Sochan, A.; Bieganowski, A.; Ryżak, M.; Dobrowolski, R.; Bartmiñski, P. Comparison of soil texture
determined by two dispersion units of Mastersizer 2000. Int. Agrophys. 2012, 26, 99–102. [CrossRef]
© 2020 by the authors. Licensee MDPI, Basel, Switzerland. This article is an open access
article distributed under the terms and conditions of the Creative Commons Attribution
(CC BY) license (http://creativecommons.org/licenses/by/4.0/).You can also read