R&SGSASLP SATELLITE LINK PLANNER R&SGSACSM COMMUNICATION SYSTEM MONITORING - SatCom Mission Planning
←
→
Page content transcription
If your browser does not render page correctly, please read the page content below

R&S®GSASLP
SATELLITE LINK PLANNER
R&S®GSACSM
COMMUNICATION SYSTEM
MONITORING
SatCom Mission Planning

Product Brochure
Version 02.00
R&S®GSASLP SATELLITE LINK
PLANNER
R&S®Satellite Link Planner is a SATCOM analysis and optimization software solution, covering all aspects of
modern satellite communications. R&S®Satellite Link Planner perfectly supports major parts of the SATCOM
value chain such as satellite system design, transmission planning and transponder usage optimization.
R&S®Satellite Link Planner accurately models weather conditions, atmosphere effects and covers all RF
transmission impairments of transparent payloads among all SATCOM bands of interest (C, X, Ku, Ka band
etc.). Major signal degradations due to intermodulation, power robbing are accurately modeled and verified
against vendor data and in orbit test campaigns.

Link budget calculation and optimization                       effective isotropic radiated power (EIRP) or the output
R&S®Satellite Link Planner helps engineers to simulate and     power. Additionally users can model the space segment
model the impact of dedicated transponder distortions on       as well by managing available satellites, transponders and
SATCOM carriers. In this respect the impact of dedicated       their footprints. R&S®Satellite Link Planner uses a wide
signal distortions on mission planning or payload design       data base for satellites and footprints to simplify the work
can be quantified in terms of carrier-to-noise ratio loss or   for the user.
capacity degradations. R&S®Satellite Link Planner link bud-
get calculations are based on a set of internationally rec-    Route planning and satellite payload optimization
ognized methods (ITU recommendations) which are often          R&S®Satellite Link Planner helps users planning mo-
required.                                                      bile SATCOM scenarios by managing route navigations.
                                                               Based on the given route and data rate requirements,
Satellite network planning and optimization                    R&S®Satellite Link Planner searches for the best pos-
Systems using R&S®Satellite Link Planner are capable to        sible transponders by following criteria e.g. the data rate
model ground stations with their specific parameters e.g.      requirements, the coverage of the transponder beams
the transmitting and receiving antenna gain, the maximum       which should provide coverage over the entire route or the
                                                               SATCOM band of interest (C, X, Ku, Ka band etc.).

Key facts                                                      Features and benefits
►   Link budget analysis of complex multi-carrier scenarios    Carrier scenario management
►   Modelling of transponder RF impairments                    ►   Managing, analyzing and optimizing carrier scenarios
    (intermodulation, power robbing, gain compression)         ►   page 4
►   Link budgets and transponder optimization to minimize
    power/bandwidth consumption of SATCOM scenarios            Ground station management
►   Ground station equipment and antenna management            ►   Modeling modems, ground stations and analyzing their
►   Antenna footprint visualization                                antennas
►   Satellite beacon reception analysis                        ►   page 6
►   Impairment calculation due to adjacent satellite
    interference (ASI)                                         Space segment management
►   Impairment calculation due to ITU weather                  ►   Modeling satellites, visualizing their footprint beams
    recommendations                                                and analyzing attenuation coverage
►   Route planning and optimization for mobile VSAT            ►   page 7
    terminals, SOTM (SATCOM on the move) or UAV
    operations                                                 Route management
►   Attenuation coverage analysis                              ►   Modeling communication routes and checking
►   Carrier planning over time and frequency                       necessary equipment
►   Adaptive graphical user interface & tailored special       ►   page 10
    purpose solutions
►   Data Import/Export, Geo-Positioning and satellite
    footprint visualization
►   Wide SATCOM modem database (SCPC, meshed, DTH,
    military CDMA/DSSS)

2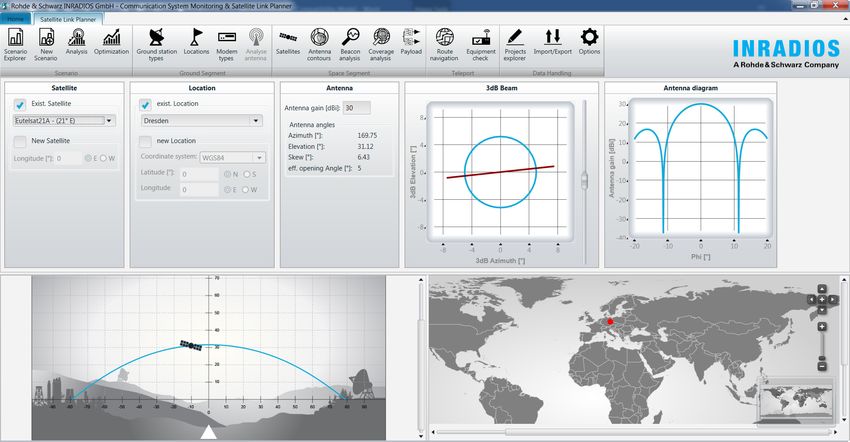
R&S®GSACSM COMMUNICATION
SYSTEM MONITORING
R&S®GSACSM communication system monitoring is a SATMON software solution for remote spectrum
monitoring and signal analysis. R&S®GSACSM comes with classic spectrum analyzer functions, trapping
systems, and advanced signal detection and identification algorithms. The modern, adaptive GUI makes it
easy to implement use cases e.g. interference identification or SatCom transponder analysis.

Remote spectrum monitoring                                      possible to detect wanted carriers with detailed informa-
R&S®GSACSM provides an interface for communicating              tion such as baud rate, modulation scheme, FEC rate, C/N
with remote spectrum analyzers via remote connections;          and carrier frequency offset. It is also possible to track and
users can access their devices from all over the world.         identify unwanted services.
R&S®GSACSM supports monitoring of signals for one
device at a time and for many different devices at once.        Carrier-in-carrier (CiC) detection
R&S®GSACSM also handles different users monitoring the          Systems using R&S®GSACSM can perform Carrier-in-
same device. Both a standalone application and a server/        carrier detection tasks, which are a major feature in mod-
client solution are available.                                  ern VSAT systems. Tasks such as paired carrier multiple
                                                                access (PCMA) detection and signal identification and
Satellite transponder monitoring                                under-carrier signal analysis can be executed to find un-
R&S®GSACSM autonomously scans transponder signals               wanted interferers in such systems. The R&S®GSACSM
and identifies carriers, e.g. DVB-S, DVB-S2 and DVB-CID.        integrates and extends the R&S®GSA1xxx VSAT intercept
Scanning and evaluating signals continuously makes it           solution by remotely providing analysis functions.

Key facts                                                        Features and benefits
►   Multichannel power measurement, history logging and          Carrier-in-Carrier (CiC) detection
    alarm trapping                                               ►   Identification of underlying signal sources by using
►   Classic software-based spectrum analyzer functions               carrier-in-carrier detection
►   Adaptive graphical user interface and tailored special       ►   page 11
    purpose solutions
►   Autonomous detection and identification of terrestrial       Autonomous spectrum scanning
    and satellite signals (e.g. GSM, DECT, DVB-S, DVB-S2)        ►   Autonomous spectrum scanning and carrier
►   Autonomous detection and identification of paired-               identification for satellite transponder monitoring
    carrier multiple access (PCMA) and time-division             ►   Autonomous, continuous spectrum scanning and
    multiple access (TDMA) signals                                   carrier detection and demodulation for DVB-CID signals
►   Autonomous detection and identification of under-            ►   page 12
    carrier signals
►   Autonomous detection and identification of DVB carrier       Easy implementation of complex use cases
    identification (DVB-CID) signals                             ►   page 14
►   Simultaneous operations on multiple remote spectrum
    analyzers                                                    Spectrum measurement tasks for interpreting signals precisely
►   Remote spectrum monitoring over narrowband low               ►   page 16
    latency connections
                                                                 Power monitoring, recording, replay, import and export
                                                                 ►   page 18

                                                                 Distributed network structure
                                                                 ►   page 20

                                   Rohde & Schwarz R&S®GSASLP Satellite Link Planner R&S®GSACSM Communication System Monitoring 3
CARRIER SCENARIO MANAGEMENT
Analyzing complex multi-carrier satellite link budget scenarios   Systems using R&S®Satellite Link Planner are able to cal-
easily                                                            culate link budgets for a wide range of satellite scenario
►   Link budget calculations based on ITU weather                 use cases by including ITU weather recommendations
    recommendations                                               (see also page 22) e.g. rain rate, gas attenuation or surface
►   Link budget calculations based on adjacent satellite          temperature. The table shows the entire propagation im-
    interference (ASI) and intermodulation                        pairments used by R&S®Satellite Link Planner which en-
►   Link budget calculations based on satellite bands             ables users to cover major atmospheric influences.
    e.g. X, C, Ka and Ku
►   PEB evaluation (power and bandwidth consumption)
►   Earth station EIRP evaluation
►   Total carrier availability calculation
►   Intermodulation power density analysis
►   Link margin calculations
►   Spread spectrum link analysis
►   Maximum acceptable pointing error analysis
►   CDMA link analysis (evaluating interference towards
    other non-CDMA carriers as well)
►   Following frequency coordination limits based on ITU
    radio communication
►   Modeling multi-carrier scenarios being analyzed
►   Clear visualization of the results with well-presented
    charts

Well-presented detailed carrier analysis results

4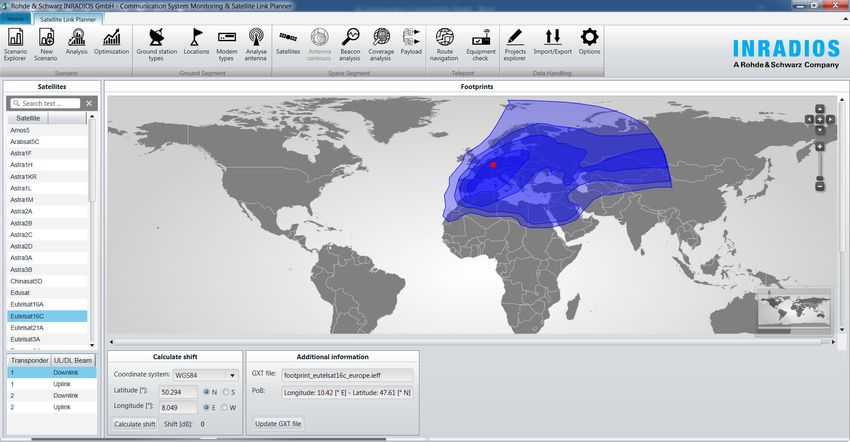
Additionally R&S®Satellite Link Planner covers ASI and           Optimizing complex multi-carrier satellite link budget
intermodulation occurring in downlink and uplink com-            scenarios easily
munications. On the one hand ground stations can receive         ►   PEB minimization due to EIRP adjustments of the
significant signal power levels from other satellites. On            individual carriers
the other hand adjacent satellite can receive and broad-         ►   Throughput maximization towards desired link
cast heavy uplink signals from ground stations. Both types           availability requirements (considering weather and
of disruption are included in the link budget calculations           atmospheric losses)
helping users to consider all possibilities which can occur      ►   Satellite beam EIRP optimization
through a transmission in satellite bands of interest.           ►   Symbol rate and MODCOD optimization of individual
                                                                     carriers
Besides SATCOM channel impairments R&S®Satellite Link            ►   Constraining of usable TWTA power and bandwidth
Planner uses frequency coordination limits defined for sce-      ►   Minimizing transponder resources (power, bandwidth)
nario optimization.                                                  for a given scenario.
                                                                 ►   Performing route (way point) optimization
The screenshot on page 4 shows an analyzed multi-carrier         ►   Performing equipment (dish size) optimizations
scenario with its carrier-to-noise ratio results in well-pre-
sented charts and diagrams containing calculations for the       R&S®Satellite Link Planner multi-carrier scenario optimiza-
described impairments.                                           tion provides a complete transponder allocation plan in-
                                                                 cluding ground segment parameters, modulation/coding
A detailed link budget analysis overview function is avail-      schemes per carrier and the space segment gain setting.
able as well as shown in screenshot on page 4. Here the          Multiple operational criteria are used to perform scenario
carrier-wise bandwidth and power consumption (PEB) is            optimization e.g. required BER, required link availability or
detailed presented.                                              frequency coordination limits. Though, users can easily op-
                                                                 timize the previously generated results from the analysis
Systems using R&S®Satellite Link Planner uses these link         process. Afterwards users can take the results to setup the
budget calculations to verify multi-carrier scenarios being      carrier configuration in real test scenarios.
managed by the user as shown in the screenshot below.
Users can easily generate their own multi-carrier scenarios
with all necessary parameters that way.

Managing multi-carrier scenarios

                                    Rohde & Schwarz R&S®GSASLP Satellite Link Planner R&S®GSACSM Communication System Monitoring 5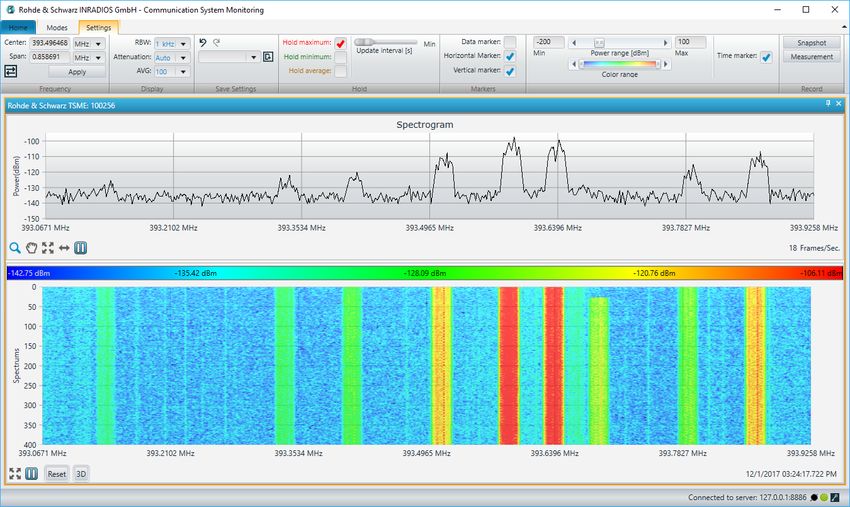
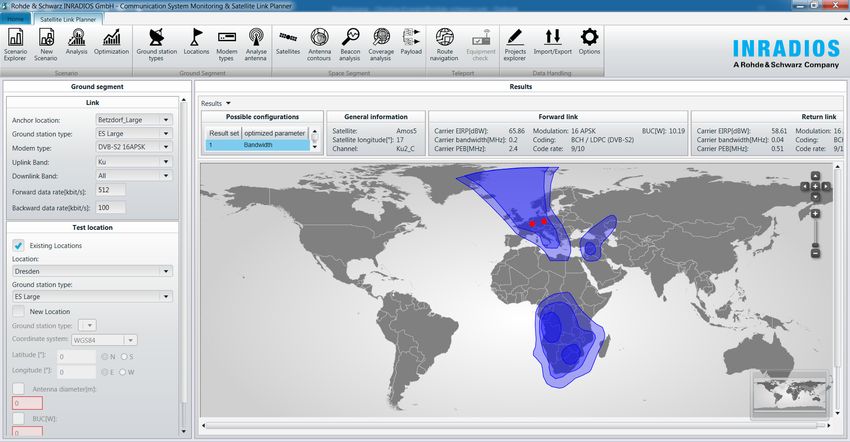
GROUND STATION MANAGEMENT
Modeling ground stations, modems and antenna radiation           Systems using R&S®Satellite Link Planner can add and
patterns                                                         modify ground station types, geographic locations and
►   Managing ground stations with their parameters and           modem types which give users the ability to create a wide
    geographic locations                                         variety of ground stations being used for multi-carrier sce-
►   Calculating the losses due to a pointing error entered in    nario analysis. SLP users can simply visualize the antenna
    degrees or simply by means of an dB antenna gain loss        gain results in the sidelobes and take this result to the
►   Calculating the impact of a rotation of the antenna          corresponding EIRP limit based on frequency regulation
    reflector with respect to the GEO plane on the effective     limits.
    antenna gain and discrimination
►   Calculating and visualizing of ASI and interference limits
    based on frequency regulation limits

Antenna diagram modeling and interference analysis

6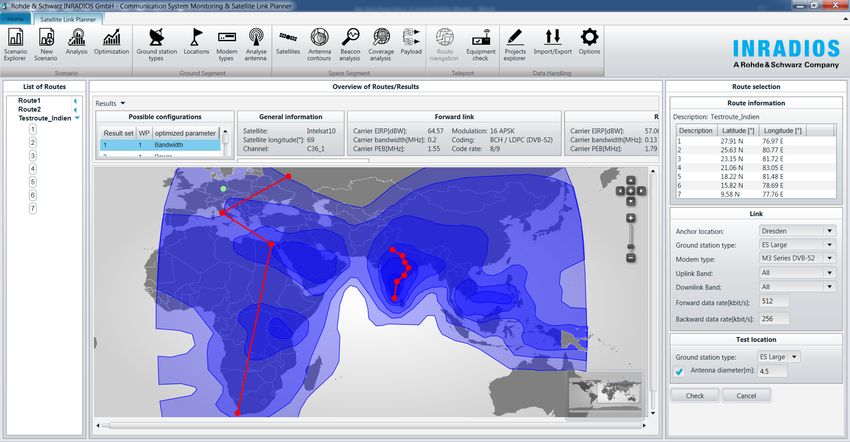
SPACE SEGMENT MANAGEMENT
Parameterizing satellite objects for individual use cases             Geographical information is one of the most important as-
►   Visualizing geographical information of satellite                 pects in SATCOM link planning and optimization. It cov-
    coverage                                                          ers coverage information of satellite antennas as well as
►   Creating and populating satellite objects                         ephemerides data and geo-location data of earth stations.
                                                                      Systems using R&S®Satellite Link Planner can visualize lo-
                                                                      cations and antenna footprints as shown in FIG 1 which
                                                                      gives a neat overview of all available footprints for the
                                                                      user.

                                                                      The user will also have the capability of creating and pop-
                                                                      ulating its own personal satellite objects, which shall be
                                                                      saved using persistent services.

FIG 1: Antenna footprint visualization

                                         Rohde & Schwarz R&S®GSASLP Satellite Link Planner R&S®GSACSM Communication System Monitoring 7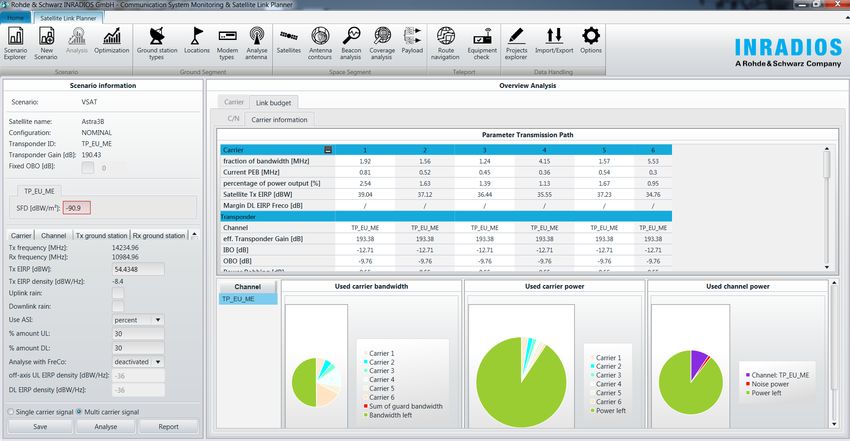
Modeling and simulating transponders                                                     ►   Calculating the IBO/OBO directly out of a given scenario
►   Import IBO/OBO curve by means of text files                                              (see screenshot)
►   Automatic calculation of multi-carrier IBO/OBO curve                                 ►   Linear distortions due to filter gain/group delay slope
►   Using and visualizing typical IBO/OBO curves for                                     ►   Intermodulation effects
    linearized and non-linearized tubes
►   Assigning a desired IBO/OBO value pair to the
    transponder

IBO/OBO charts and gain vs. IBO charts for a non-linearized TWTA in single carrier and multi-carrier operation mode

Footprint visualization and rain attenuation visualization

8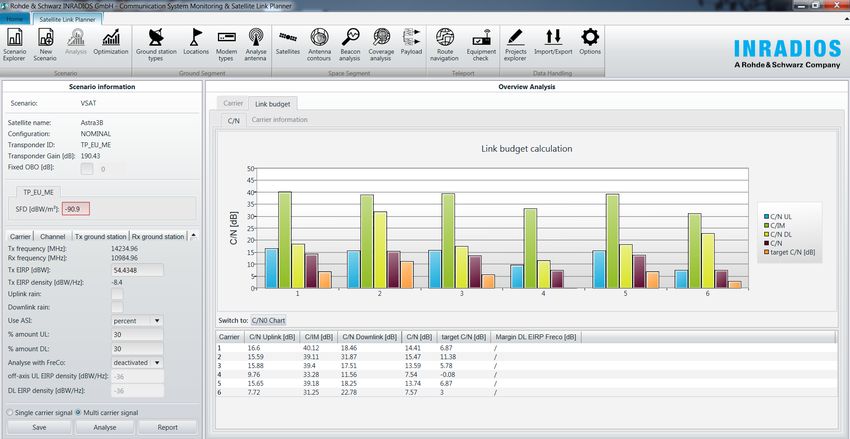
From the IBO/OBO charts R&S®Satellite Link Planner de-                Optimizing satellite and transponder equipment
rives the TWTA gain for both operation modes (right)                  ►   Checking uplink and downlink data rate
where the gain-loss in the multi carrier mode becomes vis-            ►   Checking modem types used
ible. If no dedicated curve is available, R&S®Satellite Link          ►   Checking anchor station and remote station
Planner provides typical curves for linearized and non-lin-               (e.g. a VSAT terminal)
earized TWTAs. The user can also simply assign a desired              ►   Checking used bands (e.g. C, X, Ku, Ka)
IBO/OBO pair for any transponder if required.
                                                                      R&S®Satellite Link Planner equipment optimization pro-
Performing and visualizing satellite coverage analysis                vides the best suited satellite equipment and transponder
►   Analyzing impairment coverage e.g. for rain based on a            to meet a given user data rate requirement as given in the
    given antenna footprint                                           screenshot below. Users can define the required PEB con-
►   Visualizing coverage results clearly to the user                  sumption if a dedicated transponder is used. Thus all tran-
                                                                      sponders which are proposed by the optimization func-
Coverage analysis can be performed as depicted in the                 tions are checked to ensure full coverage of the uplink and
screenshot on page 8. Here, the rain attenuation is dis-              downlink footprints. Antenna size, modem type and BUC
played by means of a color code which is overlaid over the            power of remote equipment can be defined as well and
footprint, taking input parameters such as (signal frequen-           will be taken for the equipment check. Finally a bandwidth
cy, desired link availability, footprint file etc.).                  and power optimized setting is proposed by R&S®Satellite
                                                                      Link Planner.

Equipment and transponder optimization

                                         Rohde & Schwarz R&S®GSASLP Satellite Link Planner R&S®GSACSM Communication System Monitoring 9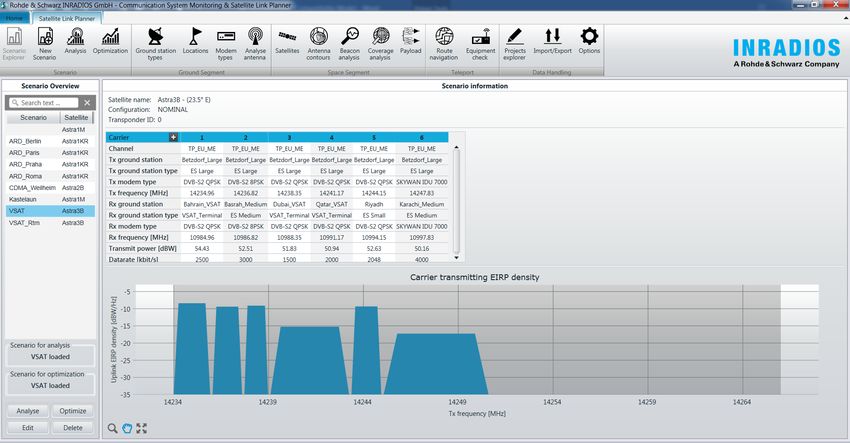
ROUTE MANAGEMENT
Planning and optimizing navigation routes R&S®Satellite Link Planner route planning and optimization
► Checking uplink and downlink data rate allows users to find the best suited transponder and car-
► Checking modem types used rier settings for a given geographical route. The screenshot
► Checking anchor station and remote station shows this feature where a (SATCOM on the move) SOTM
(e.g. a VSAT terminal) route through Afghanistan is assigned. Routes can be eas-
► Checking used bands (e.g. C, X, Ku, Ka) ily configured manually through the GUI.
SATCOM route planning and optimization, preparations before optimization run
10CARRIER-IN-CARRIER DETECTION
Identifying of underlying signal sources via carrier-in-carrier Identification of suspicious interferers using under-carrier
detection detection
PCMA detection and signal identification The R&S®GSA1400/10 CiC separator’s under-carrier detec-
Systems using R&S®GSACSM are able to detect and tion feature can be used to detect and identify unwanted
identify paired carrier multiple access signals. The asymmetric signal sources beneath a useful signal. The re-
R&S®GSA1400/20 CiC separator detects, identifies, modulated signals and all necessary signal parameters are
processes and receives PCMA signals. clearly presented, making it easy to correctly interpret the
measurement results.
This is an essential feature of the R&S®GSA1xxx VSAT in-
tercept solution. It makes it possible to intercept signals
transmitted using paired carrier multiple access technol-
ogy or asymmetric carrier-in-carrier in a duplex link.
Under-carrier detection and identification
Rohde & Schwarz R&S®GSASLP Satellite Link Planner R&S®GSACSM Communication System Monitoring 11AUTONOMOUS SPECTRUM
SCANNING
Autonomous spectrum scanning and carrier identification for Huge variety of standards and types of modulation can be
satellite transponder monitoring identified (DVB-S, DVB-S2, IESS, GSM, etc.)
Clear visualization of constellation diagrams and signal All collected signal parameters and the constellation dia-
parameters per carrier gram are displayed so that the user sees all necessary de-
The R&S®GSACSM classification feature enables systems tails at a glance. Since users may not be able to determine
to autonomously scan spectrum signals and identify car- the actual signal class, the table clearly shows the detec-
riers. Carriers are visualized in color-coded charts and in tion and classification features.
lists. The chart and list elements make it easy to identify
each carrier. The sniper tool lets users add new areas to
select a specific carrier for further processing.
Detection/classification features Supported standards
SatCom VSAT, SCPC standards, CID
Carrier-in-Carrier double-talk and others
Terrestrial GSM, etc.
M-QAM, M-DPSK, M-FSK, OFDM,
Modulation
DSSS, CDMA
DVB-CID Carrier ID
Signal detection and identification
12Autonomous, continuous spectrum scanning and carrier Clear visualization of CID parameters
detection and demodulation for DVB-CID signals (global unique ID, GPS coordinates, etc.)
Autonomous detection and identification of CIDs for SatCom Systems using R&S®GSACSM can handle CID signals,
signals i.e. they will be detected and then demodulated. The CID-
Modern satellite communications has to deal with a lot of specific “global unique ID”, the GPS coordinates and the
signal interference that needs to be efficiently avoided. The telephone number are extracted. The global unique ID al-
Digital Video Broadcasting organization specified a carrier lows customers to identify their satellite signal precisely.
ID (CID) that identifies the host carrier, effectively reducing
interference between satellite signals, e.g. DVB-S2.
Manufacturer
Description
(TDMA)
LINKWAY, LINKWAY2, SURFBEAM,
VIASAT
SKYLINXDDS
DASA-SKYWAN (IDU 200, 3000, 5000)
NORTEL
DASA-SKYWAN (IDU 7000)
Manufacturer (SCPC) Description POLARSAT
VSATPLUS II
COMTECH LDPC 2/3 VSATPLUS III
NERA SATLINK
LDPC 3/4
SKYBLASTER, FARAWAY, SKYEDGE,
VersaFEC 0.642L GILAT
SKYEDGE II, DIALAWAY, SKYSTARVARIANT
VersaFEC 0.789L HUGHES DIRECWAY (IPoS), PE5
VersaFEC 0.803 SHIRON INTERSKY
IDirect TPC 0.793 Infinity COMTECH SKYWARE
Radyne TPC 3/4 VSAT defacto SATNET ADVANTECH/EMS
TAYCHON NETWORK
- (unknown) TPC 3/4 TAYCHON
SYSTEMS
- (unknown) TPC 7/8 NEXTAR48 (IC), NEXTAR4A (OC), NEXTAR
NEC
- (unknown) TPC 7/8 VSAT defacto Bandwidth On Demand, NEXTARV0
CSM list supported SCPC CSM list supported TDMA
DVB carrier identification detection and demodulation
Rohde & Schwarz R&S®GSASLP Satellite Link Planner R&S®GSACSM Communication System Monitoring 13EASY IMPLEMENTATION OF COMPLEX USE CASES Clear views of spectrum displays and measurement results The R&S®GSACSM has a modern style similar to other common applications. This makes it easy to use; even new users can obtain meaningful results. Signal markers provide quick, smart overview of signal parameters Power values can be shown by adding markers to the chart as shown in the screenshot below. Easy instrument alignment 14
Multi-device monitoring with docking manager function                         Multi-user monitoring
The R&S®GSACSM allows simultaneous monitoring of                              Systems using R&S®GSACSM allow multiple users to con-
multiple devices. Parallel monitoring is shown in the                         nect to a single device at the same time. To avoid race
screenshot on the left, where two devices are displayed                       conditions, device settings can only be changed by the
side by side. This makes it easy to see the uplink and                        first user connected to the device. A second user can only
downlink signal at the same time.                                             view the measurement results.

Clear views of measurement results and signal parameters

                                               Rohde & Schwarz R&S®GSASLP Satellite Link Planner R&S®GSACSM Communication System Monitoring 15
SPECTRUM MEASUREMENT TASKS FOR INTERPRETING SIGNALS PRECISELY Spectrogram for identifying signal parts by in color-coded Alarm trapping helps identify suspicious signals automatically waterfall charts The R&S®GSACSM is capable of setting alarm thresholds Systems using R&S®GSACSM are able to monitor the to inform users when unwanted signals occur. Users can power spectral density of any spectrum analyzer input sig- define spectrum signal masks to ensure that every suspi- nal. This helps to identify potential unwanted signal sourc- cious carrier is immediately identified. es. The spectrogram feature illustrates this with 2D and 3D waterfall charts. Spectrum density for identifying sporadic signal parts The spectrum density measurement feature monitors time- varying and superimposed signals by capturing and ana- lyzing continuous spectrums over time. Rare or super-im- posed events that cannot be detected using the ordinary spectrum analyzer functions can be visualized in a spec- trum density chart. 2D and 3D spectrogram 16
Spectrum density view

Alarm trapping with signal masks

                                   Rohde & Schwarz R&S®GSASLP Satellite Link Planner R&S®GSACSM Communication System Monitoring 17
POWER MONITORING, RECORDING,
REPLAY, IMPORT AND EXPORT
Easy power monitoring via multichannel service tables Easily record and replay spectrum signals
Systems using R&S®GSACSM monitor RF power by using Systems using R&S®GSACSM can record, replay and
multichannel service tables. This feature helps users who exchange measurements to view and process records
are unfamiliar with spectrum signals. The service table bar offline.
chart also helps visualize the RF power in a certain band.
Quickly import and export records to and from R&S®GSACSM
Easy power monitoring over a certain amount of time To make it easier to share records, records can be export-
Another way to support power measurement tasks is to ed and imported so that users can easily analyze each oth-
use the R&S®GSACSM power monitoring feature. It can be er’s measurements.
used to monitor the RF power of various subbands in par-
allel over a defined amount of time. Users can easily add Offline signal processing with the file device feature
new power subbands, which will be displayed in the spec- Records can be replayed for offline analysis.
trum chart. For each power subband, a new power time
chart will be generated displaying the overall RF power in
a certain interval.
Power monitoring with service tables
18Power monitoring over a defined amount of time
Replay of a previously recorded measurement
Rohde & Schwarz R&S®GSASLP Satellite Link Planner R&S®GSACSM Communication System Monitoring 19DISTRIBUTED NETWORK STRUCTURE
Scalable client/server architecture Simultaneously managing different receivers and analyzers
In a scalable client/server architecture, R&S®GSACSM R&S®GSACSM supports the following Rohde & Schwarz
allows remote spectrum analysis in distributed systems. sensor instruments:
Operators can manage their instruments (RF components, ► R&S®TSME6 ultracompact drive test scanner
e.g. R&S®NRQ6) in different locations. ► R&S®FSW signal and spectrum analyzer
► R&S®FPS signal and spectrum analyzer
► R&S®FSV and R&S®FSVA signal and spectrum analyzer
► R&S®FPL spectrum analyzer
► R&S®FPL spectrum analyzer
► R&S®ESMD wideband monitoring receive
► R&S®ESME wideband monitoring receiver
► R&S®NRQ6 frequency selective power sensor
► R&S®MSR200 dual satellite receiver
Examples of standalone and clientserver scenarios
R&S®NRQ6 R&S®NRQ6 R&S®NRQ6
power sensor power sensor power sensor
R&S®FPS signal and
spectrum analyzer
CSM server CSM server
R&S®FSW signal and
CSMspectrum
user analyzer CSM user
Site 1 Site 2
R&S®NRQ6
power sensor
R&S®TSME drive
test scanner
CSM server
R&S®GSACSM GUI R&S®GSACSM GUI
R&S®GSACSM GUI R&S®GSACSM GUI
Site 3 R&S®GSACSM GUI
1. Standalone 2. Shared sensor 3. Shared sensor
instruments, single-user instruments, multi-user
20TCP/IP ACCELERATION MIDDLEWARE
Remote spectrum monitoring over narrowband links and long
latency links
The R&S®GSACSM executes remote spectrum monitoring
tasks even over narrowband and low latency connections
such as satellite links, ensuring data communications be-
tween servers and sensors (see figure below).
Communication over narrowband and low latency connections
Near Far
Sensor Sensor
Server Server
User Data storage User Data storage
Rohde & Schwarz R&S®GSASLP Satellite Link Planner R&S®GSACSM Communication System Monitoring 21SPECIFICATIONS
Common specifications
CPU and operating system x86 CPU, Windows 7 or newer
.Net Framework required .Net Framework version 4.5
Min. HDD space required for installation 500 Mbyte
RAM required min. 1 Gbyte, 2 Gbyte recommended
Sensor interfaces supported LAN/WLAN connection, USB port optional
R&S®GSASLP specifications
Application domains SATCOM transponder modeling and carrier link budget analysis
SATCOM operations, definition of modulation and coding
SATCOM transponder optimization
Required impairment ITU recommendation
Rain rate calculation ITU-R Rec. P 837-6
Rainfall height calculation ITU-R Rec. P 839-3
Specific attenuation due to rain calculation ITU-R Rec. P 838-3
Rain attenuation, frequency scaling, scintillation ITU-R Rec. P 618-10
Gas attenuation calculation ITU-R P Rec. 676-9 and Rec. P 836-4
Cloud attenuation calculation ITU-R Rec. P 840-4
Surface temperature calculation ITU-R Rec. P 1510
Earth station height above sea level ITU-R Rec. P 1511
R&S®GSACSM specifications
Spectrum mode live measurement with spectrum analyzers
Spectrogram mode 2D and 3D waterfall spectrum analysis
Spectrum density mode spectrum frequency occurrence analysis
Mask mode alarm trapping with email notification
Classification mode basic detection and identification of terrestrial, satellite, TDMA and PCMA signals
Under-carrier detection mode advanced signal analysis for underlying interfering signals
Satellite mode continuous scanning, identifying and alarm trapping for satellite signals
DVB-CID continuous scanning for DVB-CID signals
Scope mode I/Q data display
Multichannel power mode power monitoring via service tables
Power monitoring mode power monitoring in a specific frequency band over a certain time
Recording record, replay, export and import measurements
Offline processing load I/Q data files to detect and demodulate signals offline
Supported Rohde & Schwarz sensor instruments R&S®TSME6 ultra compact drive test scanner
R&S®FSW, R&S®FPS, R&S®FSV signal and spectrum analyzers
R&S®FSC, R&S®FSL spectrum analyzers
R&S®NRQ6 frequency selective power sensor
R&S®MSR200 dual satellite receiver
Supported Rohde & Schwarz system solutions VSAT solution provided by Rohde & Schwarz
Software signal processing bandwidth determined by I/Q bandwidth of sensor in usage
Max. simultaneous users per CSM server not limited, practically limited by the processing capabilities of the CPU
Max. simultaneous sensors connected to the CSM server not limited, practically limited by the processing capabilities of the CPU
supports CSM measurements with remote sensors over long latency low throughput
TCP/IP acceleration
links, e.g. data rate < 10 kbit/s, latency > 1 s
► SatCom transponder monitoring and carrier analysis
► Identification/classification of unknown signals
► Under-carrier signal analysis and demodulation
Application domains
► SatCom operations with alarming/trapping functions
► 24/7 power monitoring of carriers
► DVB-CID carrier ID demodulation
22ORDERING INFORMATION
Designation Type Order No.
SLP
Satellite Link Planner R&S®GSASLP 3065.3555.02
CSM base packages
CSM standalone software R&S®GSACSMSTA 3065.3532.02
CSM server software R&S®GSACSMSVR 3065.3526.02
CSM client software R&S®GSACSMCLNT 3065.3510.02
CSM server for Linux operating system R&S®GSACSMNCS 3069.3895.02
CSM modes
CSM X-Pol measurement mode R&S®GSACSMXPOL 3065.3503.02
CSM analysis mode R&S®GSACSMANA 3065.3490.02
CSM power monitoring mode R&S®GSACSMPOWR 3065.3484.02
CSM measurements option R&S®GSACSMMEAS 3065.3478.02
CSM remote access R&S®GSACSMREMT 3065.3461.02
CSM HF path measurements R&S®GSACSMPATH 3069.3889.02
Advanced signal analysis for CSM analysis mode option (R&S®GSACSMANA)
CSM classification and analysis of TETRA signals R&S®GSACSMCTER 3065.3455.02
CSM classification SatCom R&S®GSACSMCSAT 3065.3432.02
CSM classification carrier-under-carrier analysis R&S®GSACSMCCUC 3065.3426.02
CSM classification paired carrier detection R&S®GSACSMCPCD 3065.3410.02
Rohde & Schwarz R&S®GSASLP Satellite Link Planner R&S®GSACSM Communication System Monitoring 23Rohde & Schwarz
Service that adds value The Rohde & Schwarz electronics group offers innovative
► Worldwide solutions in the following business fields: test and mea-
► Local und personalized surement, broadcast and media, secure communications,
► Customized and flexible cybersecurity, monitoring and network testing. Founded
► Uncompromising quality
► Long-term dependability more than 80 years ago, the independent company which
is headquartered in Munich, Germany, has an extensive
sales and service network with locations in more than
70 countries.
www.rohde-schwarz.com
Sustainable product design
► Environmental compatibility and eco-footprint
► Energy efficiency and low emissions
► Longevity and optimized total cost of ownership
Certified Quality Management Certified Environmental Management
ISO 9001 ISO 14001
Rohde & Schwarz training
www.training.rohde-schwarz.com
Rohde & Schwarz customer support
www.rohde-schwarz.com/support
5216326612
R&S® is a registered trademark of Rohde & Schwarz GmbH & Co. KG
5216.3266.12 02.00 PDP 1 en
Trade names are trademarks of the owners
PD 5216.3266.12 | Version 02.00 | April 2020 (ja)
R&S®GSASLP Satellite Link Planner R&S®GSACSM Communication System Monitoring
Data without tolerance limits is not binding | Subject to change
© 2019 - 2020 Rohde & Schwarz GmbH & Co. KG | 81671 Munich, GermanyYou can also read