Relationships between Linear Sprint, Lower-Body Power Output and Change of Direction Performance in Elite Soccer Players - MDPI
←
→
Page content transcription
If your browser does not render page correctly, please read the page content below
International Journal of
           Environmental Research
           and Public Health

Article
Relationships between Linear Sprint, Lower-Body
Power Output and Change of Direction Performance
in Elite Soccer Players
Monika Papla, Michal Krzysztofik * , Grzegorz Wojdala , Robert Roczniok , Marcin Oslizlo
and Artur Golas
 Institute of Sport Sciences, The Jerzy Kukuczka Academy of Physical Education in Katowice, 40-065 Katowice,
 Mikolowska 72a, Poland; m.papla15@gmail.com (M.P.); wojdala.grzegorz@gmail.com (G.W.);
 r.roczniok@awf.katowice.pl (R.R.); m.oslizlo@awf.katowice.pl (M.O.); a.golas@awf.katowice.pl (A.G.)
 * Correspondence: m.krzysztofik@awf.katowice.pl

 Received: 17 July 2020; Accepted: 21 August 2020; Published: 22 August 2020

 Abstract: The aim of this study was to investigate the relationship between linear sprint, power output
 obtained during a squat and change of direction (COD) performance. Fifteen elite soccer players
 participated in this study (age = 21.7 ± 0.72 years, body mass = 74.9 ± 9.11 kg, body height = 180.4 ± 7 cm,
 training experience = 9 ± 1.5 years). To examine these correlations a following battery of tests were
 carried out: 20-m linear sprint, one-repetition maximum (1RM) squat strength, peak power output
 obtained during a squat at 50% 1RM and time obtained in two 20-m COD tests with different angles of
 direction change (90◦ and 135◦ ). In addition, COD deficits (90◦ -CODDEF and 135◦ -CODDEF ) for both
 COD tests were calculated. The Spearman’s rank order correlation showed a nearly perfect statistical
 relationship between the 90◦ -COD and the 90◦ -CODDEF (r = 0.9; p < 0.001). In the case of 90◦ -CODDEF ,
 there was a large statistical relationship with 135◦ -CODDEF (r = 0.59; p = 0.021). Moreover, there was
 a nearly perfect statistical relationship between 135◦ -COD and 135◦ -CODDEF (r = 0.91; p < 0.001).
 The statistically insignificant (p > 0.05) relationship between 20-m linear sprint time, power output
 obtained during a squat at 50% 1RM, 1RM squat strength level and both COD test, as well as both
 COD deficits were found. Results of the present study showed that 20-m linear sprinting speed, 1RM
 squat strength, power output obtained during squat at 50% 1RM and COD ability at 90◦ and 135◦
 angles, are separate physical qualities. Moreover, it seems that COD deficit provides a more isolated
 measure of COD ability than the COD tests alone and does not must be limited to a specific angle,
 but provides knowledge about the COD ability in a range of other angles, at least concerning 90◦ and
 135◦ COD angles.

 Keywords: agility; COD deficit; squat power; team sports; speed

1. Introduction
     Most team sports require players to jump, sprint and change direction very frequently; such sports
include American football, rugby and soccer [1,2]. During a soccer match, players make over
700 turns with different changes of direction (COD) [3], as well as numerous jumps and sprints [4].
During a COD, athletes’ ability to accelerate, decelerate and reaccelerate in a new direction requires
a rapid application of force. The acceleration phase in COD and linear sprint involves similar technical
factors, so improving acceleration capability may be beneficial in terms of accelerating quickly after
successive COD maneuvers and transition between them. Hence, it can be assumed that linear
speed and lower-body power output may affect COD performance. Given that, many researchers
examined the relationship between the performance of the above mentioned high-intensity actions

Int. J. Environ. Res. Public Health 2020, 17, 6119; doi:10.3390/ijerph17176119    www.mdpi.com/journal/ijerph
Int. J. Environ. Res. Public Health 2020, 17, 6119                                                    2 of 9

and reached varying degrees of association, further studies seem justified [5–10]. Previous studies
indicate a statistically significant large to very large relationships between linear sprints and different
COD sprints (45◦ , 60◦ , 90◦ and 135◦ changes of direction) at various distances [7–9,11]. Additionally,
Suarez-Arrones et al. [10] showed a statistically significant moderate and large relationship between
10-m linear sprint and equal distance different COD sprints (90◦ and 180◦ ; respectively). At the same
time, Loturco et al. [9] revealed no statistically significant relationship between 100◦ COD test and
linear sprints at 5 m, as well as on 10 m.
      Profiling of COD performance is difficult due to a variety of tests used in research. Certain COD
tests differing in length, angle and a number of direction changes. Therefore, they may have different
physical and mechanical requirements. In regards to the COD angles, as suggested by Falch et al. [12]
and Bourgeuis et al. [13] angels below 90◦ are more velocity-oriented in contrast to the angles above 90◦ ,
which are more force-oriented. Consequently, it can be assumed that COD performance with the angles
below 90◦ and that which exceeding 90◦ should be measured and trained separately. Regarding the
number of direction change, a majority of COD tests consists of two or more turns [14], however in case
of soccer players, it is rare to change direction more than three times during matches [15]. With respect
to the fatigue caused by hundreds of COD during a soccer match, the use of COD tests with several or
repeated COD tests seems warranted when the COD ability is assessed among soccer players.
      The solution that can shed new light on the assessment of COD ability, is a measurement of
COD deficit. However, to date little attention has been given to the relationship between COD deficit
and the performance of the high-intensity actions and COD tests [2,10,15,16]. The COD deficit is
an additional time that athletes need, to complete running with a COD in comparison to straight-line
sprint at the same distance (e.g., athlete’s 20-m sprint time is subtracted from the 20-m COD time).
This difference in time allows to better isolate and identify an athlete’s ability to change direction [2].
The lower the value, the greater the COD ability. A study by Nimphius et al. [2] showed a statistically
significant positive relationship between COD deficit (measured as the difference between 10-m sprint
time and 180◦ COD test) and COD test (505), but not with 10- and 30-m sprint time in male cricketers.
In contrast, Loturco et al. [15] did not find a statistically significant relationship between COD deficit
(measured as the difference between 20-m linear fly sprint and 100◦ COD test) and 100◦ COD test.
However, the authors indicated a statistically significant positive moderate relationship between COD
deficit and relative mean propulsive power obtained in the half-squat and sprint velocity at five meters.
Furthermore, a large and nearly perfect relationship was found between 10- and 20-m linear flying
sprint and COD deficit among elite soccer players. Moreover, Loturco and colleagues [15] found
statistically significant positive large and nearly perfect relationship with 10-m and 20-m linear flying
sprint, respectively. In reference to the Nimphius et al. [2], the COD deficit may be specific to the angle
and, as shown by the results of previous studies, may also for the length of run, discipline and the type
of start (standing vs. flying). Therefore, in order to increase the versatility of this measure, there is
a need for research which compare the COD tests and COD deficits with different direction change
and running length in the same group of athletes.
      Therefore, the aims of this study were to examine the relationships between a 20-m linear sprint,
1RM squat strength, peak power output obtained during a squat at 50% 1RM, 90◦ and 135◦ COD
tests. A second aim of this study was to analyze the possible relationships between the COD deficits
(using 90◦ and 135◦ COD time and 20-m sprint time) with all considered tests. It was hypothesized
that significant relationships between all measured variables will exist. The second hypothesis was
that peak power output obtained in the squat and 20-m linear sprint would be positively correlated
with the COD deficit and the magnitude of correlation will depend on the angle of change.
Int. J. Environ. Res. Public Health 2020, 17, 6119 3 of 9
2. Materials and Methods
2.1. Experimental Design
To examine the relationship between linear sprint, lower-body maximum strength and power
output as well as COD performance, the following tests were carried out: 20-m linear sprint,
one-repetition maximum (1RM) squat strength, peak power output obtained during a squat at 50%1RM
and two separate 20-m COD sprints, first with a 90◦ and the second with a 135◦ direction change angles.
To assess a more isolated measure of the COD performance, the COD deficits for both conducted tests
were calculated. Measurements were conducted on two different sessions, 72 h apart. Linear and
COD sprints were performed during the first session, and 72 h later the lower-body power output
was assessed.
2.2. Study Participants
Fifteen elite male soccer players from a professional team participated in the study (Second Polish
League) (age = 21.7 ± 0.72 years, body mass = 74.9 ± 9.11 kg, body height = 180.4 ± 7 cm,
training experience = 9 ± 1.5 years, 1RM squat = 200 ± 8.7 kg). The athletes were all full-time
professionals who trained daily. All athletes had valid medical examinations and showed no
contraindications to participate in physical fitness tests. The experimental sessions took place at
the beginning of the pre-season. The athletes were instructed to maintain their normal dietary
habits over the course of the study and not to use any supplements or stimulants for the duration
of the experiment. Moreover, they were informed verbally and in writing about the experimental
protocol, the possible risks and benefits of the study and the possibility to withdraw at any stage
of the experiment. All players gave their written consent for participation. The study protocol was
approved by the Bioethics Committee for Scientific Research (10/2018), at the Academy of Physical
Education in Katowice, Poland and performed according to the ethical standards of the Declaration of
Helsinki, 2013.
2.3. Testing Procedures
One week prior to starting the experimental sessions, all athletes were familiarized with the
testing procedures and 1RM test for the Keiser Squat exercise. The experimental sessions were carried
out at the same time of the day (between 9:00 and 11:00 a.m.) 72 h apart. Both sessions were preceded
by the same warm-up protocol, which included 5 min of jogging, dynamic stretching, a single attempt
of a 20-m linear sprint and two different COD sprints (90◦ and 135◦ ) at submaximal intensity and
2 sets of body-weight squats. During the first experimental session, the athletes performed a 20-m
linear sprint and 20-m COD sprints with two different turn angles (90◦ and 135◦ ). All sprint tests were
performed on an indoor court. The running times were recorded by two pairs of dual-beam Witty Gate
photocells (Microgate, Bolzano, Italy) with the measuring precision of 0.01 s. The intraclass correlation
coefficient for the test–retest reliability in times of linear sprinting and COD tests measured by used
photocells ranged from 0.96 to 0.99. In the second experimental session peak power output obtained
during a squat exercise at 50% 1RM was assessed using the Keiser Air 300 Squat pneumatic machine
(Keiser Corporation, Fresno, CA, USA). This value of the external load was chosen because it is the
lower value of the range that was indicated as optimal for obtaining the highest values of peak power
outputs during a squat exercise [17]. The Keiser pneumatic resistance system utilizes air-pressurized
resistance to maximize safety and allows for precision loading within one kilogram. The intraclass
correlation coefficient for the test–retest reliability in the peak power output during a squat exercise
measured by Keiser Air 300 Squat pneumatic machine was 0.97.
2.3.1. One-Repetition Maximum Test
One week before the first experimental session the 1RM squat exercise test was performed on the
Keiser Squat air pneumatic machine. After a standardized warm-up, the athletes performed 10, 6, 4 andInt. J. Environ. Res. Public Health 2020, 17, 6119 4 of 9
3 repetitions, starting at a load of 20 kg and progressing to 60–80% of their estimated 1RM. The first
testing load was set to an estimated 90% 1RM and was increased by 5–10 kg for each subsequent
attempt until the athlete was unable to perform a proper lift with a correct technique. The 1RM test
result was determined within 5 attempts, with 5 min of rest in between attempts. All testing was
performed with a constant tempo of movement [18,19]. The strength coaches were present throughout
the procedure of 1RM testing. The athletes started from an upright position, with the knees and hips
fully extended, the stance approximately shoulder-width apart with both feet positioned flat on the
floor in parallel or externally rotated to a maximum of 15◦ [20], hands were placed on the hand grips,
and this setting was carefully replicated on every lift. From this position, they were required to descend
until contact with the bench (without losing muscle tension) and then perform the concentric phase
of the movement in an explosive manner. The height of the bench allowed each athlete to descend
with the hips below the knee line to keep constant squat depth. No weight-lifting belts, shoes or other
supportive garments were permitted.
2.3.2. Linear Sprint Test
Int. J. Environ. Res. Public Health 2020, 17, x 4 of 9
Following the warm-up, all athletes performed 2 maximal 20-m linear sprints, interspersed with
5 min rest placed
intervals.on theThehandathletes
grips, and started withwas
this setting thecarefully
front foot placed
replicated 0.5 mlift.
on every behind theposition,
From this first timing gate,
to preventthey
anywere early triggering
required to descend of until
the contact
start gate. The
with the athletes
bench (withoutstarted whentension)
losing muscle readyand
to then
eliminate the
perform
reaction time the The
effect. concentric
fastest phase
timeoffrom the movement in an explosive
both attempts manner.for
was retained Thefurther
height ofanalysis.
the bench
allowed each athlete to descend with the hips below the knee line to keep constant squat depth. No
weight-lifting belts, shoes or other supportive garments were permitted.
2.3.3. Change of Direction Tests
2.3.2. Linear
Following Sprintlinear
the 20-m Test sprint test, the participants were provided with a 5 min rest interval
before completingFollowing the warm-up,
the COD all athletes
tests. The two CODperformed
tests 2consisted
maximal 20-m linear5-m
of four sprints, interspersed
sections markedwithwith cones
◦ 5 min
◦ rest intervals. The
◦ athletes
◦ started with the front foot placed 0.5 m behind the first timing gate,
set at 90 (90 -COD) and 135 (135 -COD), requiring the athletes to decelerate and accelerate as fast as
to prevent any early triggering of the start gate. The athletes started when ready to eliminate the
possible around
reactioneach cone (Figures
time effect. The fastest1time
andfrom
2). both
The attempts
playerswasexecuted
retainedtwo attempts
for further of each COD test with
analysis.
5 min rest intervals in between attempts and tests. The fastest time from each COD test was retained
for further2.3.3. Change of Direction Tests
analysis.
Following the 20-m linear sprint test, the participants were provided with a 5 min rest interval
2.3.4. Change ofcompleting
before Directionthe
Deficits
COD tests. The two COD tests consisted of four 5-m sections marked with
cones set at 90° (90°-COD) and 135° (135°-COD), requiring the athletes to decelerate and accelerate as
To provide a measure
fast as possible aroundof each
eachconeathletes’
(FiguresCOD
1 andability, an adapted
2). The players executedCOD deficit calculation
two attempts of each COD was used.
The COD deficit
test withfor both
5 min angles
rest (90in◦ -COD
intervals between and 135
attempts
DEF and◦ -COD
tests. The
DEF ) wastime
fastest calculated
from eachas follows:
COD 20-m linear
test was
−90◦ -COD
sprint timeretained for further 90◦ -CODDEF and 20-m linear sprint time −135◦ -COD for 135◦ -CODDEF.
for analysis.
Figure 1. Schematic
Figure 1. Schematic presentation
presentation of the
of the ◦ change
9090° change of
ofdirection
directiontest.test.
Circles represent
Circles the positions
represent of
the positions of
the photocells.
the photocells.
2.3.5. Lower-Body Power Output
Following the warm-up, a lower-body power output test was assessed using the squat exercise
performed on the Keiser Squat air pneumatic machine at 50% 1RM. The strength coaches were present
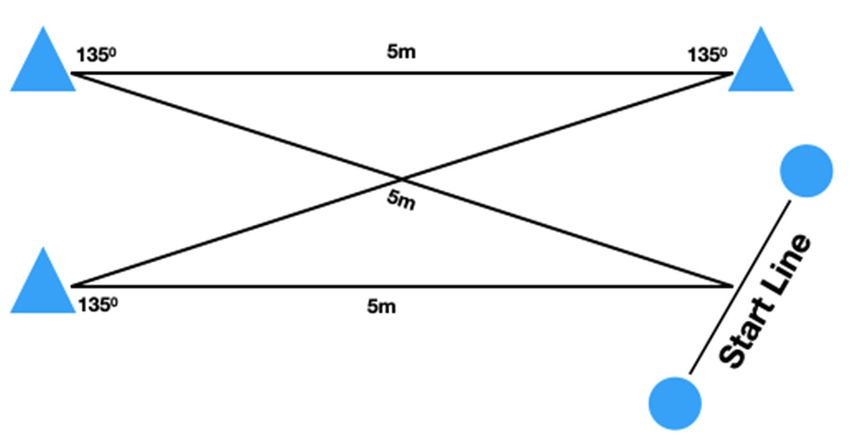
Figure 2. Schematic presentation of the 135° change of direction test. Circles represent the positions
of the photocells.Int. J. Environ. Res. Public Health 2020, 17, 6119 5 of 9
throughout the test to ensure safety and to carefully replicate the setting on each lift. All athletes were
instructed to perform the concentric phase of the movement as fast as possible. As during the 1RM
test, no weight-lifting supportive garments were permitted. The players executed two attempts of
Figure 1. Schematic presentation of the 90° change of direction test. Circles represent the positions of
lower-body power output with 5 min rest intervals in between. The best peak power output was
the photocells.
considered for further analysis.
Figure 2. Schematic presentation of the ◦ change of direction test. Circles represent the positions of
135135°
Figure 2. Schematic presentation of the change of direction test. Circles represent the positions
the photocells.
of the photocells.
2.4. Statistical Analysis
2.3.4. Change of Direction Deficits
All statistical analyses were performed using Statistica 9.1 (Hillview, Palo Alto, CA, USA).
The physical tests of this study were: 20-m linear sprint, 1RM squat strength, peak power output
in squat, 90◦ and 135◦ -COD tests and 90◦ and 135◦ -CODDEF . Data are presented as means and
standard deviations (SD) with 95% confidence intervals. The normality of the data were examined
by the Shapiro–Wilk test. Due to the lack of normal distribution of the studied variables (linear
sprint and 135◦ -COD), the Spearman’s rank order correlation was used to determine the relationship
between all conducted tests. Correlations were evaluated as follows: trivial (0.0–0.09), small (0.10–0.29),
moderate (0.30–0.49), large (0.50–0.69), very large (0.70–0.89), nearly perfect (0.90–0.99) and perfect
(1.0) [21]. The significance level for the correlation analysis was set as p < 0.05.
3. Results
Descriptive data for all the tests is shown in Table 1, while the Spearman’s rank order correlations
between all measured variables are presented in Table 2. There were no statistically significant
relationships between peak power output obtained during squat at 50% 1RM and all of the other
measured variables. Further, there were no statistically significant relationships between squat 1RM
and all of the other measured variables. Similarly, no statistically significant relationships between
linear sprint and all of the other measured variables were found. In regards to the 90◦ -COD there
was a nearly perfect statistically significant relationship with 90◦ -CODDEF (r = 0.9; p < 0.001). In case
of 90◦ -CODDEF , there was a large statistically significant relationship with 135◦ -CODDEF (r = 0.59;
p = 0.021). Moreover, there was a nearly perfect statistically significant relationship between 135◦ -COD
and 135◦ -CODDEF (r = 0.91; p < 0.001).
Table 1. Descriptive data for all measured tests.
Test Mean ± SD 95% CI
Squat 1RM (kg) 200 ± 8.7 192 to 208
Linear Sprint (s) 3.02 ± 0.1 2.97 to 3.08
90◦ -COD (s) 7.07 ± 0.25 6.93 to 7.2
135◦ -COD (s) 7.25 ± 0.28 7.09 to 7.4
90◦ -CODDEF (s) 4.04 ± 0.21 3.93 to 4.16
135◦ -CODDEF (s) 4.22 ± 0.24 4.09 to 4.35
Power Output Squat (W) 1408 ± 129 1337 to 1480
Mean ± standard deviation (SD); CI—confidence intervals; 1RM—one-repetition maximum; COD—change of
direction; CODDEF —change of direction deficit.Int. J. Environ. Res. Public Health 2020, 17, 6119 6 of 9
Table 2. Spearman’s rank order correlations between all measured variables.
Test Linear Sprint Power Output Squat 90◦ -COD 90◦ -CODDEF 135◦ -COD 135◦ -CODDEF Squat 1RM
Linear Sprint r /
Power Output Squat r −0.30 /
90◦ -COD r 0.43 0.09 /
90◦ -CODDEF r 0.15 0.07 0.90 ** /
135◦ -COD r 0.29 −0.30 0.33 0.38 /
135◦ -CODDEF r 0.05 −0.27 0.42 0.59 * 0.91 ** /
Squat 1RM r −0.16 −0.23 −0.17 −0.02 −0.05 −0.01 /
* statistically significant differences p < 0.05; ** statistically significant differences p < 0.01; r—Spearman’s rank order
correlation; COD—change of direction; CODDEF —change of direction deficit.
4. Discussion
The main finding of this study was that 1RM squat strength, peak power output obtained during
a squat at 50% 1RM and the 20-m linear sprint was not significantly correlated with each other and
with any of the measured COD tests. However, there was a nearly perfect statistical relationship
between the 90◦ -COD and 90◦ -CODDEF as well as between 135◦ -COD and 135◦ -CODDEF . Furthermore,
there was a large statistical relationship between 90◦ -CODDEF and 135◦ -CODDEF . The results indicated
that 20-m linear sprinting speed, 1RM squat strength and power output obtained during squat at 50%
1RM, as well as COD ability at 90◦ and 135◦ angles, are separate physical qualities. Moreover, it seems
that the COD deficit does not must be limited to a specific angle but provides knowledge about the
COD ability in a range of other angles, at least concerning 90◦ and 135◦ COD angles. Additionally,
these data suggests that the COD deficit provides a more isolated measure of COD ability than the
COD tests alone due to the reduced effect of linear sprinting speed within a COD test among elite
soccer players.
A wide range of studies has been conducted to determine the applicability of a given exercise that
leads to enhancement of specific athletic performance [22–25]. However, various resistance exercises
are significantly related to performance of selected physical fitness tests. The lack of a statistically
significant relationship between, 1RM squat strength and peak power output obtained in the squat
exercise at 50% 1RM and 20-m linear sprint, as well as with COD performance may be explained by
different mechanical demands of the hip and knee extensors executing these high-intensity actions.
A study by Contreras et al. [24] found that 6-week hip thrust training could be more beneficial
in improving 10- and 20-m linear sprint times compared with front squat training, which may be
superior in vertical jump height enhancement. In addition, González-García et al. [25] revealed that
strength improvement after 7-week hip thrust training showed greater improvements in 10- and 20-m
sprint, as well as in COD test (90◦ ) in comparison to back squat training [25]. It is possible that the
hip thrust has a stronger transfer to sprint running, whereas the squat has more influence on vertical
jump performance [24]. Furthermore, a lack of relationship between 20-m linear sprint time and peak
power output obtained in the squat at 50% 1RM may be related to the used external load and measured
variable. In the current study, the assessment of correlations is based only on a single value of external
load (50% 1RM; 100 ± 4.35 kg) and on peak power output. In turn, a study by López-Segovia et al. [26]
showed significant positive correlations with 10-, 20- and 30-m linear sprint time with mean power
output obtained in a full squat, but not with peak power output among soccer players. That relationship
was found only at 70 kg which was close to the body mass of participants (93%), but not at lower loads
(from 20 to 60 kg with 10 kg increments). While in the present study, the external load used during the
squat significantly exceeded the body mass of participants (~133%). These findings partially confirm
the suggestion of López-Segovia et al. [26] that certain levels of neuromuscular activation, assessed by
mean power output generated at loads to body may be related with linear sprint performance. Thus,
future studies should examine the relationship between hip thrust and squat exercises at a wide range
of external loads versus linear sprint, as well as COD performance.
To the best of the authors’ knowledge, a limited number of studies have analyzed the relationship
between linear sprint and the COD deficit among soccer players [15,27,28]. Findings of the currentInt. J. Environ. Res. Public Health 2020, 17, 6119 7 of 9
study revealed that 20-m linear sprint time was not statistically significant related to both COD deficits,
what is contradict to findings of Loturco et al. [15]. The authors showed a statistically significant
nearly perfect positive relationship between 100◦ COD deficit and 20-m flying start linear sprint
in team-sport athletes. Moreover, Loturco et al. [15] found a statistically significant large positive
relationship between 100◦ COD deficit and 10-m flying start linear sprint. Unfortunately, Loturco and
colleagues [16] did not assess whether these results would be similar in the case of a linear sprint from
the standing start. At the same time, Loturco et al. [28] revealed differences in the COD deficit between
elite soccer players versus handball, rugby and futsal players. The COD deficit was significantly
higher in soccer players in comparison with the remaining disciplines, which could be explained by
the nature of these sports. It is important to note, that most COD-runs occur with angles between
0 and 90◦ (approximately 84%), with the next most common range of 90–180◦ (approximately 13%)
in soccer players [3]. Therefore, the use of angles greater than 90◦ in COD tests should be considered
with logical validity when the goal is to assess the relationships between high-intensity actions and
COD performance among soccer players. However, angles greater than 90◦ occur much less frequently
in a match, this should not be ignored, and players must also be prepared for such maneuvers.
Therefore, the assessment of the relationship between COD tests and COD deficits with different
angles, also exceeding 90◦ , seems justified from the training practice point of view. In the current
investigation, there was a nearly perfect statistical relationship between performances in the COD
tests and COD deficits for the same angles (90◦ -COD and 90◦ -CODDEF ; 135◦ -COD and 135◦ -CODDEF ).
These results are in line with previous findings obtained by Nimphius et al. [2]. The authors revealed
a large statistically significant relationship between the COD deficit and COD test time (505 test).
Furthermore, there was a large statistically significant relationship between COD deficits between
angles (90◦ -CODDEF vs. 135◦ -CODDEF ), while it was not the case for COD test (90◦ -COD vs. 135◦ -COD).
The rationale for that results may be similar mechanical requirement between COD angles suggested
by the Falch et al. [12] and Bourgeuis et al. [13], that angles below 90◦ are more velocity-oriented,
while angles above 90◦ are more force-oriented. These data provides further support for the use of
a COD deficit to evaluate an athlete’s COD ability, as it removes the influence of linear running speed
on such tests. Therefore, it seems that the obtained relationship between the COD deficits indicates
that this measure provides information about the athlete’s COD ability regardless of the angle, at least
for 90◦ - and 135◦ -COD. Thus, the COD deficits measure provides valuable information for the coaches,
which allows the preparation of an individualized training program, e.g., whether the athletes require
a complementary program aimed at improving the COD ability.
The present study has some limitations which must be addressed. The first limitation of the
study is the assessment of relationships based only on a single value of external load during a squat
exercise (50% 1RM). Hence, the results of the presented study do not translate to other loads. Moreover,
only a single running length (20 m) for linear sprint and COD tests was examined, as well as the
same number of direction changes (3 turns). In addition, these running tests were performed during
one experimental session, so the impact of fatigue on the result cannot be ruled out. Taking into
consideration the nature of soccer, relationships between high-intensity actions and angles below 90◦
during COD should be analyzed, however sharper angles should not be completely ignored. Thus,
future studies should provide a detailed relationship between different exercises (e.g., hip thrust) at
a wide range of external loads and COD performance with variety of angles and numbers of direction
change, in a large number of soccer players.
5. Conclusions
The results of the present study showed that 20-m linear sprinting speed, 1RM squat strength,
power output obtained during squat at 50% 1RM and COD ability at 90◦ and 135◦ angles, are separate
physical qualities. Moreover, it seems that COD deficit provides a more isolated measure of COD ability
than the COD tests alone and does not must be limited to a specific angle, but provides knowledge
about the COD ability in a range of other angles, at least concerning 90◦ and 135◦ COD angles. Thus,Int. J. Environ. Res. Public Health 2020, 17, 6119 8 of 9
the lower the deficit time in athletes, the more effective the COD or the higher the ability of an athlete
to COD relative to their physical ability for linear speed. What indicates that COD deficits provides
an isolated measure of athletes’ COD ability and is not biased towards superior lower-body peak power
output or 1RM squat strength level and 20-m linear sprint. Therefore, practitioners are recommended
to evaluate COD performance based on COD deficits to detect the athlete’s capacity to change direction.
6. Practical Applications
The findings from this study show that COD deficit is an easy way to evaluate the COD ability
in athletes. Therefore, coaches should use the COD deficit to enable the prescription of more targeted
and individualized training programs to enhance the athletes’ capability to perform directional changes.
Based on this, coaches can implement a more comprehensive training strategy depending on whether
the athlete would benefit more from developing the ability to change direction or from improving
linear sprint performance.
Author Contributions: Conceptualization, M.P. and A.G.; data curation, M.O. and G.W.; formal analysis, R.R.;
investigation, M.P. and M.O.; methodology, M.P. and A.G.; supervision, M.K. and A.G.; writing—original draft,
M.K. and M.P.; writing—review & editing, M.K. All authors have read and agree the published version of
the manuscript.
Funding: The study was supported and funded by the statutory research of the Jerzy Kukuczka Academy of
Physical Education in Katowice, Poland.
Conflicts of Interest: The authors declare that they have no conflicts of interest.
References
1. Lockie, R.G.; Murphy, A.J.; Spinks, C.D. Effects of resisted sled towing on sprint kinematics in field-sport
athletes. J. Strength Cond. Res. 2003, 17, 760–767. [CrossRef]
2. Nimphius, S.; Callaghan, S.J.; Spiteri, T.; Lockie, R.G. Change of Direction Deficit: A More Isolated Measure of
Change of Direction Performance Than Total 505 Time. J. Strength Cond. Res. 2016, 30, 3024–3032. [CrossRef]
3. Bloomfield, J.; Polman, R.; O’Donoghue, P. Physical Demands of Different Positions in FA Premier League
Soccer. J. Sports Sci. Med. 2007, 6, 63–70.
4. Duthie, G.; Pyne, D.; Hooper, S. Time motion analysis of 2001 and 2002 super 12 rugby. J. Sports Sci. 2005, 23,
523–530. [CrossRef]
5. Vescovi, J.D.; Mcguigan, M.R. Relationships between sprinting, agility, and jump ability in female athletes.
J. Sports Sci. 2008, 26, 97–107. [CrossRef]
6. Buchheit, M. Repeated-Sprint Performance in Team Sport Players: Associations with Measures of Aerobic
Fitness, Metabolic Control and Locomotor Function. Int. J. Sports Med. 2012, 33, 230–239. [CrossRef]
7. Condello, G.; Minganti, C.; Lupo, C.; Benvenuti, C.; Pacini, D.; Tessitore, A. Evaluation of Change-of-Direction
Movements in Young Rugby Players. Int. J. Sports Physiol. Perform. 2013, 8, 52–56. [CrossRef] [PubMed]
8. Sayers, M.G.L. Influence of Test Distance on Change of Direction Speed Test Results. J. Strength Cond. Res.
2015, 29, 2412–2416. [CrossRef] [PubMed]
9. Loturco, I.; Pereira, L.A.; Moraes, J.E.; Kitamura, K.; Cal Abad, C.C.; Kobal, R.; Nakamura, F.Y. Jump-Squat
and Half-Squat Exercises: Selective Influences on Speed-Power Performance of Elite Rugby Sevens Players.
PLoS ONE 2017, 12, e0170627. [CrossRef]
10. Suarez-Arrones, L.; Gonzalo-Skok, O.; Carrasquilla, I.; Asián-Clemente, J.; Santalla, A.; Lara-Lopez, P.;
Núñez, F.J. Relationships between Change of Direction, Sprint, Jump, and Squat Power Performance. Sports
2020, 8, 38. [CrossRef] [PubMed]
11. Buchheit, M.; Haydar, B.; Ahmaidi, S. Repeated sprints with directional changes: Do angles matter?
J. Sports Sci. 2012, 30, 555–562. [CrossRef] [PubMed]
12. Nygaard Falch, H.; Guldteig Rædergård, H.; van den Tillaar, R. Effect of Different Physical Training Forms
on Change of Direction Ability: A Systematic Review and Meta-analysis. Sports Med. Open 2019, 5, 53.
[CrossRef] [PubMed]
13. Bourgeuis, F.; McGuigan, M.R.; Gill, N.D.; Gamble, P. Physical characteristics and performance in change of
direction tasks: A brief review and training considerations. J. Aust. Strength Cond. 2017, 25, 104–117.Int. J. Environ. Res. Public Health 2020, 17, 6119 9 of 9
14. Nimphius, S.; Callaghan, S.J.; Bezodis, N.E.; Lockie, R.G. Change of Direction and Agility Tests: Challenging
Our Current Measures of Performance. Strength Cond. J. 2018, 40, 26–38. [CrossRef]
15. Loturco, I.; Nimphius, S.; Kobal, R.; Bottino, A.; Zanetti, V.; Pereira, L.A.; Jeffreys, I. Change-of direction
deficit in elite young soccer players: The limited relationship between conventional speed and power
measures and change-of-direction performance. Ger. J. Exerc. Sport Res. 2018, 48, 228–234. [CrossRef]
16. Cuthbert, M.; Thomas, C.; Dos’Santos, T.; Jones, P.A. Application of Change of Direction Deficit to Evaluate
Cutting Ability. J. Strength Cond. Res. 2019, 33, 2138–2144. [CrossRef]
17. Siegel, J.A.; Gilders, R.M.; Staron, R.S.; Hagerman, F.C. Human muscle power output during upper- and
lower-body exercises. J. Strength Cond. Res. 2002, 16, 173–178.
18. Wilk, M.; Golas, A.; Zmijewski, P.; Krzysztofik, M.; Filip, A.; Coso, J.D.; Tufano, J.J. The Effects of the
Movement Tempo on the One-Repetition Maximum Bench Press Results. J. Hum. Kinet. 2020, 72, 151–159.
[CrossRef]
19. Wilk, M.; Gepfert, M.; Krzysztofik, M.; Mostowik, A.; Filip, A.; Hajduk, G.; Zajac, A. Impact of Duration of
Eccentric Movement in the One-Repetition Maximum Test Result in the Bench Press among Women. J. Sports
Sci. Med. 2020, 19, 317–322.
20. Martínez-Cava, A.; Morán-Navarro, R.; Sánchez-Medina, L.; González-Badillo, J.J.; Pallarés, J.G. Velocity-
and power-load relationships in the half, parallel and full back squat. J. Sports Sci. 2019, 37, 1088–1096.
[CrossRef]
21. Hopkins, W.G. Measures of Reliability in Sports Medicine and Science. Sports Med 2000, 30, 1–15. [CrossRef]
[PubMed]
22. Wisloff, U. Strong correlation of maximal squat strength with sprint performance and vertical jump height
in elite soccer players. Br. J. Sports Med. 2004, 38, 285–288. [CrossRef] [PubMed]
23. Yetter, M.; Moir, G.L. The Acute Effects of Heavy Back and Front Squats on Speed during Forty-Meter Sprint
Trials. J. Strength Cond. Res. 2008, 22, 159–165. [CrossRef] [PubMed]
24. Contreras, B.; Vigotsky, A.D.; Schoenfeld, B.J.; Beardsley, C.; McMaster, D.T.; Reyneke, J.H.T.; Cronin, J.B.
Effects of a Six-Week Hip Thrust vs. Front Squat Resistance Training Program on Performance in Adolescent
Males: A Randomized Controlled Trial. J. Strength Cond. Res. 2017, 31, 999–1008. [CrossRef]
25. González-García, J.; Morencos, E.; Balsalobre-Fernández, C.; Cuéllar-Rayo, Á.; Romero-Moraleda, B. Effects of
7-Week Hip Thrust Versus Back Squat Resistance Training on Performance in Adolescent Female Soccer
Players. Sports 2019, 7, 80. [CrossRef] [PubMed]
26. López-Segovia, M.; Marques, M.; van den Tillaar, R.; González-Badillo, J. Relationships Between Vertical
Jump and Full Squat Power Outputs With Sprint Times in U21 Soccer Players. J. Hum. Kinet. 2011, 30,
135–144. [CrossRef]
27. Rouissi, M.; Chtara, M.; Owen, A.; Chaalali, A.; Chaouachi, A.; Gabbett, T.; Chamari, K. Effect of leg
dominance on change of direction ability amongst young elite soccer players. J. Sports Sci. 2016, 34, 542–548.
[CrossRef]
28. Loturco, I.; Pereira, L.A.; Reis, V.P.; Abad, C.C.C.; Freitas, T.T.; Azevedo, P.H.S.M.; Nimphius, S. Change of
Direction Performance in Elite Players From Different Team Sports. J. Strength Cond. Res. 2020, 1. [CrossRef]
© 2020 by the authors. Licensee MDPI, Basel, Switzerland. This article is an open access
article distributed under the terms and conditions of the Creative Commons Attribution
(CC BY) license (http://creativecommons.org/licenses/by/4.0/).You can also read