Transport Assessment Redbank Power Station
←
→
Page content transcription
If your browser does not render page correctly, please read the page content below
Transport Assessment
Redbank Power Station
112 Long Point Road West, Warkworth
10 August 2021
Ref: 1025r03v04
Info@asongroup.com.au
+61 2 9083 6601
Suite 17.02, Level 17,
1 Castlereagh Street,
Sydney, NSW 2000

Document Control
 Project No                1025
 Project                   Redbank Power Station
 Client                    Redbank Energy
 File Reference            1025r03v04 TA Redbank Power Station, Warkworth, Issue IV

Revision History
   Revision No.                 Date                      Details                        Author                    Approved by
        Draft               18/05/2021                     Draft                         T. Chen                      J. Laidler
       Issue I              24/06/2021                    Issue I                        T. Chen                      J. Laidler
       Issue II             14/07/2021                    Issue II                      J. Laidler                    J. Laidler
       Issue III            30/07/2021                    Issue III                     J. Laidler                    J. Laidler
      Issue IV              10/08/2021                   Issue IV                       J. Laidler                    J. Laidler

This document has been prepared for the sole use of the Client and for a specific purpose, as expressly stated in the document. Ason
Group does not accept any responsibility for any use of or reliance on the contents on this report by any third party. This d ocument has
been prepared based on the Client’s description of its requirements, information provided by the Client and other third parties.

1025r03v04 TA Redbank Power Station, Warkworth, Issue IV
Contents

      Glossary

1     Introduction                                                   1
      1.1   Overview                                                 1
      1.2   Transport Assessment Tasks                               1
      1.3   Reference Documents                                      1
2     Existing Conditions                                            3
      2.1   Site and Location                                        3
      2.2   Site Operations                                          3
      2.3   Access                                                   3
      2.4   Fuel Transport Operations Under the Original Approval    4
      2.5   Site Traffic Generation                                  4
3     The Road Network                                               5
      3.1   Key Roads                                                5
      3.2   Key Intersections                                        5
      3.3   Existing Traffic Flows                                   6
      3.4   Intersection Operations                                  7
      3.5   Road Safety                                              8
4     The Proposal                                                  10
      4.1   The Proposal                                            10
      4.2   Access and Internal Circulation                         10
      4.3   Trip Generation                                         11
      4.4   Trip Assignment                                         12
5     Traffic Assessment                                            14
      5.1   Future Intersection Operations                          14
      5.2   Road Capacities                                         14
      5.3   Intersection Upgrade Warrants                           16
6     Conclusions and Recommendations                               18
      6.1   Conclusions                                             18
      6.2   Recommendations                                         18

1025r03v04 TA Redbank Power Station, Warkworth, Issue IV
Contents Continued

Figures
Figure 1: Existing Access                                                             3
Figure 2: Site Location and Intersection Layout                                       5
Figure 3: 2019 Intersection Count Survey                                              7
Figure 4: Internal Vehicle Circulation                                               10
Figure 5: AM and PM Peak Hour Total Future Flows                                     13
Figure 6: Warrants for turn treatments on rural roads equal or higher to 100km/hr.   16
Figure 7: Golden Highway & Long Point Road West Intersection Layout                  17

Tables
Table 1 RMS Historical AADT Volumes                                                   6
Table 2 2019 Survey Count Data                                                        6
Table 3 Level of Service Criteria                                                     8
Table 4 Existing Intersection Operations                                              8
Table 5 RMS Crash Statistics                                                          9
Table 6 Network Performance - Future                                                 14
Table 7 Two Way Rural Road Levels of Service                                         15

APPENDICES
Appendix A. SIDRA Modelling Results
Appendix B. B-Double Swept Path Assessment

1025r03v04 TA Redbank Power Station, Warkworth, Issue IV
Glossary

 Acronym                    Description
 AGRD                       Austroads Guide to Road Design
 AGTM                       Austroads Guide to Traffic Management
 CC                         Construction Certificate
 Council                    Singleton Council
 DA                         Development Application
 DCP                        Development Control Plan
 DoS                        Degree of Saturation
 DPIE                       Department of Planning, Industry and Environment
 FSR                        Floor space ratio
 GFA                        Gross Floor Area
 HRV                        Heavy Rigid Vehicle (as defined by AS2890.2:2018)
 LEP                        Local Environmental Plan
 LGA                        Local Government Area
 LoS                        Level of Service
 MOD                        Section 4.55 Modification (also referred as a S4.55)
 MRV                        Medium Rigid Vehicle (as defined by AS2890.2:2018)
 NHVR                       National Heavy Vehicle Regulator
 OC                         Occupation Certificate
 RMS Guide                  Transport for NSW (formerly Roads and Traffic Authority), Guide to Traffic
                            Generating Developments, 2002
 S4.55                      Section 4.55 Modification (also referenced as MOD)
 S96                        Section 96 Modification (former process terminology for an S4.55)
 SRV                        Small Rigid Vehicle (as defined by AS2890.2:2018)
 TDT 2013/04a               TfNSW Technical Direction, Guide to Traffic Generating Developments –
                            Updated traffic surveys, August 2013
 TfNSW                      Transport for New South Wales
 TIA                        Transport Impact Assessment
 TIS                        Transport Impact Statement
 veh/hr                     Vehicle movements per hour (1 vehicle in & out = 2 movements)

1025r03v04 TA Redbank Power Station, Warkworth, Issue IV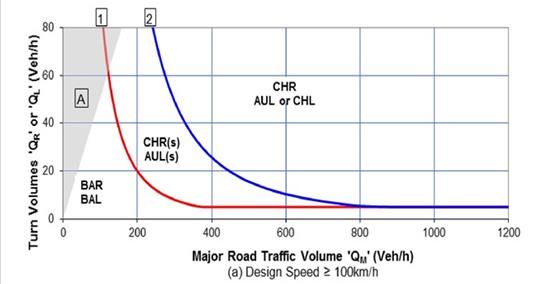
1 Introduction
1.1 Overview
Ason Group was previously engaged by Hunter Energy to prepare a Traffic Assessment (TA) to assess the
potential traffic impacts associated with the proposed change in fuel source of the Redbank Power Station
from coal to biomass (the Proposal) at 112 Long Point Road West, Warkworth (the Site). The use of
biomass shall be used as a substitute fuel source instead of coal tailing in the plant.

The following assessment is based on the transport of Biomass via B-double vehicles over a 12 hour period,
6 days / week (Monday to Saturday). Deliveries of biomass are expected to be up to 70 trucks per day.

The purpose of this report is to review the previous traffic modelling to confirm that the changes to proposed
routes do not detrimentally impact on the design and operation of the intersections and access arrangements
along the intersection of Long Point Road West / Golden Highway (the Intersection). In this regard, the focus
of this assessment is a 50/50 split of heavy vehicles in the north and southern direction of Golden Highway
during both morning and afternoon peak periods.

In addition, the site and access arrangements have been reviewed to ensure that there is sufficient area on-
site for the manoeuvring of the nominated design vehicle and that all queueing associated with the proposal
is catered for on-site.

1.2 Transport Assessment Tasks
This TA provides an assessment of the relevant traffic implications of the Proposal, and specifically focuses
on the potential impact of these additional truck trips being generated along the local road to/from the Site.
This has included:

•   Review of the EIS documentation in support of the original consent (LEC 10217/1994) and the approved
    amended EIS (dated 1993);
•   The commission and review of traffic surveys at key locations within the local road network, and an
    assessment of existing road network operations;
•   A review of other sub-regional projects with the potential to generate additional trips to the key roads and
    intersections required to facilitate the Proposal;
•   A determination of the peak period and daily trip generation of the Site further to the Proposal; the
    distribution of those trips to the road network; and the potential impact of those trips on road network
    operations;
•   Adequacy of the on-site arrangements to manage queuing, manoeuvring and safety.

1.3 Reference Documents
1.3.1 Planning Controls

The Site is located within the Singleton Council (Council) Local Government Area (LGA), and as such has
been assessed with reference to that Council’s planning controls, including:

•   Singleton Centres Development Control Plan 2014 (DCP 2014); and
•   Singleton Local Environmental Plan 2013 (LEP 2013).

1 | 1025r03v04 TA Redbank Power Station, Warkworth, Issue IV
1.3.2 Traffic and Transport Guidelines
This TIA also references general access, traffic and parking guidelines, including:
• Roads and Maritime Services (RMS) Guide to Traffic Generating Developments (RMS Guide);
• Austroads Guide to Road Design – Part 4A: Unsignalised and Signalised Intersections (Austroads 4A);
and
• Austroads Guide to Traffic Management Part 8 – Local Traffic Management (Austroads Part 8).
1.3.3 Background Reports
A number of traffic and transport reports relating to development within the sub-region have been reviewed
as part of the assessment, specifically in regard to determining the potential for increases in background
traffic flows within the local road network. Key references in this regard include:
• Approved Amended EIS Determination and Consent (LEC 10217/1994);
• Ason Group, Technical Note prepared by Ason Group, reference 1025tn02 TN Redbank Power Station
Warkworth, Issue 02, Author: Ason Group, Date: 24 July 2020.
• Ason group, Transport Assessment prepared by Ason Group, reference 1025r01v4 TA Redbank Power
Station, Warkworth, Issue IV, Author: Ason group, Date: 15 July 2019; and
• Jackson Environment and Planning, Verdant Earth Technologies Limited Redbank Power Station –
Request for Information - Response to Council DA Modification Contentions #4, #5 and #10 – LEC Case
No. 2021/00128111, Dated 16 July 2021
• National Power Company and ESI Energy INC, Amended Environmental Impact Statement for Redbank
Power Project (prepared by National Power Company and ESI Energy INC, Ddated November 1993. )
that accompanied the original application;
• RMS Average Annual Traffic Data records;
• Traffic & Transport Associates, United and Wambo Open Cut Project Traffic & Transport Impact
Assessment, Dated 2016 (Wambo TIA);
• Verdant Technologies Australia, Redbank Power Station QA/QC, Supply Chain and Material Handling,
Dated 30 July 2021
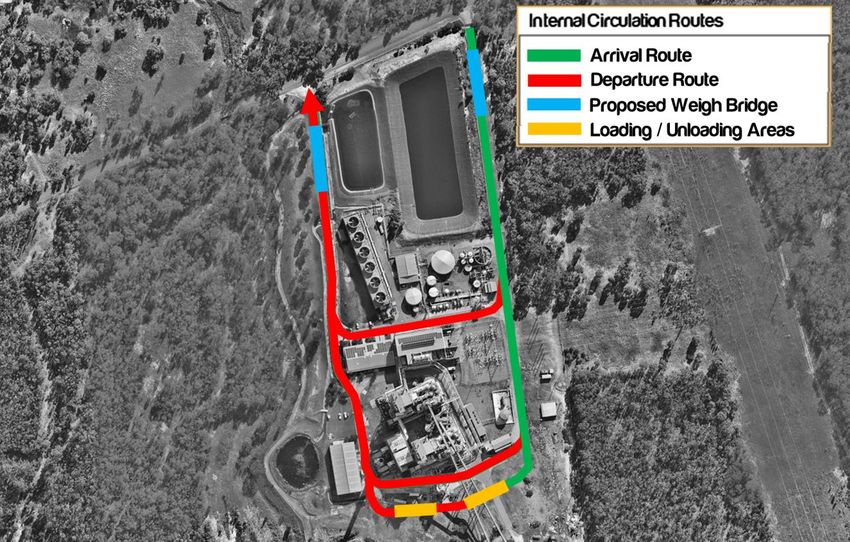
2 | 1025r03v04 TA Redbank Power Station, Warkworth, Issue IV2 Existing Conditions 2.1 Site and Location The Site is legally referenced as Lot 450 in DP 1119428, and has a street address of 112 Long Point Road West, Warkworth. As stated, the Site is located within the Singleton LGA, and lies approximately 17km west of the Singleton town centre, and 90km north-west of the Newcastle CBD. 2.2 Site Operations Redbank Power Station currently has approval to operate 24 hours per day, however, has been inactive since 2014.Similarly, the operating hours are permitted for the transporting of fuel within the current approval are also 24 hours per day. 2.3 Access All Site access is provided via Long Point Road via two formal driveways at the eastern and western boundaries of the Site, as shown in Figure 1. Figure 1: Existing Access 3 | 1025r03v04 TA Redbank Power Station, Warkworth, Issue IV
2.4 Fuel Transport Operations Under the Original Approval
The following is an extract from the original EIS report regarding the traffic and transport elements of the
proposal, which was approved.

“Once constructed, the Project would employ a total of approximately 45-55 persons on a permanent basis
(approximately 25 employees on site during the day shift). Maintenance staff augmentation would be
provided from time to time when seasonal maintenance efforts are required.

Project employees should generate an average of 60-80 trips per day. In addition, there would be routine
traffic deliveries of supplies such as portable water and chemicals used in the power plant process. These
would occur 3-6 times per week giving a weekly average of less than 1 trip per day.

There would also be 1-2 trips per day for delivery of limestone (for S02 control) and 1-2 trips per day (on
average) for delivery of start-up fuel.

Non-routine traffic for truck deliveries (e.g., spare parts) as well as visits by tradespeople and vendors is
expected to generate an additional 1-2 trips per day. The total ADT once the Project is in operation is
therefore expected to be 65-85.

2.5 Site Traffic Generation
The Site essentially generates no traffic at this time further to the suspension of the Power Station operations
in 2014.

4 | 1025r03v04 TA Redbank Power Station, Warkworth, Issue IV
3 The Road Network
3.1 Key Roads
The key roads providing access for the Site and for the haulage routes heading north and south are detailed
below:

•   Golden Highway (Jerry Plains Road): A State Highway (SH 27), the Golden Highway generally runs in
    a north-west to south-east to direction between the Castlereagh Highway at Craboon and Putty Road at
    Singleton, respectively. It generally provides two traffic lanes for two-way traffic, and at-grade and grade-
    separated intersections appropriate to through and turning traffic demands along different parts of the
    route. In the vicinity of the Site, the Golden Highway has a posted speed limit of 100km/h.
•   Long Point Road West: A collector road, Long Point Road West generally run in an east-west direction
    between Gouldsville Road and the Golden Highway, respectively. It provides two sealed traffic lanes for
    two-way traffic, and has a posted speed limit of 100km/h.

3.2 Key Intersections
The key intersection providing access for the Site are detailed below:

•   Golden Highway & Long Point Road West: A Give Way intersection with priority to Golden Highway,
    this intersection provides auxiliary lane infrastructure including a channelised right turn lane, Golden
    Highway to Long Point Road West; and a short auxiliary left turn lane, Golden Highway to Long Point
    Road West. Sight distances on all approaches meet the requirements of Austroads 4. An aerial of this
    intersection is provided in Figure 2 below.

Figure 2: Site Location and Intersection Layout

5 | 1025r03v04 TA Redbank Power Station, Warkworth, Issue IV
3.3 Existing Traffic Flows
3.3.1 RMS AADT Data
Ason Group has sourced available RMS Average Annual Daily Traffic (AADT) volumes from existing and
removed RMS count stations. This AADT data is summarised in Table 1.
TABLE 1 RMS HISTORICAL AADT VOLUMES
RMS Count Station AADT
1992 1995 1998 2001 2004 2007
Jerry Plains Road
North of Mt Thorley 4508 7997 6256 7059 5572
(Count Station 05481)
Golden Highway
East of Broke Road 6447 7164 7966 8143 9401
(Removed)
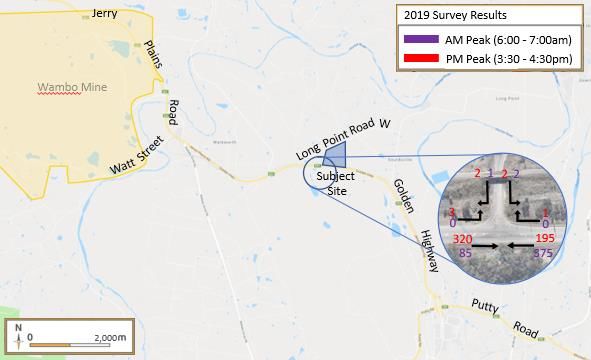
3.3.2 2019 Traffic Counter Surveys
As part of the 2019 traffic assessment, Ason Group commissioned Northern Transport Planning and
Engineering (NTPE) to undertake AM and PM peak intersection counts at the previously identified key
intersections, being:
• Golden Highway & Long Point Road West; and
• Golden Highway & Watt Street
In addition, an Automatic Tube Counter (ATC) was installed in the Golden Highway west of Long Point Road
West. The results of these surveys are provided in the below.
TABLE 2 2019 SURVEY COUNT DATA
Survey Location Volumes
Daily AM Peak PM Peak
(10:00-11:00) (4:00-5:00)
Golden Highway
4,772 647 561
Near Long Point Road West
6 | 1025r03v04 TA Redbank Power Station, Warkworth, Issue IVFigure 3: 2019 Intersection Count Survey
3.4 Intersection Operations
3.4.1 SIDRA Intersection Model
The performance of the key intersections has been analysed using RMS’ approved SIDRA intersection
modelling software. SIDRA provides a range of performance measures, in particular:
• Degree of Saturation (DOS): DOS is defined as the ratio of demand (arrival) flow to capacity.
• Average Vehicle Delay (AVD): AVD (or average delay per vehicle in seconds) provides a measure of the
operational performance of an intersection and is used to determine an intersection’s Level of Service
(see below).
• Level of Service (LOS): LOS is a comparative measure that provides an indication of the operating
performance of an intersection based on AVD. For signalised and roundabout intersections, the SIDRA
reported LOS is based on the average delay to all vehicles, while at priority-controlled intersections the
SIDRA reported LOS is based on the worst approach delay.
Table 3 provides a summary of the SIDRA LOS criteria, which is based on LOS parameters detailed in the
RMS Guide.
7 | 1025r03v04 TA Redbank Power Station, Warkworth, Issue IVTABLE 3 LEVEL OF SERVICE CRITERIA
Level of Average Delay Traffic Signal & Roundabout Give Way & Stop Signs
Service per Vehicle (s)
A < 14 Good operation Good operation
B Good with acceptable delays & spare Acceptable delays & spare
15 to 28
capacity capacity
C Satisfactory, but accident study
29 to 42 Satisfactory
required
D Near capacity & accident study
43 to 56 Operating near capacity
required
E At capacity; at signals, incidents will
At capacity, requires other control
57 to 70 cause excessive delays. Roundabouts
mode
require other control mode
F Unsatisfactory and requires additional Unsatisfactory and requires other
70 <
capacity. control mode or major treatment.
3.4.2 Existing Intersection Operations
The existing operations of the key intersections identified in Section 3.2 are summarised in Table 4.
TABLE 4 EXISTING INTERSECTION OPERATIONS
Intersection Control Type Period Intersection Delay Level of Service
(Seconds)
Golden Highway & AM 10.9 A
Sign Control
Long Point Road West PM 15.5 B
The analysis indicates that the key intersection currently operates at good level of service, with low delays
and queues, while retaining significant spare capacity. Refer to Appendix A for the SIDRA results.
3.5 Road Safety
In 2014 the NSW Police Force implemented changes to the way data is captured about some crashes, and
specifically in regard to ‘minor’ crashes where a tow truck is required but there is no injury. These crashes
are now self-reported by the parties involved in the crash; this does not mean that they are not required to be
reported, but that the Police will only investigate in certain circumstances such as a failure to exchange
details. As a result, the number of reported crashes (across NSW) has dropped.
Notwithstanding, an assessment of the Centre for Road Safety’s Crash and Casualty Statistics database has
been undertaken to establish the crash history in the vicinity of the Site. This data represents 99% of all
recorded crashes that have occurred in a 5-year period between 2013 and 2017, and includes all crashes
that met the following criteria:
• Were reported to the police;
• Occurred on a road open to the public;
• Involved at least one moving road vehicle; and
• Involved at least one person being killed or injured or at least one motor vehicle being towed away.
8 | 1025r03v04 TA Redbank Power Station, Warkworth, Issue IVThe report crashes are detailed in Table 5 below:
TABLE 5 RMS CRASH STATISTICS
Year Location RUM – Description of Injury
Crash
2014 Long Point Rd W – 50m north of the intersection 85 – Off right / left bend
None
of Jerry Plains Rd x Long Point Rd W into object
2015 Jerry Plains Rd – 1.2km east of the intersection 71 – Off road into
1 - Moderate
of Jerry Plains Rd x Watt St object
Jerry Plains Rd – 400m east of the intersection
32 – Right rear 1 - Moderate
of Jerry Plains Rd x Watt St
2016 Jerry Plains Rd – 1.2km west of the intersection
67 – Struck animal None
of Jerry Plains Rd x Long Point Rd W
Source: RMS Crash Statistic Website
With reference to the crash data, it is certainly the case that inappropriate speed or inattention can lead to
incidents on these roads, either as a case of running off road (i.e., not slowing appropriately for a curve) or
head-on collisions (i.e., not taking due caution on narrower sections of road). Notwithstanding, this crash
record indicates generally good intersection / road geometry and turning infrastructure; sight distances; and
– of course – the relatively moderate flows through the road network.
9 | 1025r03v04 TA Redbank Power Station, Warkworth, Issue IV4 The Proposal
4.1 The Proposal
As discussed, the Proposal relates to the proposed haulage of biomass to/from the Redbank Power Station.
The biomass would be hauled by road (primarily using B-Double) across the day (12 hour shift); it is
anticipated that up to 140 truck trips (70 return trips) would be required for this haulage task.
In addition, the broader Power Station would recommence operations in line with existing approvals; from a
traffic and transport perspective, this includes:
• The employment of;
– up to 30 operational and maintenance staff per day shift and
– 5 staff per night shift;
• Primary shifts for staff being between 6:00am – 6:00pm.
4.2 Access and Internal Circulation
Access to the Site would remain unchanged from existing approvals (i.e., via Long Point Road West).
The internal weigh bridge locations and fuel unloading facilities have been designed to ensure that any
queuing resulting from these activities shall be accommodated on-site and not adversely impact on the
adjacent road network. Refer to the Operational Traffic Management Plan (OTMP) for further details.
Figure 4: Internal Vehicle Circulation
10 | 1025r03v04 TA Redbank Power Station, Warkworth, Issue IVIt is understood that the fuel unloading process is as follows:
• A truck arrives at the fuel unloading area and tips its load into the drive over hopper;
• The hopper floor is swept by a feeder conveyor or chain conveyor;
• Once empty, the truck continues to the exit.
The capacity of the hopper and feeder conveyors will be designed to accommodate up to two B-double truck
loads. Please refer to Appendix B for the B-double swept paths, which demonstrate satisfactory access and
circulation.
4.3 Trip Generation
4.3.1 Sources of Biomass
A wide range of sites would be used to source the appropriate biomass, including forestry and sawmilling
residues, uncontaminated wood waste from primary & secondary manufacturing processes, and coal
tailings. Suppliers may or are likely to vary and change from year to year as market conditions dictate.
It is estimated that approximately 70% of the biomass sourced for the plant will be obtained from approved
forestry residues, 15% from sawmill operations and 15% from uncontaminated wood wastes by weight, and
include
• Woody waste biomass feedstock materials from forestry and sawmill sites in many parts of regional
NSW, including Bulahdelah and Kempsey.
• Private plantation residues.
• Agricultural crops
• Further residues through land clearance, bushfire zoning and other activities.
It is noted that the Redbank Power Station will retain the ability to use coal tailings as a fuel. This material
will not be blended or co-fired with biomass. If the plant after using biomass as fuel chooses to use coal
tailings, all woody biomass in the approved storage location will be fully utilised, and the area cleared before
coal tailings are then stored as fuel. No changes to the plant will be required to re-commence the use of coal
tailings.
4.3.2 Truck Trip Generation
The truck generation rates have been calculated from the following assumptions;
• The facility has been designed to have capacity of 850,000 tonnes (T) of biomass per annum,
• Deliveries of biomass shall be undertaken by b-doubles with a conservative capacity of 40T.
• 40T per load based on 850,000T per year equates to 21,250 loads required per year,
• Deliveries to arrive 6 days per week and equates to approximately 70 loads per day (70 trucks deliveries
per day would result in 140 truck movements per day, as 1 truck would create 1 inbound movement & 1
outbound movement, equalling 2 movements.
• Based on 12 hour delivery window, the resulting trip generation is 12 truck movements per hour.
11 | 1025r03v04 TA Redbank Power Station, Warkworth, Issue IVIn addition, the remains of waste biomass (residual ash) will comprise of roughly 3-5% of the delivered mass.
Therefore, utilising the worst case scenario of 5%, the following assumptions and calculations have been
undertaken;
• Based on an average biomass usage of 112T per hour, there is approximately 2,688T of biomass burned
a day.
• 5% of 2,688T equates to a daily residual ash production of 134.4T per day.
• B-doubles shall be utilised in the removal in residual ash from the Site, therefore 40T per trip would
equate to 4 additional trucks per day (8 truck movements per day).
As per the QA.QC report, the b-doubles that deliver the biomass can be ‘re-filled’ with the residual ash on
departure, therefore resulting in no additional trips being generated from the removal of the residual ash.
Nevertheless, when taking the worst case scenario of 148 truck movements per day, it has been assumed
that that trips would not be generated evenly across shift, but it is common practice to assign 10% of trips to
the AM and PM peak hours, i.e., up to 15 truck trips would occur during each of the peak hours.
Therefore, sensitivity testing providing for 20 truck trips in a peak hour has been used for the purpose of a
conservative assessment.
50% of these truck trips would be arrival trips and 50% would be departure trips.
4.3.3 Staff Trip Generation
The Site operates across a 24 hr day and shifts being 12 hours. It has been assessed that there is expected
to be 30 staff on-site during the day and 5 staff at night. As such, a worst case assessment of staff trips
have been assigned to the surveyed peak hours.
In response to the above, the assessment shall assume a staff trip generation peak of 35 staff trips in each
peak. Again, sensitivity testing for 50 staff trips in a peak hour has been used for the purpose of a
conservative assessment.
Staff trips have been distributed based on the surveyed distribution at the Golden Highway & Watt Street
intersection, which shows the majority of trips being generated to and from the east. This aligns with the
likely home origin / destination of most staff (i.e., Singleton).
4.4 Trip Assignment
With reference to sections above, Figure 5 below provide a summary of the total trips at the key intersection,
while an assessment of future intersection operation is provided in Section 5.
12 | 1025r03v04 TA Redbank Power Station, Warkworth, Issue IVFigure 5: AM and PM Peak Hour Total Future Flows 13 | 1025r03v04 TA Redbank Power Station, Warkworth, Issue IV
5 Traffic Assessment
5.1 Future Intersection Operations
The impact of the proposal on the key intersections has been assessed using the SIDRA model; the results
of this analysis are summarised in Table 6.

    TABLE 6 NETWORK PERFORMANCE - FUTURE

        Intersection          Control Type             Period          Intersection Delay      Level of Service
                                                                           (Seconds)
      Golden Highway &                                   AM                    16.2                    B
                               Sign Control
    Long Point Road West                                 PM                    18.0                    B

With reference to Table 6 above, the SIDRA analysis indicates that the additional traffic generated by the
Proposal will have no significant impact on the operation of the Golden Highway/ Long Point Road West
intersection, with the intersection predicted to continue to operate at good levels and with spare capacity.
Refer to Appendix A for the SIDRA results.

5.2 Road Capacities
In accordance with RMS guidelines, consideration has also been given to the following in regard to the rural
road network in the vicinity of the Site;

•     As intersections are less frequent in rural areas, they are less of a determinant of rural road capacity;
•     The need for overtaking opportunities on two-lane roads is greater, as the level of service is determined
      by average travel speeds and the percentage of time spent delayed; and
•     A determination in regard to whether the acceptable volume threshold from one lane to two lanes per
      direction may be reached.

In this regard, Table 7 outlines the RMS Guide two-way hourly road capacities for two-lane roads for
different levels of service, with a design speed of 100km/hr; these capacities assume a 60/40 directional split
of traffic.

14 | 1025r03v04 TA Redbank Power Station, Warkworth, Issue IV
TABLE 7 TWO WAY RURAL ROAD LEVELS OF SERVICE
RMS Count Station Level of Service Percent of Heavy Vehicles
0 5 10 15
B 630 590 560 530
C 1030 970 920 870
Level
D 1630 1550 1480 1410
E 2630 2500 2390 2290
B 500 420 360 310
C 920 760 650 570
Rolling
D 1370 1140 970 700
E 2420 2000 1720 1510
B 340 230 180 150
C 600 140 320 260
Mountainous
D 1050 680 500 400
E 2160 1400 1040 820
In addition, RMS Guide performance standards reflect the fact that recreational peak hour periods (weekend
peaks, or peaks associated with particular tourist or recreational activity) occur less frequently than weekday
commuter peak hour periods. The RMS Guide performance limits are:
Weekday Peak Hour Flows:
• Major roads: Level of Service C.
• Minor roads: Level of Service C desirable.
Recreational Peak Hours (weekends):
• Major roads: Level of Service D
• Minor roads: Level of Service D desirable.
Table 2 indicates that a maximum of 647 and 561 vehicles in the AM and PM peak hours respectively travel
along Jetty Plains Road in the vicinity of the Site. Further analysis indicate a range of heavy vehicle trips
between 8.8% - 12.4% of the future total flows in the future AM and PM peak hours, respectively.
As such, reference to Table 7 indicates that Golden Highway / Jerry Plains Road intersection has a LoS C
and LoS B in the AM and PM peak hours respectively and would therefore operate in compliance with the
RMS capacity guidelines.
The SIDRA Analysis indicates that post development, the Jerry Plains Road x Long Point Road West
intersection would operate at a good level of service during peak periods, with only minor increases in the
delays experienced (in the order of 5 seconds).
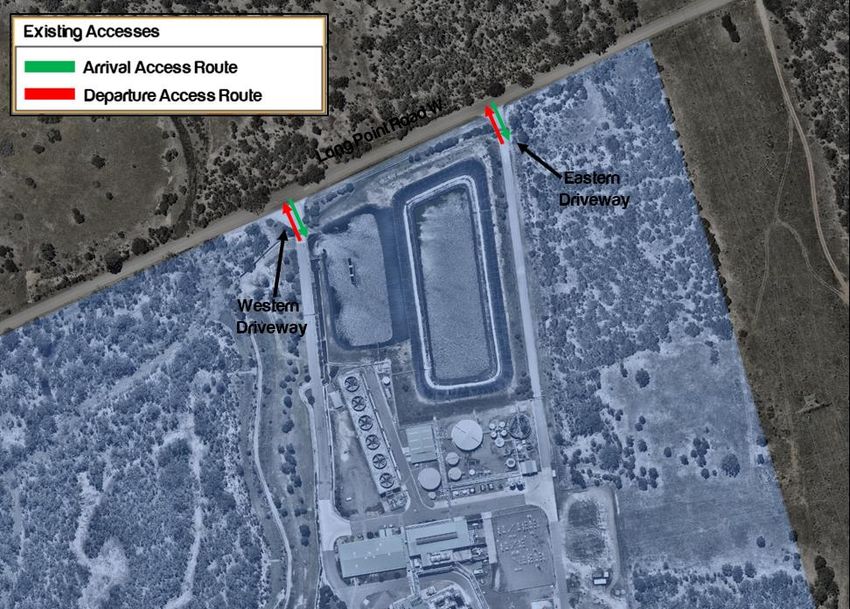
15 | 1025r03v04 TA Redbank Power Station, Warkworth, Issue IV5.3 Intersection Upgrade Warrants Although the SIDRA analysis indicates that the intersections of Jerry Plains Road x Long Point Road West operate at a good level of service during the peak periods, it is important to review the intersection design for the safety of all motorists. Intersections are generally defined by the type of turn treatments and the types of traffic islands provided. Furthermore, the warrants for additional upgrades are provided in Austroads 4A and outlined below. Figure 6: Warrants for turn treatments on rural roads equal or higher to 100km/hr. The intersection of Golden Highway & Long Point Road West is currently designed and built as a “Channelised Right Turn (CHR)” as can be seen below in Figure 7. In addition, the assessment would seem to suggest that a BAL turn treatment would also be warranted for vehicles turning left into Long Point Rd from Golden Highway. the BAL treatment on the major road has a widened shoulder, which assists turning vehicles to move further off the through carriageway making it easier for through vehicles to pass. The existing shoulder width on the approach to the intersection would seem to be in excess of 4m, therefore would be acceptable for a left turn treatment to be constructed. In summary, with reference to the future traffic flows at the intersection, current vehicle speeds and existing geometry, it can be concluded that any additional upgrade of the intersection can be accommodated. 16 | 1025r03v04 TA Redbank Power Station, Warkworth, Issue IV
Figure 7: Golden Highway & Long Point Road West Intersection Layout

17 | 1025r03v04 TA Redbank Power Station, Warkworth, Issue IV
6 Conclusions and Recommendations
6.1 Conclusions
Ason Group has been engaged by Hunter Energy to assess the potential traffic impacts associated with the
proposed haulage of biomass to/from the Redbank Power Station. Further to a detailed assessment of the
Proposal, Ason Group has determined that:

•   The Proposal will generate up to 148 heavy vehicle trips per day (140 delivery trips and 8 ash waste
    trips), as well as reinstating staff vehicle movements in line with the existing Site approval.
•   Traffic modelling of a conservative development scenario of up to 20 heavy vehicle trips per hour during
    the peak periods, as well as staff trips occurring in those same peak hours, demonstrates that the
    Proposal would have no significant impact on the operation of the Golden Highway/ Long Point Road
    West intersection, nor on capacity limits or existing geometry requirements.

6.2 Recommendations
Further to these Conclusions, Ason Group provides the following recommendations to maximise the
efficiency and safety of the proposed haulage operations:

•   It is recommended that a schedule of all biomass deliveries, and ash removals be established prior to
    each day and be site-specific, and that radio contact is maintained with haulage vehicles at all times.

Following our assessment of the key issues associated with the Proposal, and with the application of the
recommendation outlined above, Ason Group has concluded that the Proposal is supportable from an
access and traffic perspective.

18 | 1025r03v04 TA Redbank Power Station, Warkworth, Issue IV
Appendix A. SIDRA Modelling Results 1025r03v04 TA Redbank Power Station, Warkworth, Issue IV
MOVEMENT SUMMARY
      Site: 1a [JPR x LPRW Existing AM]
Jerry Plains Road x Long Point Road W
Existing
AM Peak
Site Category: (None)
Giveway / Yield (Two-Way)

 Movement Performance - Vehicles
 Mov    Turn      Demand Flows      Deg.    Average    Level of   95% Back of Queue   Prop. Effective Aver. No. Average
 ID                  Total   HV     Satn     Delay     Service     Vehicles Distance Queued Stop Rate   Cycles Speed
                    veh/h     %      v/c        sec                    veh        m                                km/h
 East: Jerry Plains Road (East)
 5       T1        395       7.7   0.213         0.0    LOS A          0.0        0.0      0.00       0.00     0.00     99.9
 6       R2           1      0.0   0.001         7.9    LOS A          0.0        0.0      0.19       0.58     0.19     74.2
 Approach          396       7.7   0.213         0.0       NA          0.0        0.0      0.00       0.00     0.00     99.8

 North: Long Point Road W
 7       L2           2     50.0   0.003         9.5    LOS A          0.0        0.1      0.22       0.62     0.22     58.2
 9       R2           1      0.0   0.003       10.9     LOS A          0.0        0.1      0.22       0.62     0.22     72.5
 Approach             3     33.3   0.003       10.0     LOS A          0.0        0.1      0.22       0.62     0.22     62.3

 West: Jerry Plains Road (West)
 10      L2           1      0.0   0.049         7.8    LOS A          0.0        0.0      0.00       0.28     0.00     84.5
 11      T1          89      7.1   0.049         2.0    LOS A          0.0        0.0      0.00       0.28     0.00     91.8
 Approach            91      7.0   0.049         2.0       NA          0.0        0.0      0.00       0.28     0.00     91.8

 All Vehicles      489       7.7   0.213         0.5       NA          0.0        0.1      0.00       0.06     0.00     97.8

Site Level of Service (LOS) Method: Delay (RTA NSW). Site LOS Method is specified in the Parameter Settings dialog (Site tab).
Vehicle movement LOS values are based on average delay per movement.
Minor Road Approach LOS values are based on average delay for all vehicle movements.
NA: Intersection LOS and Major Road Approach LOS values are Not Applicable for two-way sign control since the average delay
is not a good LOS measure due to zero delays associated with major road movements.
SIDRA Standard Delay Model is used. Control Delay includes Geometric Delay.
Gap-Acceptance Capacity: SIDRA Standard (Akçelik M3D).
HV (%) values are calculated for All Movement Classes of All Heavy Vehicle Model Designation.

SIDRA INTERSECTION 8.0 | Copyright © 2000-2019 Akcelik and Associates Pty Ltd | sidrasolutions.com
Organisation: ASON GROUP PTY LTD | Processed: Thursday, 23 July 2020 4:37:22 PM
Project: C:\Users\JamesLaidler\Desktop\1025m02 Redbank Modelling.sip8
MOVEMENT SUMMARY
Site: 1p [JPR x LPRW Existing PM ]
Jerry Plains Road x Long Point Road W
Existing
PM Peak
Site Category: (None)
Giveway / Yield (Two-Way)
Movement Performance - Vehicles
Mov Turn Demand Flows Deg. Average Level of 95% Back of Queue Prop. Effective Aver. No. Average
ID Total HV Satn Delay Service Vehicles Distance Queued Stop Rate Cycles Speed
veh/h % v/c sec veh m km/h
East: Jerry Plains Road (East)
5 T1 205 4.6 0.108 0.0 LOS A 0.0 0.0 0.00 0.00 0.00 99.9
6 R2 1 100.0 0.001 11.7 LOS A 0.0 0.1 0.50 0.60 0.50 56.5
Approach 206 5.1 0.108 0.1 NA 0.0 0.1 0.00 0.00 0.00 99.6
North: Long Point Road W
7 L2 2 50.0 0.008 11.0 LOS A 0.0 0.3 0.52 0.68 0.52 55.6
9 R2 2 50.0 0.008 15.5 LOS B 0.0 0.3 0.52 0.68 0.52 55.2
Approach 4 50.0 0.008 13.2 LOS A 0.0 0.3 0.52 0.68 0.52 55.4
West: Jerry Plains Road (West)
10 L2 3 0.0 0.185 7.9 LOS A 0.0 0.0 0.00 0.01 0.00 88.4
11 T1 337 9.1 0.185 0.0 LOS A 0.0 0.0 0.00 0.01 0.00 99.7
Approach 340 9.0 0.185 0.1 NA 0.0 0.0 0.00 0.01 0.00 99.6
All Vehicles 551 7.8 0.185 0.2 NA 0.0 0.3 0.00 0.01 0.00 99.0
Site Level of Service (LOS) Method: Delay (RTA NSW). Site LOS Method is specified in the Parameter Settings dialog (Site tab).
Vehicle movement LOS values are based on average delay per movement.
Minor Road Approach LOS values are based on average delay for all vehicle movements.
NA: Intersection LOS and Major Road Approach LOS values are Not Applicable for two-way sign control since the average delay
is not a good LOS measure due to zero delays associated with major road movements.
SIDRA Standard Delay Model is used. Control Delay includes Geometric Delay.
Gap-Acceptance Capacity: SIDRA Standard (Akçelik M3D).
HV (%) values are calculated for All Movement Classes of All Heavy Vehicle Model Designation.
SIDRA INTERSECTION 8.0 | Copyright © 2000-2019 Akcelik and Associates Pty Ltd | sidrasolutions.com
Organisation: ASON GROUP PTY LTD | Processed: Thursday, 23 July 2020 4:37:23 PM
Project: C:\Users\JamesLaidler\Desktop\1025m02 Redbank Modelling.sip8MOVEMENT SUMMARY
Site: 3a [JPR x LPRW Future AM]
Jerry Plains Road x Long Point Road W
Future
AM Peak
Site Category: (None)
Giveway / Yield (Two-Way)
Movement Performance - Vehicles
Mov Turn Demand Flows Deg. Average Level of 95% Back of Queue Prop. Effective Aver. No. Average
ID Total HV Satn Delay Service Vehicles Distance Queued Stop Rate Cycles Speed
veh/h % v/c sec veh m km/h
East: Jerry Plains Road (East)
5 T1 395 7.7 0.214 0.0 LOS A 0.0 0.0 0.00 0.00 0.00 99.9
6 R2 56 7.5 0.035 8.2 LOS A 0.2 1.2 0.21 0.61 0.21 70.6
Approach 451 7.7 0.214 1.0 NA 0.2 1.2 0.03 0.08 0.03 95.0
North: Long Point Road W
7 L2 56 9.4 0.060 8.4 LOS A 0.2 1.8 0.20 0.62 0.20 69.5
9 R2 8 50.0 0.060 16.2 LOS B 0.2 1.8 0.20 0.62 0.20 57.8
Approach 64 14.8 0.060 9.4 LOS A 0.2 1.8 0.20 0.62 0.20 67.7
West: Jerry Plains Road (West)
10 L2 8 50.0 0.054 9.1 LOS A 0.0 0.0 0.00 0.06 0.00 67.5
11 T1 89 7.1 0.054 0.0 LOS A 0.0 0.0 0.00 0.06 0.00 98.9
Approach 98 10.8 0.054 0.8 NA 0.0 0.0 0.00 0.06 0.00 95.1
All Vehicles 613 8.9 0.214 1.9 NA 0.2 1.8 0.04 0.13 0.04 91.2
Site Level of Service (LOS) Method: Delay (RTA NSW). Site LOS Method is specified in the Parameter Settings dialog (Site tab).
Vehicle movement LOS values are based on average delay per movement.
Minor Road Approach LOS values are based on average delay for all vehicle movements.
NA: Intersection LOS and Major Road Approach LOS values are Not Applicable for two-way sign control since the average delay
is not a good LOS measure due to zero delays associated with major road movements.
SIDRA Standard Delay Model is used. Control Delay includes Geometric Delay.
Gap-Acceptance Capacity: SIDRA Standard (Akçelik M3D).
HV (%) values are calculated for All Movement Classes of All Heavy Vehicle Model Designation.
SIDRA INTERSECTION 8.0 | Copyright © 2000-2019 Akcelik and Associates Pty Ltd | sidrasolutions.com
Organisation: ASON GROUP PTY LTD | Processed: Thursday, 23 July 2020 4:37:23 PM
Project: C:\Users\JamesLaidler\Desktop\1025m02 Redbank Modelling.sip8MOVEMENT SUMMARY
Site: 3p [JPR x LPRW Future PM ]
Jerry Plains Road x Long Point Road W
Future
PM Peak
Site Category: (None)
Giveway / Yield (Two-Way)
Movement Performance - Vehicles
Mov Turn Demand Flows Deg. Average Level of 95% Back of Queue Prop. Effective Aver. No. Average
ID Total HV Satn Delay Service Vehicles Distance Queued Stop Rate Cycles Speed
veh/h % v/c sec veh m km/h
East: Jerry Plains Road (East)
5 T1 205 4.6 0.109 0.0 LOS A 0.0 0.0 0.00 0.00 0.00 99.9
6 R2 57 9.3 0.048 9.3 LOS A 0.2 1.5 0.43 0.66 0.43 68.9
Approach 262 5.6 0.109 2.0 NA 0.2 1.5 0.09 0.14 0.09 91.0
North: Long Point Road W
7 L2 55 9.6 0.075 9.3 LOS A 0.3 2.3 0.44 0.68 0.44 68.1
9 R2 11 50.0 0.075 16.9 LOS B 0.3 2.3 0.44 0.68 0.44 56.8
Approach 65 16.1 0.075 10.5 LOS A 0.3 2.3 0.44 0.68 0.44 66.0
West: Jerry Plains Road (West)
10 L2 35 87.9 0.191 10.1 LOS A 0.0 0.0 0.00 0.07 0.00 57.6
11 T1 311 1.4 0.191 0.0 LOS A 0.0 0.0 0.00 0.07 0.00 99.6
Approach 345 10.1 0.191 1.0 NA 0.0 0.0 0.00 0.07 0.00 92.8
All Vehicles 673 8.9 0.191 2.3 NA 0.3 2.3 0.08 0.16 0.08 88.6
Site Level of Service (LOS) Method: Delay (RTA NSW). Site LOS Method is specified in the Parameter Settings dialog (Site tab).
Vehicle movement LOS values are based on average delay per movement.
Minor Road Approach LOS values are based on average delay for all vehicle movements.
NA: Intersection LOS and Major Road Approach LOS values are Not Applicable for two-way sign control since the average delay
is not a good LOS measure due to zero delays associated with major road movements.
SIDRA Standard Delay Model is used. Control Delay includes Geometric Delay.
Gap-Acceptance Capacity: SIDRA Standard (Akçelik M3D).
HV (%) values are calculated for All Movement Classes of All Heavy Vehicle Model Designation.
SIDRA INTERSECTION 8.0 | Copyright © 2000-2019 Akcelik and Associates Pty Ltd | sidrasolutions.com
Organisation: ASON GROUP PTY LTD | Processed: Thursday, 23 July 2020 4:37:23 PM
Project: C:\Users\JamesLaidler\Desktop\1025m02 Redbank Modelling.sip8Appendix B. B-Double Swept Path Assessment 1025r03v04 TA Redbank Power Station, Warkworth, Issue IV
B-Double (26.0m)

                                                      B-Double (26.0m)
             Drain

                                                                 B-Double (26.0m)
                                   B-Double (26.0m)

N o t e s:                                                                                         Document Info:                           P r o j e c t:                         D a t e:
 This drawing is provided for information purposes only and should not be used for construction.    Drawn by: JamesLaidler                   1025                                  10-Aug-21
                                                                                                    File name: P1025d01v1 Bdouble SPA.dwg    112 Long Point Road West, Warkworth
                                                                                                                                                                                   S c a l e @ A3:
                                                                                                   Client:                                  D r a w i n g T i t l e:               [scale]           Suite 15.02, Level 5, 1 Castlereagh St
                                                                                                                                                                                                     Sydney NSW 2000
                                                                                                    Redbank Power Station                    B-Double Access                       Drawing Number:
                                                                                                                                                                                   AG.01
                                                                                                                                                                                                     info@asongroup.com.au
You can also read