CHALLENGES OF PLANNING FUTURE HIGH VOLTAGE POWER SYSTEM NETWORKS - AMEU
←
→
Page content transcription
If your browser does not render page correctly, please read the page content below
CHALLENGES OF PLANNING FUTURE HIGH VOLTAGE POWER
SYSTEM NETWORKS
Author & Presenter: V Chetty BSc Eng, MSc Power and Energy
1 Introduction
Steady growth and development in South Africa has led to the demand for electricity hence demanding
the expansion of electric power networks and an evolution to the current power system network [1]. To
date there have been several planning challenges, both technical and non-technical, many of which still
persist. It is predicted that there is a likelihood of further increased complex planning challenges in
future. We are aware that networks will change but the difficult questions are how, when and how quickly
will these network changes occur.
This paper focuses on the planning of future high voltage power system networks supplying cities,
municipalities and large power users, as well as smaller communities and rural networks. The increase
in electricity tariffs, load-shedding, introduction of renewable energy and the drive towards ‘clean
energy’ sources are among the key aspects that will impact the energy sector. Policy and regulatory
changes will further significantly affect network planning consequently leading to either a positive or
negative evolution.
South Africa is largely supplied by power stations that are located in Mpumalanga province. There is a
change to the supply of energy from power stations with the introduction of the renewable energy
independent power producer (REIPP) programme initiated by the Department of energy (DoE). This
program has procured around 6 400 MW of energy from 106 independent power producers
(IPPs) [2].Renewable energy is generated chiefly by wind and solar sources in the Eastern Cape,
Western Cape, and the Northern Cape. As part of the integrated resource plan more renewable energy
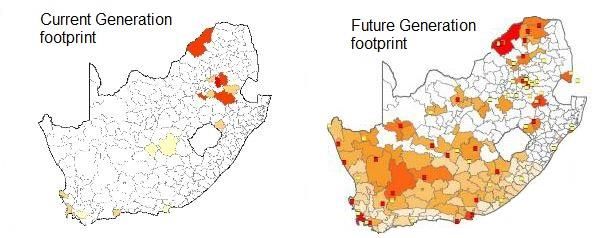
(around 4000 MW) is likely to be introduced in the next 10 years. Figure 1 provides a general overview
on the current and future footprint of power generation in South Africa.
Figure 1: SA’s current and future generation footprints [2]
The South African Power System comprises largely of the Eskom owned and operated Transmission
network with voltage levels ranging from 220 to 765 kV. These networks supply municipalities, cities,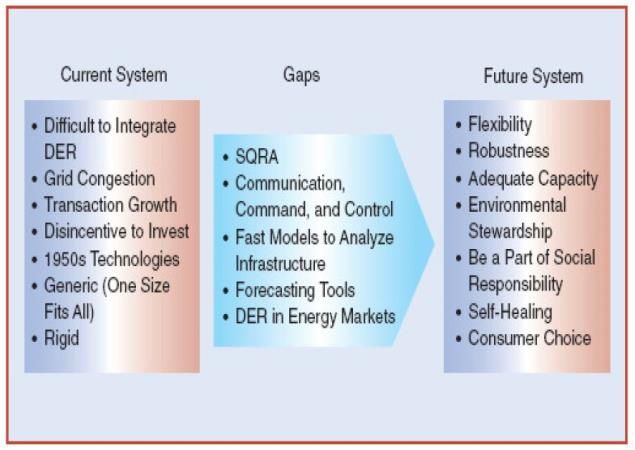
towns, mines, industries in South Africa as well as neighbouring countries. Countries such as Namibia,
Botswana, Zimbabwe, Mozambique, Swaziland, and Lesotho are currently connected to the South
African transmission grid. In an effort to trade more power, more interconnection is planned in the long-
term plan between Southern Africa and neighbouring countries.

2. The High Voltage Planning Process
The current high voltage planning philosophies are based on the transmission grid code, together with
policies and codes of practice that are specific to utilities. As a transmission networks are rigid and
robust, and in most cases with N-2 contingency [3]. These have ensured that transmissions network
remain stable under the current demanding conditions. The timeframes for planning, construction and
commissioning of high voltage networks can range from 3 to 10 years. In the planning phase, delays
can be experienced in the environmental impact assessment (EIA), water use licences and specialist
studies. In Environmental Impact Assessments (EIAs), the public is allowed to comment on the project
and it is a requirement that all public concerns are satisfactorily addressed before approvals are
granted. In most cases objections to projects are raised by residents in the vicinity of the project leading
to implementation delays. Land acquisition can also be a lengthy process leading to further delays if
owners are not willing to sell land or servitudes rights required for projects. When required, the
expropriation of land can delay projects if there are lengthy legal battles.

The construction of overhead lines requires 35, 45, 55m of servitude for 132, 275, 400 kV respectively
for the full length of the line. Depending on the utility, a single or double servitude would be required for
the new overhead lines. Substations require between 6,400 and 60,000 square metres of land. The
cost of land varies depending on the land-use, zoning and terrain. Further careful consideration has to
be given to the access roads for the construction and maintenance of towers & substations.

Prior to construction, approvals need to be sought from the affected authorities in the area. In some
cases, assessments and studies are required. An example of this situation is where lines and
substations are in the vicinity of airports and flight paths where approvals are required from the civil
aviation authority. Timeframes for these processes must be factored into the project delivery schedule,
considering the possibility of delays on one or more of the items mentioned.

Bulk infrastructure projects require large amount of land that is difficult to acquire in built up
environments. Urbanisation requires a secure, reliable and resilient source of power in order to sustain
development into the future. The projects are planned with supply developments for a minimum of 40
years. Maintenance and refurbishment of infrastructure would take place as and when required after
construction. In addition components would need to be replaced as they reach their end of life. Current
planning looks at life cycle costing when choosing components. Maintenance practices are now moving
to a ‘condition based’ maintenance regime rather than ‘time-based’ regimes. Online monitoring
equipment are also becoming common for large value assets.

3. Demand forecasting
In the past forecasting was carried out using historic trends and known/planned future developments.
More recently geographic load forecasting (GLF) is being carried out by utilities and municipalities. It
allows for the modelling of loads according to daily demand curve. Loads can be classified as industrial,
commercial and residential with each justifying a specific demand load for planning purposes. GLF
programs require an economic development perspective study to be carried out prior to the modelling.
It identifies spatially where and to what extent growth will take place. The study makes use of all
stakeholders’ plans, spatial & integrated plans as well as other development plans. The population
statistical data, economic and land-use data is used to formulate a model. The data derived from this
model are direct inputs to the GLF program. The output data of the model depends on the input
parameters, therefore good quality data is required. The results of the models become the key inputs
the master planning process and is crucial in determining the ‘capital bold’ program. However the longer
the planning time-lines, greater is the uncertainty in the forecast data. Figure 2 indicates the measure
of uncertainty against time. The area within the red ellipse indicates the planning period for the network
development plan (NDP), while the blue is for the network masterplan (NMP). Beyond 10 years, the
uncertainty increases exponentially. In planning high-voltage projects, planning can begin in excess of
10 years prior to the project being required. Hence, Forecast in general are based on current data and
hence they will always be factors of uncertainty in forecasting. Plans have to be reviewed regularly and
adjusted if required.

                         Figure 2: Indicates forecast uncertainty over time [4]

3.1 EThekwini Electricity’s Load Forecast
EThekwini Electricity completed its first forecasting exercise in 2011 the results of which are shown in
the figure 3 [4]. The forecasts were seen to be higher than what was being experienced within the
network. An update of the economic development study was carried out in 2015 and subsequently the
GLF model was updated accordingly. This process was completed in 2017. The results are shown in
orange in the results are shown in the graph below.

                          Figure 3: The 2011 and 2016 GLF study results [4]

The results indicate that there is a significant difference in the forecasting between the 2011 and 2016
load modelling. Factors that influence modelling are:

    •   Load data used
    •   Economic development perspective
    •   Statistical data (Census data)
    •   Growth and development materialising as planned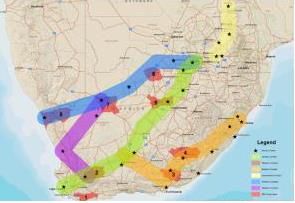
•   Government and municipal initiatives

The larger variance in the results indicates that pre-2010 (the year of the Football World Cup in SA)
economic outlook was much brighter than pre-2015. Projects forecasted in the initial study did not take
place as planned, but where stretched out over a longer period of time.

3.2 EThekwini Electricity’s Historical Load
The effects of the global recession of 2008 influenced growth in SA. Load shedding that began around
the same time period drove Eskom to implement demand side management (DSM) by promoting
energy efficiency. Projects such as solar water heating, incandescent bulb replacements, geyser timers,
energy efficient shower heads and education on saving power reduced the load demands. Customers
have also moved away from the electric stoves and heater to gas powered ones.

One of the most significant changes in the power industry is the introduction of renewable energy and
the drive to produce clean energy. This has led to commercial, industrial, and residential customers
installing generation units within their facilities for the production of power to either use or import into
the network. Industrial customers are now able to generate power from existing processes. Even though
companies are seeking to become carbon neutral in their production lines there still has to be a business
case for this. Small to medium customers have become more energy efficient and are using less power.

The decrease in load demand [3] has been as a result of:

    •   Increase in tariffs by Eskom
    •   Load-shedding
    •   Demand side initiatives and customer awareness

The electricity tariffs have been increasing steadily from 2008 to present. Year-on-year increases have
varied between 4.95- 26.2%. The latter being for the 2009/2010 financial year. An overall increase of
59% was levied over the last 10 years. Figure 4 is a plot of historical load data against an S-curve. S-
curves are used to trend loads over time, accordingly, a load reaches a point of saturation.

                                     EThekwini Historic Load Peaks
                     4500

                     4000

                     3500

                     3000
         Load (MW)

                     2500

                     2000

                     1500

                     1000

                     500

                       0
                            1951   1961   1971   1981   1991   2001    2011   2021    2031    2041    2051
                                                          Time (Years)          Actual          S Curve

                              Figure 4: The Historic demand graph for EThekwini Electricity

Between the years 1978-2008, the load curve closely followed the S-curve. Since 2008/2009, a
deviation from the S-curve is seen and there are slight increases and decreases in eThekwini
Electricity’s peak loads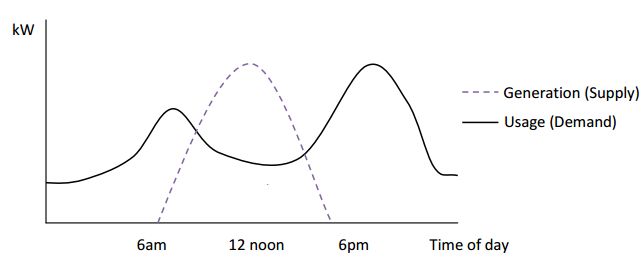
3.3 Embedded Generation
Within the eThekwini Municipality embedded generation has taken the form of photovoltaic (PV)
systems. There has been an increase in the number of residential units that have installed solar PV in
the last 5 years. Municipalities are still in the process of regulating the installations. A new tariff scheme
[5] has been introduced this year. It has introduced a grid connection charge to customers who wish to
generate power and still want to be grid connected. This would have an effect on future PV installations.
The new tariff’s grid connection increases the payback period of installations and might act as a
deterrent to future installations.
Figure 5 below indicates the daily usage curve of a residential customer, shown in black. The PV curve
is shown in purple and indicates a peak generation at midday. Thus, as PV penetration increases, there
would be an increase in the amount of power being generated by small-scale embedded generation
(SSEG).
Figure 5: The daily load curve with PV generation
However, if significant amounts of SSEGs are present in the network this would increase the amount
of power in those areas. SSEGs would have an impact on the amount of power being required from
upstream Eskom supplies to municipalities. The result will be that the transmission grid load would
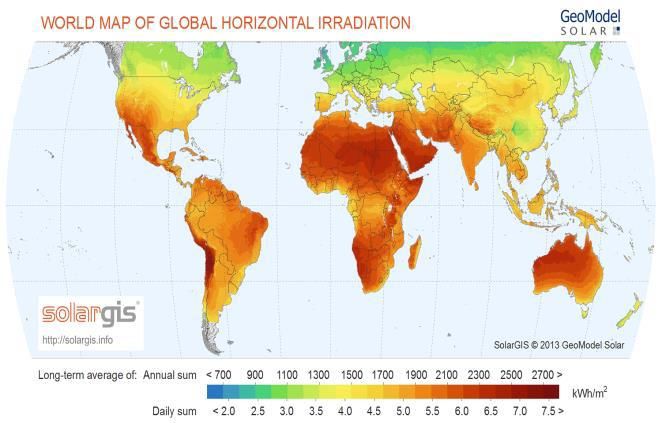
decrease. The solar irradiation map, figure 6, indicates that along the east coast of SA, approximately
between 1700-1900 kW/sqm. This when compare to the central and west between 2100-2300 kW/sqm
would be generated and is equivalent to 20% more power. Thus for the similar capital investment large
scale solar plant are not likely to be constructed in the Kwa-Zulu Natal, unless for reasons other than
obtaining the maximum return on investment. Thus currently there are such plants that have been in
operation in these areas for the last few years a part of Eskom’s REIPP program.
Figure 6: The Global Solar Horizontal Irradiation Map [6]The drive towards renewable energy and reducing greenhouse gases is likely to see a change in the
current power sources. This would mean that the traditional supply chain of transmission lines and
substation would have to be reconfigured. This is shown in figure 7 which are Eskom’s proposed
corridors for transmission lines going into the future.
Figure 7: Eskom’s future servitudes [2]
Municipalities are governed by the Municipalities act [7], while Nersa regulates power generation in the
country and regulates tariffs. Policies and regulations have to be put in place for the purchase of power
from SSEGs and other generators. Eskom is committed to purchase power at set rates for the IPPs.
The lack of policy gives freedom to participant but the lack of certainty make it hard to find funding.
4. Challenges
The challenges in SA are both technical and non-technical in nature. However both effect the quality of
supply of the customers.
4.1 Technical:
• Embedded generation: More small scale and large-scale renewable energy generation.
• Power flows that will change.
• Changing power quality due to the increase of renewable energy generation: fault current
levels, flicker, harmonics etc.
• Cyber-attacks and cyber security
• Variable operating conditions and currently only a few small modifications having been carried
out to the current network planning and operations.
• In-depth knowledge of the MV network and changes within the medium voltage network.
4.2 Non-technical:
• Sites and Servitudes are becoming harder to acquire, especially in built up areas
• Theft of electricity, cables and overhead lines
• The constant pressure to reduce carbon emissions and produce green energy
• Long project planning and execution timeframes
• Variance in the demands of the customers, due changing usage patterns.
• Changing the way in which they use energy, the move to gas and energy efficiency
• High costs for the transmission projects
• Effects of climate change on infrastructure
• Human resources and changing of skill set of employees
We are currently at a junction and must decide what energy demands to plan for going into the future
at transmission level. Thus the historical methods of transmission planning has become more
complicated. The data sets used in the past have to be modified and the planning methods change to
suit the current situation. Older planning methods were based on distribution forecasts.Planners need to do more active long-term forecasting in order to keep up with the trends of the power
system network. There are various factors that affect the load forecasts such as population growth and
migration, the economy, public and private developer and industry plans. In the future, the introduction
of renewable energy, vehicles would be major factors in affecting the way in which power is consumed
by customers, both residential and industrial.
Due to the fact that the criteria has changed planners need to be more careful when making decisions
going into the future. They need to gather information from all stakeholders and using model to do load
forecasting. The existing models need to be modified to include the effect of renewable energy sources
on the network. Renewables will have an effect on the daily load curves of customers. This will vary
from customer to customer depending on the amount of energy the system is producing. All factors that
affect PV systems need to be taken into account. Eventually a bottom-up approach must be looked at
in order to assess how the transmission network will be affected. The distribution model has to be
maintained in order for accurate modelling to be carried out.
The forecasting method methods need to be tested before used. Case studies are a good way of
assessing the impact of renewables on the network. Many countries have integrated renewables
successfully included network.
5. Future Power System
The transition to the future grid is described by Gellings et al. [8] is shown in figure 8.
Figure 8: The transition from the current grid to the future grid (SQRA: Security, Quality, Reliability and
Availability; DER: Distributed Energy Resources) [8]
An assessment of the current system would have to be conducted and the gaps for that particular
system identified. These gaps would differ across networks and utilities. Essentially the future power
system should enable utilities to [9]:
• Be more competitive with their overall strategies
• Provide better service
• Better manage their assets
• Extend equipment life
• Improve diagnostics
• Develop reliability-based maintenance.
Planning and development consider the ultimate inter-connections and progress towards it. EG would
be part of the solution, but should be practically assessed together with traditional generation sources
[11].The drivers for the transition of networks are:
• Rapid urbanisation: whether or not we are ready for it, will place services placed under strain
• EG costs have been decreasing steadily, an uncontrolled surge in EG will affect the networks
• Smart mobility and the reduction in fossil based vehicles together with the move towards electric
and autonomous vehicles would increase the demand for power and change the conventional
daily load curves
• The cost of battery storage is decreasing and would be a game-changer in the near future
• Climate change and it impact on infrastructure will test power system resilience
• Customers are becoming more discerning as to the products they purchase and the services
they receive, hence products and services have to become more customer centric
6. The Forth Industrial Revolution in the Power Sector
Power systems have been evolving and are not only becoming more connected at the high and medium
voltage levels but also in information and communications technology sector. The World Economic
Forum’s Grid Edge Transformation Initiative developed the following key findings: [13]:
• The Fourth Industrial Revolution is transforming the electricity system by increasingly
competitive distributed energy resources (like generation, storage, efficiency, demand
management and EVs) have become widely available, empowering customers to become
active elements of the system. Systems are becoming fully digitalized, customers can have
real-time interactions, operations can be fully automated, and capable of managing flexible and
mobile resources
• • The rules of the game are changing with blurred boundaries between sectors and along the
value chain and increasing the complexity of system governance. The role of the network
evolves beyond supplying electricity, becoming a platform that maximizes value of distributed
energy resources. The revenue model sees smaller shares of income derived from centrally
generated electrons, which is compensated by new revenue sources from new distribution and
retail services.
• Transformation will bring massive value creation with opportunity for creation of $2.3T of value
for industry and society – increasing reliability, resilience, efficiency and asset utilization of the
overall system, reducing CO2 emissions and creating new services for customers. However,
there is a great risk for value destruction if the system fails to capture the value of distributed
energy resources, potentially resulting in stranded network assets and customer defection.
7. Conclusion
Policy makers must re-design the regulatory framework, adopting a new revenue model, planning the
electricity system to include embedded generation with renewable energy sources. Regulators have to
adapt faster to change, involve more stakeholders and include the urban regulatory dimension onto
their models. Private sector embrace the new reality of a fully digital, customer-empowered, transactive
electricity system and transformation is inevitable. All stakeholders must deploy enabling infrastructure
that is flexible, open and interoperable. Consider public private partnerships to build enabling
infrastructure that is not yet commercially viable and requires initial public intervention.
Big data, machine learning and artificial intelligence should be explored to solve some of the existing
challenges and be will central to the planning, operation and maintenance of future power systems.
The forth industrial revolution is taking place much faster than the first three, adaptability, resilient,
flexibility are key for success.References [1] Network studies and Mitigation of High 132 kV Fault Currents in eThekwini Electricity, V Chetty, 2016 [2] Eskom TDP 2018 [3] EThekwini Electricity High Voltage Code of Practice, 2018 [4] EThekwini Electricity Transmission Masterplan Update, V Chetty, W Jwili, M Shabalala, N Mthimkhulu, 2017 [5] EThekwini Electricity 2019/2020 Tariff book, 2019 [6] Drivers and Application of Small Scale DG on Municipal Distribution Networks in South Africa: An eThekwini Electricity Case Study, S Sewchurran [7] Electricity by-law, 2013 [8] The future’s smart delivery systems, IEEE Power and Energy Magazine, Oct. 2004, pp. 40-48; Gellings C.W., Samotyj M., Howe B., [9] Future Power Systems: Technologies and Planning for Effective Distribution, Dr. Mohan K. Khedkar, Mel George [10] Research on Resilience of Power Systems Under Natural Disasters—A Review Yezhou Wang, Student Member, IEEE, Chen Chen, Member, IEEE, Jianhui Wang, Senior Member, IEEE, and Ross Baldick, Fellow, IEEE [11] Planning criteria for future transmission networks in the presence of a greater variability of power exchange with distribution systems, Joint Working Group, Cigre/Cired C1.29, March 2017 [12] Drivers and Application of Small Scale DG on Municipal Distribution Networks in South Africa, In Proceedings of the 24th South African Universities Power Engineering Conference, 2016, S Sewchurran and IE Davidson [13] World Economic Forum, Electricity Industry: Energy Utilities and Energy Technologies , Annual Meeting Report 2017, December 2016
You can also read