COVID-19 REPORT 7TH EDITION GLOBAL OUTBREAK OVERVIEW AND ITS IMPACT ON THE ENERGY SECTOR - Rystad Energy
←
→
Page content transcription
If your browser does not render page correctly, please read the page content below

COVID-19 REPORT
                      7TH EDITION
GLOBAL OUTBREAK OVERVIEW AND ITS IMPACT
                 ON THE ENERGY SECTOR

                               22 APRIL 2020
                               OPEN ACCESS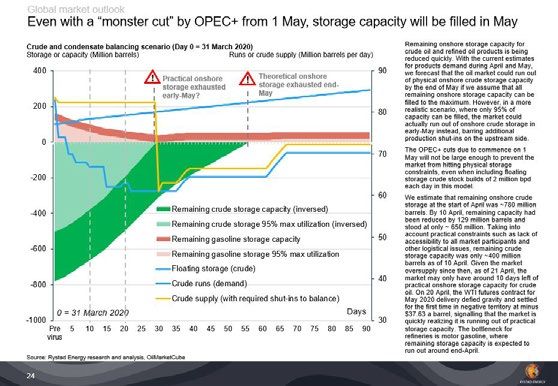
Table of Contents

    Executive summary
    Outbreak status and outlook
    Impact on oil demand
    Impact on the oil and gas industry
    Methodology

2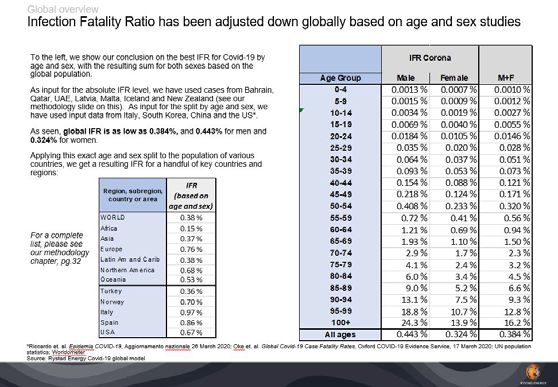
Executive summary
Herd immunity will take too long, suppression until a vaccine arrives is a more likely strategy

Countries outside of East Asia have now spent eight weeks desperately battling the Covid-19 virus, and our
model suggests the true number of infected cases is around 47 million, or 0.6% of the global population. In some
regions, such as in Northern Europe, up to 5% of the population is likely now infected. At peak in early March,
0.5% of the population in broader regions like Northern Europe became infected every week. In some countries
suffering has been extreme, both in terms of loss of life and due to the economic impact of the lockdowns.
Thus, it seems that achieving herd immunity – meaning that at least 40% of the population has been infected
and is immune – would take another 80 weeks, a timeline which could be much longer for some countries. This
length of time would be more-or-less the same, or much longer, as the time required to develop a vaccine. We
therefore believe that a strategy of continued suppression while waiting for the development of a vaccine will be
a more rational strategy than going for herd immunity.
The global reduction in flights and car traffic seems to have reached a floor over the last two weeks, and is likely
to slowly trend upwards again going forward. Thus, global oil demand destruction will probably peak in April at
around 28 million barrels per day. However, we now expect a slower recovery and longer-term structural shifts
that indicate that demand will not return to 2019 levels over next 12 to 18 months, if ever.

                       Demographic                                Global oil demand                          Storage capacity
                       analysis, page 7                           destruction, page 17                       concerns, page 24

3
Table of Contents

    Executive summary
    Outbreak status and outlook
          •   Global overview
          •   Key country focus
    Impact on oil demand
    Impact on the oil and gas industry
    Methodology

4
Global overview
The true number of people infected globally today is likely 47 million
Number of true and reported cases
Cases (log scale)                                                                           As of 20 April, 47 million people have likely been infected
                                                                     Estimated true cases   with Covid-19, according to our updated model.
100,000,000
                                                                                            Reported cases were alomst 2.5 million as of 20 April, a
                                                                                            number which our analysis suggests represents just 5% of
    10,000,000                                                                              true cases. Reported cases are now growing at around
                                                                                            4% per day (trailing seven-day average), down from 5%
                                                                                            last week and 8% the preceding week. This is an
     1,000,000                                                                              indication that quarantine measures are working. Growth
                                                                                            is no longer exponential, but now appears linear, with
                                                                                            80,000 new reported cases per day, on average, over the
      100,000                                                           Fatalities
                                                                                            last two weeks, trending slightly downwards.

                                                                                            Registered fatalities globally were 170,000 as of 20 April,
       10,000                                                                               a number which grew by 5% over the last week versus the
                                                                                            6%, 10% and 12% growth seen respectively over the
                                                                                            previous three weeks (trailing seven-day average).
         1,000
                                                                    Week 17                 In this edition we present one scenario, wherein current
                                                                    Week 16                 strict measures are maintained in the forecast period to
           100
                                                                                            end of May. In this scenario, 71 million people will be
                                                                                            infected across the globe by the end of May.
             10

               1

Source: Rystad Energy Covid-19 research and analysis; Worldometer

5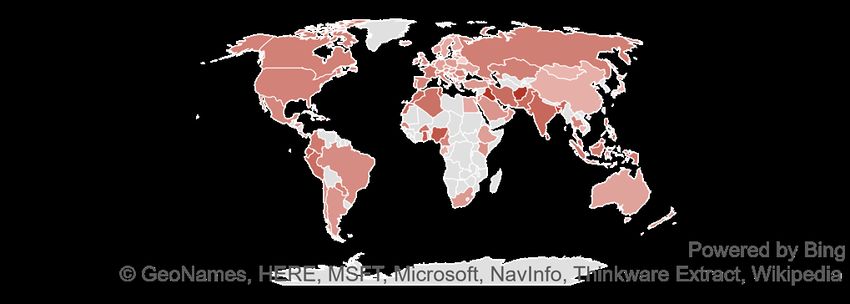
Global overview
Infection Fatality Ratio has been adjusted down globally based on age and sex studies

    To the left, we show our conclusion on the best IFR for Covid-19 by                                                                      IFR Corona
    age and sex, with the resulting sum for both sexes based on the
    global population.
                                                                                                            Age Group                    Male            Female               M+F
    As input for the absolute IFR level, we have used cases from Bahrain,                                       0-4                    0.0013 %          0.0007 %            0.0010 %
    Qatar, UAE, Latvia, Malta, Iceland and New Zealand (see our                                                 5-9                    0.0015 %          0.0009 %            0.0012 %
    methodology slide on this). As input for the split by age and sex, we
    have used input data from Italy, South Korea, China and the US*.                                          10-14                    0.0034 %          0.0019 %            0.0027 %
                                                                                                              15-19                    0.0069 %          0.0040 %            0.0055 %
    As seen, global IFR is as low as 0.384%, and 0.443% for men and
    0.324% for women.                                                                                         20-24                    0.0184 %          0.0105 %            0.0146 %
                                                                                                              25-29                     0.035 %           0.020 %             0.028 %
    Applying this exact age and sex split to the population of various
    countries, we get a resulting IFR for a handful of key countries and                                      30-34                     0.064 %           0.037 %             0.051 %
    regions:                                                                                                  35-39                     0.093 %           0.053 %             0.073 %
                                                         IFR                                                  40-44                     0.154 %           0.088 %             0.121 %
                            Region, subregion,
                             country or area
                                                     (based on                                                45-49                     0.218 %           0.124 %             0.171 %
                                                    age and sex)                                              50-54                     0.408 %           0.233 %             0.320 %
                           WORLD                       0.38 %                                                 55-59                      0.72 %            0.41 %              0.56 %
    For a complete
                           Africa                      0.15 %                                                 60-64                      1.21 %            0.69 %              0.94 %
                           Asia                        0.37 %                                                 65-69                      1.93 %            1.10 %              1.50 %
    list, please see
                           Europe                      0.76 %
    our methodology                                                                                           70-74                       2.9 %             1.7 %               2.3 %
    chapter, pg.32         Latin Am and Carib          0.38 %
                           Northern America            0.68 %
                                                                                                              75-79                       4.1 %             2.4 %               3.2 %
                           Oceania                     0.53 %                                                 80-84                       6.0 %             3.4 %               4.5 %
                           Turkey                      0.36 %                                                 85-89                       9.0 %             5.2 %               6.6 %
                           Norway                      0.70 %                                                 90-94                      13.1 %             7.5 %               9.3 %
                           Italy                       0.97 %                                                 95-99                      18.8 %            10.7 %              12.8 %
                           Spain                       0.86 %                                                 100+                       24.3 %            13.9 %              16.2 %
                           USA                         0.67 %                                                All ages                   0.443 %           0.324 %             0.384 %
*Riccardo et. al. Epidemia COVID-19, Aggiornamento nazionale 26 March 2020; Oke et. al. Global Covid-19 Case Fatality Rates, Oxford COVID-19 Evidence Service, 17 March 2020; UN population
statistics; Worldometer
Source: Rystad Energy Covid-19 global model

6
Global overview
Still long way to go before herd immunity is achieved

                                       0%               1%              2%               3%              4%              5%               6%
      Northern Europe                                                                                                          5.09%           Currently about 0.6% of the global
     Southern Europe                                                                                   3.92%                                   population is likely infected by the
                   Iran                                                                           3.40%                                        virus, despite stringent measures
     Northern America                                                                             3.34%                                        taken across the globe.
      Western Europe                                                                            3.18%
           Middle East                              0.68%                                                                                      In Europe and North America, we
        South America                               0.65%                                                                                      believe 3% to 5% of the population is
            Caribbean                            0.34%                                                                                         infected, or up to 0.5% per week at
                                                                                                                                               maximum.
       Eastern Europe                           0.33%
      Central America                           0.30%
                                                                                                                                               To acheive herd immunity, it is likely
                Russia                          0.29%
                                                                                                                                               that more than 40% of the population
          Western Asia                          0.28%                                                                                          will need to have been infected.
        Northern Africa                        0.21%                                                                                           Thus, another 80 weeks, or 1.5
          Western Asia                        0.15%                                                                                            years, would be needed to achieve
       Southern Africa                        0.13%                                                                                            herd immunity, which is about the
  South-Eastern Asia                         0.11%                                                                                             same time as the expected time
         Southern Asia                       0.10%                                                                                             required to develop vaccination.
           Central Asia                      0.10%
          Middle Africa                      0.09%                                                                                             Thus, a strategy of continued
         Eastern Africa                      0.09%                                                                                             suppression while waiting for a
        Western Africa                       0.09%                                                                                             vaccine seems to be the more likely
                                                                                                                                               strategy than going for herd
Australia/New Zealand                        0.07%
                                                                                                                                               immunity.
          Eastern Asia                       0.07%

Source: Rystad Energy Covid-19 global model; UN population statistics regions (except for West Asia, split by Iran and rest of Middle East)

7
Global overview
Countries easing measures are showing gradual increases in road traffic

                        Austria                      Czechia                     Denmark                      Germany                    Spain                 Sweden

Measures                14 April:                     9 April:                  15 April:                      20 April:                 13 April:         Sweden is not lifting
lifted            Non-essential shops          Some non-essential          Daycare centers and            Social distancing         Workers in some         measures, but they
                   (under 400 square           shops (hobby goods          schools are allowed              measures are               non-essential      have gone continued
                  meters) are allowed               and building               to reopen.               tentatively lifted, with        business in        with a low-measure
                       to reopen.                  materials) are                                         small retail shops          manufacturing,          strategy. Our
                                                allowed to reopen.                                       (under 800 square          construction and        analysis still shows
                                                Rules on open-air                                        meters) re-opening.       some services are       that people are self-
                                                sports are relaxed.                                                                allowed to return to   imposing restrictions.
                                                                                                                                          work.

                 20%                                                                                                                                                         20%
Traffic
                 10%                                                                                                                                                         10%

                  0%                                                                                                                                                         0%

                 -10%                                                                                                                                                        -10%

                 -20%                                                                                                                                                        -20%

                 -30%                                                                                                                                                        -30%

                 -40%                                                                                                                                                        -40%

                 -50%                                                                                                                                                        -50%

                 -60%                                                                                                                                                        -60%

                                                   Steady traffic                                                                                         Traffic increase as
Key               Significant uptick in
                                               increase since early        Some uptick in traffic         No effect seen yet       No effect seen yet        self-imposed
findings                 activity
                                                       April                                                                                              measures weakens

Source: Rystad Energy research and analysis; Rystad Energy Global City Traffic Database; TomTom Traffic Index; Google Maps

8
Key country focus
Spread appears under control as curves flatten, Japan still growing
Number of reported cases, key countries
Cases (log scale)
1000000
100000 UK
Iran China
South Korea
10000
Japan
1000
100
0 7 14 21 28 35 42 49 56 63 70 77 84 91 98 For further details
please see our
Covid-19 dashboard
at rystadenergy.com.
Source: Rystad Energy Covid-19 research and analysis; Worldometer
9Key country focus
Virus still appears to be spreading quickly in some countries with populations over 100 million
Number of reported cases, selected countries
Cases (log scale)
1000000
100000
Russia Countries are on the path of
doubling every 3-5 days. This
is roughly the same pace as
India the UK before measures were
implemented.
10000
Mexico
Bangladesh
1000
100
0 7 14 21 28 35 42 49 For further details
please see our
Covid-19 dashboard
at rystadenergy.com.
Source: Rystad Energy Covid-19 research and analysis; Worldometer
10Key country focus
Active cases in the US may be about to peak, assuming measures are not eased too quickly
United States, estimated total and active true cases
Number of cases; Current measures scenario*
Total true cases may pass The last step-up in preventive measures
14,000,000 Forecast in the US came in mid/late March
Total true cases today 13 million by end of May
likely around 11 million
(varying by state), after we had seen a
12,000,000 steep increase in the number of
10,000,000 reported new cases per day. Reports
indicate that 90% of Americans are now
8,000,000 Active true cases “sheltered at home”. Essential business
6,000,000 estimated to peak end continues, while many companies have
of April reverted to remote work from home
4,000,000 where possible.
2,000,000 We can now clearly see the effects of
Reported cases 790,009
0 these strict measures in the reported
numbers. The number of new cases is
01-Mar
04-Mar
07-Mar
10-Mar
13-Mar
16-Mar
19-Mar
22-Mar
25-Mar
28-Mar
31-Mar
03-May
06-May
09-May
12-May
15-May
18-May
21-May
24-May
27-May
30-May
03-Apr
06-Apr
09-Apr
12-Apr
15-Apr
18-Apr
21-Apr
24-Apr
27-Apr
30-Apr
trending down and the number of new
fatalities has flatlined. In New York
state, Governor Cuomo has said that
the situation is stabilizing and
improving.
Daily new cases and deaths
Our forecast assumes that current
New fatalities preventive measures will remain in
45,000 stabilized 2,500
Reported new cases place during the forecast period. This
40,000 may not be the most likely outcome, as
35,000 Reported new deaths (RHS) 2,000 the US administration has signaled it
30,000 will begin easing measures from 4 May.
1,500 The administration also indicates that
25,000 the spread is currently at peak and
Increasing preventive
20,000 measures mid-to-late March New cases under control. If the administration
1,000
15,000 trending down slowly eases measures, we believe they
will probably maintain control.
10,000 500
Please note there are large regional
5,000
differences between each state and
0 - city. For further details
please see our
Covid-19 dashboard
*Assumes current measures remain in place during forecasting interval at rystadenergy.com.
Source: Rystad Energy research and analysis; Worldometer
11Key country focus
Mexico is still on an upwards trend in new cases, but may be about to stabilize
Mexico, estimated total and active true cases
Number of cases; Current measures scenario*
Forecast Total true cases may pass
12,000,000 10 million at end of May
10,000,000
8,000,000
6,000,000 Active true cases
Total true cases today estimated to peak mid- Mexico had its latest increase in
4,000,000 likely above 3 million May preventive measures at the end of
March, when schools and businesses
2,000,000 were closed down. On 16 April,
Reported cases 8,261 President Obrador announced that in
0
the 979 municipalities that have not
01-Mar
04-Mar
07-Mar
10-Mar
13-Mar
16-Mar
19-Mar
22-Mar
25-Mar
28-Mar
31-Mar
03-May
06-May
09-May
12-May
15-May
18-May
21-May
24-May
27-May
30-May
03-Apr
06-Apr
09-Apr
12-Apr
15-Apr
18-Apr
21-Apr
24-Apr
27-Apr
30-Apr
registered one single case, schools may
reopen and people return to work on 17
May. Still, the physical distancing policy
will be enforced until 30 May.
Daily new cases and deaths Reported new cases and new fatalities
are still trending upwards, although they
New cases trending seem to have stabilized over the past
500 up 45
few days.
450 Reported new cases 40
400 Our forecast assumes that the current
Reported new deaths (RHS) 35 lockdown will remain in place during the
350 30 forecast period shown, and indicates a
300 peak in active cases in mid-May.
25
250 Schools and 20
200 businesses close
150 New fatalities 15
end March
100 trending up 10
50 5
0 -
For further details,
please see our
Covid-19 dashboard
*Assumes current measures remain in place during forecasting interval at rystadenergy.com.
Source: Rystad Energy research and analysis; Worldometer
12Table of Contents
Executive summary
Outbreak status and outlook
Impact on oil demand
• Global overview
• Aviation and jet fuels
• Ground transportation and road fuels
Impact on the oil and gas industry
Methodology
13Global overview
27 million bpd removed from global oil demand in April, or 4 billion barrels for all 2020
Global oil demand impact analysis Covid-19, levels and changes vs. pre-virus estimates
Thousand bpd
Remaining barrels
100,000 We see a V-shaped rout in oil
demand, reaching a low point in
80,000 April 2020 and with significant
downside risks remaining into
2021.
60,000 Average demand for 2020 is
expected at 89 million bpd, a drop
40,000 of 10% from 2019.
Europe is the worst hit, with
20,000 demand down 33% year-on-year
in April and on track for a 12%
demand decline for 2020 as a
0 whole.
0
Lost barrels
-5,000
About 4 billon barrels will be
-10,000 removed from global oil demand
during 2020.
-15,000 More than half of this decline
East Asia Europe North America Rest of world comes from areas outside the
-20,000 main demand pools of East Asia,
2019 Pre-virus Mitigation Previous Europe and North America.
-25,000
-30,000
Source: Oil Market Cube by Rystad Energy
14Global overview
US oil demand falls 30% to 14.1 million bpd in April, down 18.4 million bpd for the full year
Global oil demand impact analysis Covid-19, levels and changes vs. pre-virus estimates
Thousand bpd
25,000
US road fuel demand was 7.1
million bpd in April, jet fuel
20,000 demand was 650,000 bpd and
demand for all other fuels totaled
15,000 6.3 million bpd.
10,000
5,000
0
-500 About 4.1 million bpd was
removed from US road fuel
-1,500 demand in April, while the decline
was 1.1 million bpd for jet fuel and
-2,500 760,000 bpd for all other fuels.
-3,500 Road fuels Jet fuels Other fuels All in all, 830 million barrels have
been removed from total demand
-4,500 2019 Mitigation Previous in the US over the year 2020.
-5,500 Pre-virus
-6,500
Source: Oil Market Cube by Rystad Energy
15Aviation and jet fuels
Travel restrictions in Europe forces nine out of ten flights to stay on the ground
Cancellations of scheduled flights after 500 reported cases, by week in 2020
Change in scheduled flights year-on-year
1 2 3 4 5 6 7 8 9 10 11 12 13 14
0%
-10%
Aviation activity in many countries shows
-20% signs of stabilization with only small changes
compared to last week.
-30% The US seem to have reached a floor for
cancellations at a drop of 61% y/y. Major
airlines (e.g. American, Delta, United) have
China, -42.4% communicated plans to suspend the majority
-40% of their fleets in 2Q20. Cancellation rates of
around 60% is expected in the US in the
coming weeks.
-50% India, -52.3%
Japan, -44.4%
Year-on-year scheduled flight cancellations in
South Korea, -58.8% China continued to be stable in week 14, at a
-60% 42% reduction. A linear trend is observed for
Japan with 44% cancellations.
US, -60.8% With almost no airplanes in and out of Italy in
-70% weeks 5 through 8, aviation activity finally
started increasing after week 9, however, we
still see an 80% reduction in flights.
UAE, -79.2%
-80% Italy, -81.2%
Australia, -83.7% If other European countries follow the Italian
profile, aviation activity is set to slightly
France, -91.7% increase in the next few weeks.
-90%
Germany, -93.7%
UK, -93.2%
-100% Singapore, -97.1%
Hong Kong, -94.5% Spain, -95.1%
Source: OAG, IATA, ICAO, Rystad Energy research and analysis
16Ground transportation and road fuels
Major countries seem to have found a floor for road traffic reduction Rystad Energy Global City Traffic Database
covers road traffic in 1,200+ cities
and 150+ countries
Traffic levels versus normal for last seven days
Percent difference, year-on-year, all days
Africa Americas Asia & Australia Europe & Middle East
-90% -60% -30% 0% 30% -90% -60% -30% 0% -90% -60% -30% 0% -90% -60% -30% 0%
Uganda Bolivia Bangladesh Iraq
Rwanda Peru Afghanistan Andorra
Mauritius Colombia Sri Lanka Ireland
Zimbabwe Haiti Myanmar Albania
Congo Bahamas Turkmenistan Cyprus
Nigeria Dominican Republic Philippines France
DR Congo El Salvador Singapore United Kingdom
Angola Panama India Israel
Botswana Ecuador Thailand Luxembourg
Lesotho Costa Rica Pakistan Jordan
Ghana Venezuela New Zealand Italy
Liberia Puerto Rico Kyrgyzstan San Marino
Mauritania Paraguay Georgia Serbia
Tunisia Jamaica Malaysia Greece
Burkina Faso Canada Cambodia Belgium
Namibia United States Kazakhstan Lebanon
Gabon Brazil Uzbekistan Russia
Kenya Guatemala Indonesia Montenegro
Gambia Guinea Australia Portugal
Cameroon Honduras Vietnam Romania
Malawi Chile Armenia Iran
Niger Mexico Azerbaijan Kuwait
Burundi Argentina Japan UAE
Benin Nicaragua China Bahrain
Morocco Uruguay Mongolia Moldova
Senegal Laos Spain
Libya Tajikistan Switzerland
Cote d'Ivoire Papua New Guinea Saudi Arabia
Mali Previous China, Hong Kong… Estonia
Sierra Leone
week Current Oman
Algeria Norway
Tanzania week Palestine
Mozambique Ukraine
South Africa Poland
Ethiopia Turkey
Madagascar Slovenia
Zambia Qatar
Togo Netherlands
Egypt Croatia
Guinea-Bissau Austria
Germany
Finland
Lithuania
Belarus
Iceland
Latvia
Slovakia
Denmark
Hungary
Sweden
Faeroe Islands
Bulgaria
Liechtenstein
Czech Republic
Source: Rystad Energy Global City Traffic Database; TomTom Traffic Index; Google Maps; Rystad Energy research and analysis
17Ground transportation and road fuels
Road fuel falls 33% in April and 11% for the year; jet fuel drops 64% in April, 31% for the year
Global oil demand impact analysis Covid-19, levels and changes vs. pre-virus estimates
Thousand bpd
100,000
80,000
60,000
Global demand for road fuel was
40,000 31.8 million bpd in April, jet fuel
demand was 2.6 million bpd, and
demand for all other fuels stood at
20,000 37.9 million bpd.
0
About 15.5 million bpd was
0 removed from road fuel demand in
-5,000 April, while the decline was 4.6
million bpd for jet fuel and 6.1
-10,000 million bpd for all other fuels.
-15,000
Road fuels Jet fuels Other fuels
-20,000
2019 Mitigation Previous
-25,000 Pre-virus
-30,000
Source: Rystad Energy research and analysis
18Table of Contents
Executive summary
Outbreak status and outlook
Impact on oil demand
Impact on the oil and gas industry
• Global market outlook
• Market segment focus
Methodology
19Global market outlook
Even with a “monster cut” by OPEC+ from 1 May, storage capacity will be filled in May
Crude and condensate balancing scenario (Day 0 = 31 March 2020) The oil market could run out of physical
onshore crude storage capacity by the end
Storage or capacity (Million barrels) Runs or crude supply (Million barrels per day) of May if we assume that all remaining
onshore storage capacity can be filled to the
400 90 maximum.
Practical onshore Theoretical onshore
storage exhausted storage exhausted end- However, in a more realistic scenario, where
May only 95% of capacity can be filled, the
early-May? market could actually run out of onshore
200 crude storage in early-May instead, barring
80 additional production shut-ins on the
upstream side.
The OPEC+ cuts due to commence on 1
0 May will not be large enough to prevent the
market from hitting physical storage
70 constraints, even when including floating
storage crude stock builds of 2 million bpd
each day in this model.
-200 Taking into account practical constraints
such as lack of accessibility to all market
60 participants and other logistical issues,
remaining crude storage capacity was only
Remaining crude storage capacity (inversed) ~400 million barrels as of 10 April. Given the
-400 market oversupply since then, as of 21 April,
Remaining crude storage 95% max utilization (inversed) the market may only have around 10 days
left of practical onshore storage capacity for
Remaining gasoline storage capacity 50 crude oil.
-600 On 20 April, the WTI futures contract for May
Remaining gasoline storage 95% max utilization 2020 delivery defied gravity and settled for
the first time in negative territory at minus
Floating storage (crude) $37.63 a barrel, signalling that the market is
40 quickly realizing it is running out of practical
-800 Crude runs (demand) storage capacity.
Crude supply (with required shut-ins to balance) The bottleneck for refineries is motor
gasoline, where remaining storage capacity
0 = 31 March 2020 Days is expected to run out around end-April.
-1000 30
Pre 5 10 15 20 25 30 35 40 45 50 55 60 65 70 75 80 85 90
virus
Source: Oil Market Weekly by Rystad Energy
20Market segment focus: Energy Services
Capex cuts ‒ Global E&P players are slashing budgets
Planned E&P capex cuts by major oil players for 2020
Billion USD, real
30
25 Investments before cuts Investments after cuts
25
20
20 19
18
17
16
15 15
15 14
12 12
11
10 10
9
7
7
6 6
5
0
Source: Rystad Energy research and analysis
21Market segment focus: Renewables
Project economics in emerging countries slashed by the strengthening US dollar
7% 2.0 80
Solar PV & Utility Wind IRR Utility Solar PV Project
1.9
& FX scenarios Capex vs Offtakes prices 75
6%
1.8
70
Median CAPEX (A$/Wac)
PPA Prices (AUD/MWh)
5% 1.7
65
1.6
4%
1.5 60
IRR (%)
1.4
3% 55
1.3
50
2% 1.2
45
1.1
1%
1.0 40
2017 2018 2019 2020 2021
0%
Year Construction Begins
Start of 2020 20% currency fall 30% currency fall
Solar Wind Median CAPEX AUD/MWh
Source: Rystad Energy RenewableCube * Australian PPA prices vs median capital cost per MWac
22Table of Contents Executive summary Outbreak status and outlook Impact on oil demand Impact on the oil and gas industry Methodology 23
Infection Fatality Ratio – based on countries with high testing and low infected cases

 In this version of the report, we have
 updated our methodology to adjust for                                               Modelled                                                                  Empirical
 demographic parameters per country,                                                                                                                      IFR based
 i.e. age and sex (see next page). We                                                                      Average                                               on
 have also calibrated the Infection                           Country Standard
 Fatality Rate (IFR) with the latest                                                     Population            Age         Share Age and Sex               reported     Share    Share
 figures for 211 countries.                                                             (Thousands)                      female based IFR          Deaths      case    tested infected
                                                              Bahrain                         1 702            32.1       35.3 %      0.18 %            7    0.37 %      5.2 %   2.1 %

                                                    Group 2
 We have selected countries with:
                                                              Qatar                           2 881            32.6       24.8 %      0.16 %            9    0.15 %      2.2 %   9.3 %
 1) A large share of the population                           UAE                             9 890            32.3       30.9 %      0.15 %           43    0.59 %      7.8 %   0.9 %
    being tested (above 1.6%).                                Singapore                       5 850            41.5       47.7 %      0.55 %           11    0.14 %      1.6 %   8.5 %
 2) Relatively few infected people of
                                                              Australia                      25 500            39.2       50.2 %      0.67 %           71    1.07 %      1.7 %   1.5 %

                                                    Group 1
    those tested (median 2.0%).                               New Zealand                     4 822            39.2       50.8 %      0.66 %           12    0.83 %      1.8 %   1.7 %
                                                              Iceland                           341            38.9       49.8 %      0.64 %            9    0.51 %    12.0 %    4.3 %
 3) Infection has peaked.
                                                              Latvia                          1 886            43.2       53.9 %      0.81 %            5    0.68 %      1.9 %   2.0 %
 4) Isolated and well defined country                         Malta                             442            43.2       49.9 %      0.80 %            3    0.70 %      5.3 %   1.9 %
    (Islands or similar).
                                                              Latvia, Iceland,
 We have grouped countries into two
                                                              Malta and New
 groups; Group 1 are countries with an
 older population (~40 yrs) and Group 2                       Zealand                            7 491         40.4       51.5 %         0.724 %       29    0.66 %       2.5 %        2.3 %
 are countries with a younger                                 as above+ Australia,
 population (~32 yrs)                                         Singapore                         38 841         39.8       50.1 %         0.686 %      111    0.58 %       1.8 %        2.7 %
 Since there are still active cases, we                       Bahrain, UAE, Qatar               14 473         32.3       30.2 %         0.162 %       59    0.39 %       6.4 %        1.6 %
 expect a few additional fatalities                           Source: UN age statistics 5 year intervall;Rystad Energy COVID -19 model
 (empirical IFR up), but also that more
 infected people will be detected as
 testing continues (empirical IFR down).                      For the group of countries with a young                            These results are consistent with findings from the
                                                              population, empirical IFR is now 0.39%,                            Santa Clara county screening* and research from
 Results: For the group of countries                          significantly above our modelled IFR. Still, if                    the Diamond Princess cruise ship. However, when
 with an older population, empirical IFR                      three times more people are tested here with a                     applying these figures on young populations (and
 is now 0.66% (or 0.58% when                                  similar share infected, empirical IFR will be                      thus, the global population), IFR will be
 including Singapore and Australia),                          below the modelled IFR.                                            considerably lower than the 0.66% cited most
 slightly below our modelled IFR.                                                                                                places so far, namely 0.38%.

Source: Rystad Energy Covid-19 global model. *Bendavid et.al, COVID-19 Anitbody Seroprevalense in Santa Clara County, California, Stanford University Department of Medicine, 11 April 2020

24
Stay updated on our COVID-19 content In order for you to stay up to date on our releases regarding COVID-19 and the impact on the energy sector, we have two options for you: Sign up for Rystad Energy’s Free Solutions: As an industry professional you can sign up to Rystad Energy’s Free Solutions here. You will get full access to the library of free COVID-19 related releases and other energy related analytics and dashboards. Sign up for e-mail notifications: Sign up here to get immediate email notification when Rystad Energy publishes a new report / new press release associated to COVID-19. 25
OIL MARKET WEEKLY – Demand report, a weekly report with:
     • An overview of global oil demand
     • Oil demand impact in two COVID-19 mitigation scenarios
     • Impact of oil demand in aviation, ground transportation and road fuels

     OIL MARKET WEEKLY – Balances report:
     • A weekly Commentary with the latest oil market observations
     • A weekly Executive Summary on the oil market balances, oil supply and
       demand, and the overall oil market view

     OIL MARKET DASHBOARDS and Excel data on:
     • Oil demand analysis dashboard: split by country, transport type, aviation
     • COVID-19 dashboard: oil demand impacting two COVID-19 mitigation
       scenarios

26
Rystad Energy is an independent energy consulting services and business intelligence data firm offering global databases, strategy advisory and research products for energy companies and suppliers, investors, investment banks, organizations, and governments. Rystad Energy’s headquarters are located in Oslo, Norway. Headquarters Rystad Energy Fjordalléen 16, 0250 Oslo, Norway Americas +1 (281)-231-2600 EMEA +47 908 87 700 Asia Pacific +65 690 93 715 Email: support@rystadenergy.com © Copyright. All rights reserved.
You can also read