GLOBAL ECONOMIC OUTLOOK - THE ECONOMIC STORM IS PASSING EDC Economics April 1, 2021 - Export Development Canada
←
→
Page content transcription
If your browser does not render page correctly, please read the page content below

GLOBAL
ECONOMIC
OUTLOOK
THE ECONOMIC STORM IS PASSING

EDC Economics
April 1, 2021
Insights on the world’s key economies,
GDP growth, commodity prices,
interest rates and exchange rates.
OVERVIEW

    • In our spring 2021 Global Economic Outlook, EDC Economics is
      revising up its forecast for near-term global economic growth
      (notably in North America and China) reflecting:
       – significant additional fiscal policy support from the United States;
       – improvements in suppressing new COVID-19 cases globally;
       – continued progress on vaccine rollouts in systemically-important countries; and
       – better-than-expected momentum in Q1 2021 for key indicators.
    • Conversely, the economic outlooks in 2021 have been revised down for the
      Eurozone and Brazil due to worsening COVID-19 infections.

2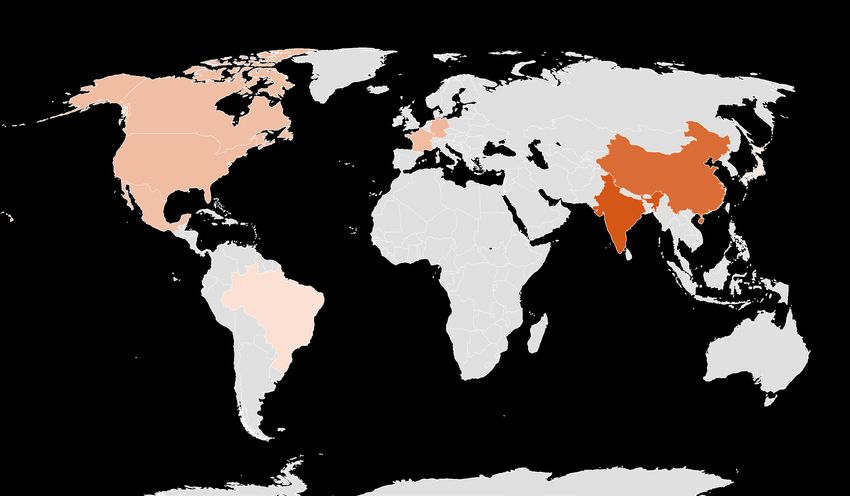
EXECUTIVE SUMMARY
    GLOBAL ECONOMIC OUTLOOK: THE ECONOMIC STORM IS PASSING
    By Peter Hall
    Vice-President and Chief Economist
    Economic stormwatchers might have been accused of spreading a bad April                There’s more: now that U.S. President Joe Biden’s administration’s US$1.9
    Fool’s joke this time last year. It was no joke; in almost every way, the fallout of   trillion stimulus program is official, it’s being written into forecasts. The plan
    the storm we know as COVID-19 couldn’t have been worse. Or as long: it just            calls for US$750 billion of this to hit the streets mere weeks from now, and
    kept coming back, again and again, in waves. Could it really be passing?               economists are unanimous that U.S. growth will in 2021 ring in at the 5%-6%
    We could all be forgiven for a little—or a lot—of cynicism. Our lives have been        level.
    so radically altered that this episode will leave a permanent mark on this             In response, we have raised the forecast for U.S. growth in 2021 to 6.3%, a
    generation. No more so than for those most affected: first-time workers, or            boost of over two percentage points from the release of our last outlook. That’s
    hopefuls; families with young children; workers in devastated parts of the             a massive upward revision, and despite Buy American fears, is having a
    service sector; frontline workers; and the list goes on. Everyone wants to leave       profound effect on global growth. Forecasts for other key nations have been
    this nasty phase in the dust; but can we? Will we?                                     revised up as a result, and upside risks to growth are now more likely.
    We’re getting a lot of help. First, new infection rates are a lot lower than a few     As a result, in our new spring 2021 Global Economic Outlook, EDC Economics
    weeks ago. Second, there’s growing evidence in medical circles of herd                 has increased the call for global growth to 6.4% for 2021, with a still-robust
    immunity. Finally, as vaccine rollouts increase, confidence in the economy’s           5.4% forecast for 2022, as stimulus, together with rising private sector activity,
    ability to return to normal will rise.                                                 spills into next year.
    Lower uncertainty has the strong potential to unleash a powerful force in the          The improved outlook for the U.S. economy will anchor the forecasts we see for
    economy: the massive pent-up savings accumulated over the months when                  the rest of the world, and will provide a boost to certain key economies. The
    there was a lot less to spend on. Once consumers reach the point of                    industrialized world is forecast to grow by 5.2%, mostly making up for last year’s
    willingness, these funds could hit the economy like a tidal wave.                      losses, but with enough in the tank to see a further 4.1% in 2022.

3
EXECUTIVE SUMMARY (continued)
    GLOBAL ECONOMIC OUTLOOK: THE ECONOMIC STORM IS PASSING

    Emerging economies will also benefit. China’s early rebound suggests strong          One of the key signs that a growth mentality is setting in is the nascent focus
    support for its 10.8% bounce this year, while India, a little slower off the mark,   on inflation. With an ocean of available liquidity and growth on the rise,
    is expected to see a whopping 12.3% pop. Overall, emerging markets look to           there’s increasing worry that the inability to ramp up production will set off
    add an impressive 7.1% this year, with 6.2% more to come in 2022.                    price pressures that we haven’t seen in decades. In short, the global economy
    Following a decline of 5.3%, Canada is forecast to see a rebound of 5.5% this        has the capacity to handle the ramp-up in activity, but there likely will be
    year, followed by above-average 4.1.% growth in 2022. Average forecasts were         constraints in the short run, which will temporarily lift prices above target
    revised up smartly in the wake of the U.S. stimulus news, and created a buzz         growth. As long as these increases don’t get entrenched into expectations,
    of conversation about accommodating growth possibilities this year and next.         inflation should remain contained.

    Growth has shaken up commodity prices already. Copper, facing short-run              Commodity price increases have given lift to the Canadian dollar, which is
    constraints, has spiked in recent days and is now far above initial expectations.    forecast to average US$0.79 this year and next.
    Uncertainty is keeping precious metal prices high, but they should fade
    somewhat in 2022. Oil and gas prices are the biggest surprise. Initially             The bottom line?
    expected to be weaker than usual, higher growth and short-run supply                 Big growth is hitting the U.S.—and global—economies in mere weeks. This is
    constraints have pushed our forecast for West Texas Intermediate crude to just       the best short-run news since the pandemic hit a year ago. All being well, the
    under US$57 for this year, before edging down to US$55 in 2022.                      fiscal boost should encourage private spending, finally lifting us from
                                                                                         COVID-19’s quagmire. Enjoy!

4
RECENT
DEVELOPMENTS
5CONFIRMED COVID-19 CASES
COVID-19 spread across the globe with the highest number of cases reported in the United States, Brazil and India.
With many government restrictions reimposed, new case counts fell in early 2021, but began to creep up in March
driven by new variants.
Global confirmed new COVID-19 cases Stringency of government restrictions for G7 countries
Daily change, thousands, five-day average Index value, maximum=100
1,200
100
U.K.
1,000 Germany Italy
U.S. 80
Canada
29.5M
800 France
U.S.
60
600
Japan
40
400
200 20
0 0
Jan-20 Mar-20 May-20 Jul-20 Sep-20 Nov-20 Jan-21 Mar-21 Jan-20 Mar-20 May-20 Jul-20 Sep-20 Nov-20 Jan-21 Mar-21
Sources: EDC Economics; Johns Hopkins Coronavirus Resource Center; Oxford University.
6COVID-19 VACCINE DISTRIBUTION
Vaccines were developed and approved in record time, as distribution began in December 2020. Israel has had by
far the fastest rollout, along with notable success in the U.K. and U.S.; most emerging markets are lagging behind.
Vaccine doses administered
Per 100 adults, as of March 16, 2021
109.7
66.5
37.2
32.6
14.2 12.1 11.3 10.8 10.4 8.4 4.9 3.4
Israel UAE United United Denmark Spain Italy Germany France Canada World Mexico
Kingdom States
Sources: Haver Analytics, EDC Economics; Oxford University
7UNPRECEDENTED GLOBAL POLICY RESPONSE
To address COVID-19, rapid central bank interest rate cuts and various large-scale asset purchase programs were
followed by massive expansions in direct support for households and businesses in order to maintain liquidity.
In March, U.S. President Joe Biden’s administration passed that country’s third major fiscal support package.
Monetary policy G7 Direct Fiscal Measures to COVID-19
As of March 17, 2021, % of GDP
U.S. Federal Reserve
150 bps rate cuts to effective lower bound (ELB) of 0.0-0.25%
Bank of Canada
150 bps rate cuts to ELB of 0.25%
European Central Bank
Operating at ELB of -0.5%
Bank of England
65 bps rate cuts to ELB at 0.1% 25.5
Bank of Japan
18.9
Already operating at ELB at -0.1% 15.6 14.6
People’s Bank of China 11.0
8.6 7.7
Various term lending rates cut to ease financial conditions
Central bank asset purchases have grown rapidly, United United Japan Canada Germany Italy France
and in G7 countries has been more than three times larger States Kingdom
than the 2008-2009 global financial crisis.
8 Sources: EDC Economics; IMF COVID-19 policy tracker.PURCHASING MANAGERS’ INDICES
Manufacturing orders fell first in China, but bounced back once the pandemic came under control there. The rebound
in Asia was followed by the U.S. and Europe. And while the U.S. continues to show strength, unfortunately European
orders have slowed in recent months, leading to some decoupling across the global economies key engines of growth.
Purchasing managers’ indices
50+ = expansion
60
50
40
30
Canadian jobs in
“high-COVID-risk”
20 sectors
10
2017 2018 2019 2020 2021
U.S. Euro Area China
9 Sources: Haver Analytics, EDC EconomicsFINANCIAL MARKETS
Aided by massive policy support, equity markets have been buoyant, running well above pre-pandemic levels, but
with large variation across sectors. Corporate borrowing costs and emerging market bond spreads fell from distressed
levels early in the pandemic, but began inching up in March due to spillovers from rising inflation concerns in the U.S.
Global stock markets Global debt markets
% change since Jan. 1 2020 %
50% 14 7
40% 12 6
30%
10 5
20%
10% 8 4
0%
6 3
-10%
-20% 4 2
-30% 2 1
-40%
0 0
Jan Mar May Jul Sep Nov Jan Mar
Jan Mar May Jul Sep Nov Jan Mar
S&P 500 Emerging Markets TSX U.S. Corp. Yield: B Rated (%, lhs) EM Bond Spread (bps, rhs)
10 Sources: Haver Analytics, EDC Economics; EDC Global Financial Markets.COMMODITY PRICES
Commodity prices have grown steadily from early pandemic lows. Forestry prices have led the way, supported by
strong housing demand. Agriculture demand has been resilient. Metals, and more recently, energy prices have
benefited from the stronger-than-expected global economic recovery.
EDC commodity indices
Index 2017 = 100
250
200
150
100
50
0
2017 2018 2019 2020 2021
Forestry EDC Commodity Index Metals Agriculture Energy
11 Sources: Haver Analytics, EDC Economics; The Commodity TrackerOIL PRICES
Oil prices have gained considerable strength in 2021, given growing evidence of recovering demand
and restrained supply from key producers.
Oil prices
January 2020: China
$USD per barrel confirms COVID-19 cases
80 January 2021: OPEC+ meeting
March 7: OPEC+ agreement falls when Saudi Arabia agreed
apart and Saudi Arabia increases to production cuts.
60 production and cuts prices
40
20 April 12: OPEC+ agrees
to cut production
0
April 20: Settlement date for May oil
-20 futures contracts. Lack of demand and
limited storage capacity causes prices
to temporarily go negative.
-40
Jul-19 Oct-19 Jan-20 Apr-20 Jul-20 Oct-20 Jan-21
West Texas Intermediate Western Canada Select
12 Sources: Haver Analytics, EDC EconomicsCONFIDENCE
Canadian confidence has improved rapidly from the depths of the initial shutdown, with both businesses
and consumers now above pre-pandemic levels.
Business and consumer confidence indices
70
Business
60
50 Consumer
40 Canadian jobs in
“high-COVID-risk”
sectors
30
20
2014 2015 2016 2017 2018 2019 2020 2021
Sources: Nanos Canadian consumer sentiment index, CFIB business barometer
13CONSUMERS
Retail sales took a major hit during the initial lockdowns, but activity shifted online and spending quickly recovered.
With increased government transfers and limited ability to spend on high-contact services, savings rates spiked
and high-income households now have large cash reserves, which will support future spending.
Retail sales Savings rates
% change from January 2020 % of disposable income
10 Canada 30
5 U.S.
25
0
-5 20
-10
Euro Area Euro
15 Area
-15
-20 10 U.S.
-25
5
-30 Canada
-35 0
Jan-20 Mar-20 May-20 Jul-20 Sep-20 Nov-20 Jan-21 2007 2010 2013 2016 2019
14 Sources: Haver Analytics, EDC EconomicsAIR TRAVEL
After restrictions grounded most international flights, there was an initial lockdown rebound in summer 2020,
followed by a long period of subdued, but stable, activity. Flight traffic has increased recently, but remains 35%
below pre-COVID-19 levels.
Daily active commercial flights
Weekly global average
120,000
100,000 Holiday break
35%
decline
80,000
60,000
40,000
20,000
0
Jan-20 Mar-20 May-20 Jul-20 Sep-20 Nov-20 Jan-21 Mar-21
15 Source: Flightradar24GLOBAL TRADE
Goods trade was hit hard during shutdowns from March to May 2020, but rebounded much faster-than-
expected to finish 2020 above year-ago levels. In 2021, there are now reports of cargo container shortages.
Services trade, particularly tourism, has been hit harder and more persistently due to border closings.
Global merchandise trade volumes
Annual % change
10%
5%
0%
-5%
-10%
-15%
-20%
2017 2018 2019 2020
16 Sources: CPB Netherlands Bureau for Economic Policy Analysis, WTO October 2020 Trade ForecastCANADIAN TRADE
Like global trade, Canadian goods trade rebounded quickly with a V-shape driven by restarting factories. January’s
export data were remarkably strong. Conversely, travel and transportation services have suffered an L-shaped
setback in Canada and across the world.
Merchandise trade Services trade
Billions of dollars Billions of dollars
55 15
14
50
13
45 12
11
40 10
9
35
8
30 7
2016 2017 2018 2019 2020 2021 2016 2017 2018 2019 2020 2021
Exports Imports Exports Imports
17 Source: Statistics CanadaLABOUR MARKET
To date, the rebound in overall hours worked in Canada has out-performed the United States, but both countries
still have further to go to reach pre-pandemic levels.
Total hours worked
Millions, monthly
4,500 630
4,400 610
4,300 590
4,200 Canada (RHS) 570
4,100 550
4,000 530
3,900 510
U.S. (LHS)
3,800 490
3,700 470
3,600 450
2007 2008 2009 2010 2011 2012 2013 2014 2015 2016 2017 2018 2019 2020 2021
Sources: Haver Analytics, EDC Economics.
18LABOUR MARKETS CONTINUED
Service jobs have been hit hardest in areas such as restaurants, retail and recreation. Alternatively, jobs have
increased in services that can be delivered online, such as professional, education, finance and public administration.
Goods and services employment Canadian sectoral employment changes
Annual % change February 2021, thousands of jobs year-over-year change
5 Accommodation and food services
Services Retail and wholesale trade
Information, culture and recreation
0 Business, building and other support…
Construction
Transport and warehousing
-5 Goods Other services
Agriculture
Health care and social assistance
-10 Manufacturing
Utilities
Forestry, fishing, mining, oil and gas
-15 Public administration
Finance, insurance, and real estate
Educational services
In GDP
-20at risk Professional, scientific and technical
2008 2010 2012 2014 2016 2018 2020 -350 -300 -250 -200 -150 -100 -50 0 50 100
19 Sources: Haver Analytics, EDC EconomicsGLOBAL
ECONOMIC
OUTLOOK
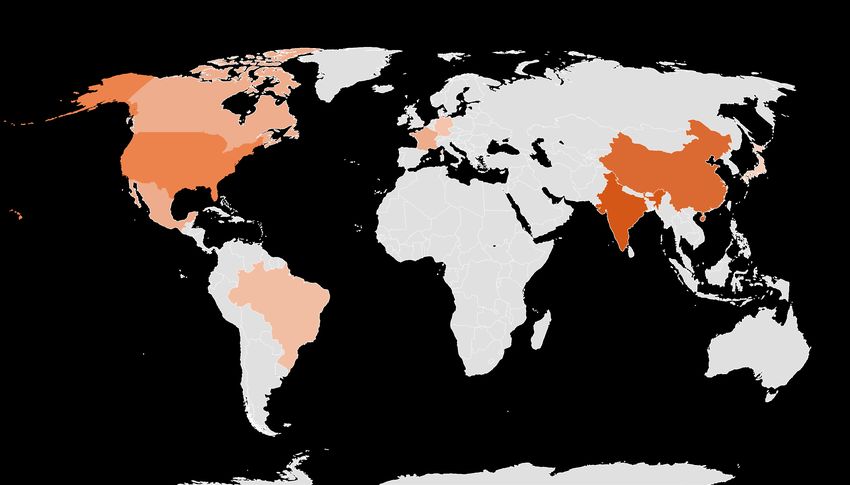
202021 GROWTH OUTLOOK
6.4%
Real GDP growth, %
World
5.5 3.7
6.3
5.6
10.8 3.0 5.2%
12.3 Developed
5.6
4.2
7.1%
Emerging
21 Source: EDC Global Economic Outlook, April 20212022 GROWTH OUTLOOK
5.4%
Real GDP growth, %
World
4.1 4.4
3.9
4.2
7.4 2.5 4.1%
8.3 Developed
4.0
2.7
6.2%
Emerging
22 Source: EDC Global Economic Outlook, April 2021REAL GDP GROWTH
Global Economic Outlook 2020 2021* 2022*
(Annual % change)
Developed countries -4.8 5.2 4.1
Canada -5.3 5.5 4.1
United States -3.5 6.3 3.9
Eurozone -6.8 4.3 4.4
Germany -5.3 3.7 4.4
France -8.2 5.6 4.2
Japan -4.9 3.0 2.5
Emerging countries -2.6 7.1 6.2
China 2.3 10.8 7.4
India -6.9 12.3 8.3
Brazil -4.2 4.1 2.7
Mexico -8.5 5.6 4.0
Total World -3.5 6.4 5.4
Note: * denotes the forecast period.
Source: EDC Global Economic Outlook, April 2021
23CHANGES FROM PREVIOUS FORECAST
Global Economic Outlook 2021* 2022*
Real GDP Growth (percentage point change)
Developed countries 1.0 0.1
Canada 1.1 0.1
United States 2.2 -0.1
Eurozone -0.6 0.4
Germany -0.9 0.8
France -1.3 1.0
Japan -0.1 0.2
Emerging countries 0.6 0.2
China 1.7 1.5
India -0.2 -3.6
Brazil -0.7 0.5
Mexico 0.0 -0.4
Total World 0.7 0.2
Note: * denotes the forecast period. Green shading denotes upward adjustments; red shading denotes downward adjustments.
Source: EDC Global Economic Outlook, April 2021 relative to January 2021.
24CURRENCIES AND INTEREST RATES
Global Economic Outlook 2020 2021* 2022*
Currency Exchange Rate
U.S. dollar USD per CAD 0.75 0.79 0.79
Euro CAD per EUR 1.53 1.53 1.54
Euro USD per EUR 1.14 1.21 1.22
Interest Rates, annual average
Bank of Canada, Overnight Target Rate 0.56 0.25 0.25
U.S. Federal Reserve, Fed Funds Target Rate (Upper limit) 0.39 0.10 0.10
European Central Bank, Policy Interest Rate 0.00 0.00 0.00
Note: * denotes the forecast period.
Source: EDC Global Economic Outlook, April 2021
25COMMODITY PRICES
Global Economic Outlook 2020 2021* 2022*
Brent Crude Spot, USD / bbl 41.76 57.15 57.43
West Texas Intermediate, USD / bbl 39.27 56.75 54.68
Western Canada Select, USD / bbl 27.82 40.71 43.68
Natural Gas, USD / MMBtu 2.02 2.76 2.80
Gold, USD / troy ounce 1,770 1,770 1,730
Copper, USD / tonne 6,170 8,790 7,575
Note: * denotes the forecast period.
Source: EDC Global Economic Outlook, April 2021
26KEY FORECAST ASSUMPTIONS
COVID-19 Financial conditions
EDC Economics’ base case forecast includes the significant wave of new Central banks around the world are expected to continue to provide
COVID-19 cases in North America, Europe and other regions in January extraordinary liquidity to maintain market functioning and overall
2021. Despite the fact many governments tightened restrictions, our financial stability. The base case forecast doesn’t include any systemic
forecast assumes these responses will generally be more decentralized financial crises resulting from the COVID-19 pandemic. However, our
and location-specific than the economy-wide lockdowns used earlier, outlook doesn’t rule out the potential for localized debt defaults in some
and that there’ll be less economic disruption. sectors and amongst some emerging markets during the later stages of
In the first wave, companies were forced to adapt on the fly, changing the recovery as debt overhangs are worked out.
how they do business in an environment of significant distress and
uncertainty; in subsequent waves of infections, many companies and
households will apply these learnings to mitigate the economic impacts.
Vaccines distribution began to ramp up in early 2021. We assume
vaccines won’t be widely adopted in advanced economies until the
second half of 2021, and notably later in emerging economies.
27KEY RISKS TO THE FORECAST
Given rapidly changing global events, there’s a higher-than-usual degree of uncertainty
around this forecast, which incorporates information available as of March 19, 2021.
Key upside risks Key downside risks
• The unprecedented government support in play across advanced • New variants of the virus could lead to further spikes in COVID-19
economies could lead to a very strong recovery once vaccines are cases, hospitalizations and mortality, leading governments to
rolled out broadly, as significant “pent-up demand” is released into reimpose strict lockdowns.
the economy.
• Given the highly unequal nature of the COVID-19 shock across sectors,
• The rapid adoption of new technologies and shift of economic activity labour market “scarring” could reduce labour force participation for
online due to COVID-19 lockdowns, includes e-commerce, remote those in some of the hardest hit sectors, and eventual insolvencies of
work, automation and more. These changes could drive a productivity SMEs and other adjustment costs of reallocating capital and labour
revival leading to a virtuous cycle of improved consumer, business and across sectors could significantly slow the recovery, even after the
financial market confidence, stronger spending and investments, and pandemic is under control.
a prolonged period of growing financial wealth due to strengthening
asset prices in equities and housing.
28DISCLOSURE
Ce document est également disponible en français.
This document isn’t intended to provide specific advice and shouldn’t be relied on as such. It’s intended as an
overview only. No action or decision should be taken without detailed independent research and professional
advice concerning the specific subject matter of such action or decision. While Export Development Canada
(EDC) has made reasonable commercial efforts to ensure that the information contained in this document is
accurate, EDC doesn’t represent or warrant the accurateness, timeliness or completeness of the information
contained herein. This document or any part of it may become obsolete at any time. It’s the user’s responsibility
to verify any information contained herein before relying on such information. EDC isn’t liable in any manner
whatsoever for any loss or damage caused by or resulting from any inaccuracies, errors or omissions in the
information contained in this document. This document isn’t intended to and doesn’t constitute legal or tax
advice. For legal or tax advice, please consult a qualified professional. EDC is the owner of trademarks and
official marks. Any use of an EDC trademark or official mark without written permission is strictly prohibited.
All other trademarks appearing in this document are the property of their respective owners. The information
presented is subject to change without notice. EDC assumes no responsibility for inaccuracies contained herein.
Copyright © 2021 Export Development Canada. All rights reserved.
29You can also read