GLOBAL ECONOMIC OUTLOOK - GLOBAL OUTLOOK: HOPE DEFERRED EDC Economics Jan. 28, 2021 - Export Development Canada
←
→
Page content transcription
If your browser does not render page correctly, please read the page content below

GLOBAL
ECONOMIC
OUTLOOK
GLOBAL OUTLOOK: HOPE DEFERRED

EDC Economics
Jan. 28, 2021
Insights on the world’s key economies,
GDP growth, commodity prices,
interest rates and exchange rates.
EXECUTIVE SUMMARY
    GLOBAL ECONOMIC OUTLOOK: HOPE DEFERRED
    By Peter Hall
    Vice-President and Chief Economist
    It wasn’t supposed to be this way. 2020 began on an optimistic note with the      Second, there was ample evidence of pent-up demand ahead of the pandemic’s
    promise that a fresh start would help. But just days later, COVID-19 hit China    onset. Third, there has been a groundswell of mid-pandemic, pent-up demand.
    and within weeks became a worldwide pandemic. Deadlines for defeating the         Without nearly the range of consumables to spend on, those with jobs have
    coronavirus have come and gone, dashing hopes repeatedly. One year on,            socked away trillions in savings, electing to park them in spending-ready bank
    infections are rising, and new restrictions have again clamped down on the        accounts. Businesses have done the same. To the extent possible, stimulus
    economy. “Double-dip” is coming back into street-speak. With this poor start,     cheques have likely been stashed away, too. All this points to capacity to
    how will the world economic outlook fare?                                         unleash spending when conditions improve.
    First and foremost, it all hangs on the pandemic. Current infection numbers are   Fourth, with all the challenges hitting international trade, like anti-globalization,
    discouraging. Hopes are pinned almost squarely on the vaccination programs.       unanticipated new tariffs, fear of cross-border infection and populism—which
    With two vaccines testing at a 95% efficacy rate, and a third with impressive     often breeds a misguided protectionism—exports are also on the up-and-up.
    numbers, we’re ahead of where we thought we’d be last fall. Broad distribution    Globally, merchandise trade is in the throes of a V-shaped recovery.
    is expected by mid-2021. If all goes well, the move back to normal should         Renewed lockdowns haven’t changed fundamental conditions, but they have
    power growth through the second half of the year and into 2022.                   delayed things, changing the shape of the overall forecast. As such, Export
    How can we be so sure? First, much economic activity has already discovered       Development Canada’s Economics’ team’s latest Global Economic Outlook
    how to work around COVID-19. A large majority of workers around the world         expects growth that is somewhat softer this year than initially expected, with
    kept working full time, and a large portion of those who didn’t have returned     the first half of 2021 bearing the brunt of the weakness. We have revised 2021
    to work. This has helped to power an impressive rebound in retail sales, a sign   growth down to 5.7% to reflect this. The second-half rebound will show up
    that the consumer—a dominant force in most economies—is alive and well.           more in 2022, where we have revised world growth up to 5.2%.

2
EXECUTIVE SUMMARY (continued)
    GLOBAL ECONOMIC OUTLOOK: HOPE DEFERRED

    Emerging markets will outperform the developed world, growing 6.5% this            The Canadian dollar will drift upward slowly over the forecast horizon,
    year and 6% in 2022, powered in good part by China’s rapid and resilient           averaging US0.76 cents this year and US0.77 cents in 2022.
    recovery. The developed world will be held back by punishing lockdowns,
    which in certain cases are producing a red-ink first quarter. Incidentally,        The bottom line?
    despite perceptions, the United States’ economy has outperformed the               As the proverb goes, hope deferred makes the heart sick. Serial
    developed-world average, declining by a more modest -3.4% last year and            disappointment is weighing on the economy, testing patience, provoking
    staging a decent second-half recovery, which will lift 2021 growth to 4.1%.        dissent. But the proverb continues: desire fulfilled is a tree of life.
    Canada’s experience has been more turbulent, although the decline in 2020          Fundamentals still strongly suggest a return to growth—in time to keep hopes
    wasn’t nearly as deep as initially feared. From an estimated drop of -5.6% in      from getting snuffed out. It couldn’t come soon enough.
    2020, Canada will rebound by 4.4% in 2021 and by 4% next year.
    World prices for commodities are also faring better than initially expected, fed
    in part by China’s nascent voracious demand. Oil and gas prices are currently
    almost fully back from the abyss, although supply conditions will keep things
    suppressed as the economy recovers. Base metal prices will be resilient over
    the short term, and precious metals are up due to uncertainty.
    Fiscal and monetary policy are generally expected to remain in stimulative
    mode this year, hanging in until there’s more assurance about growth. The
    withdrawal of public spending measures will likely begin toward year-end and
    into 2022, but monetary tightening is unlikely before 2023.
3
KEY ASSUMPTIONS
    Given rapidly changing global events, there’s a higher-than-usual degree of uncertainty
    around this forecast, which incorporates information available as of Nov. 30, 2020.

    COVID-19                                                                    Financial conditions
    EDC Economics’ base case forecast assumes a significant second wave of      Central banks around the world are expected to continue to provide
    rising COVID-19 cases in North America, Europe and other regions.           extraordinary liquidity to maintain market functioning and overall
    However, despite the fact many governments have tightened                   financial stability. The base case forecast doesn’t include any systemic
    restrictions, the forecast assumes these responses will generally be        financial crises resulting from COVID-19 pandemic. However, the outlook
    more decentralized and location-specific than the economy-wide              doesn’t rule out the potential for localized debt defaults in some sectors
    lockdowns used previously, and that there’ll be less economic               and amongst some emerging markets during the later stages of the
    disruption. In the first wave, companies were forced to adapt on the fly,   recovery as debt overhangs are worked out.
    changing how they do business in an environment of significant distress
    and uncertainty; in the second wave, many companies and households          U.S.-China trade relations
    will apply these learnings to mitigate economic impacts.                    The forecast assumes the Phase One trade agreement signed in January
                                                                                2020 remains in place.
    Reliable vaccines are being developed, with distribution expected to
    ramp up in early 2021. We assume the vaccines won’t become widely           Brexit
    available and adopted until the second half of 2021.                        The forecast assumes a relatively orderly transition for the United
    U.S. fiscal policy                                                          Kingdom and European Union, based upon a broad trade agreement,
    The forecast for the U.S. economy is based on long-term fundamentals        which will include adjustment pains, but will ultimately allow essentially
    and policies currently in place. Any updated policies as a result of the    “free trade” to continue for most goods traded between the EU and U.K.
    election will be incorporated after enacting legislation is passed.

4
RECENT
DEVELOPMENTS
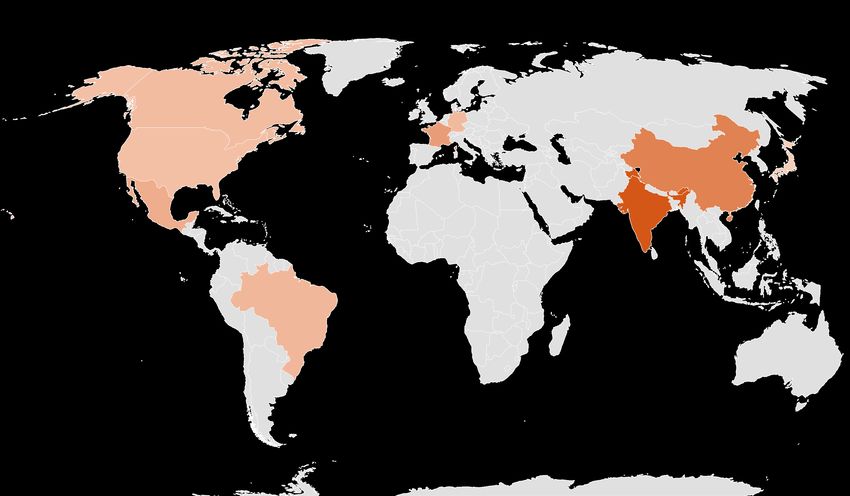
5CONFIRMED COVID-19 CASES
COVID-19 has spread across the globe, with the highest number of cases reported in the United States, followed by
India and Brazil. In 2021, case counts continue to rise, necessitating additional containment measures.
99 million Global confirmed cases
World total 1,200
Daily change, thousands, five-day average
Canada U.K. Russia
676K 3.1M France 3.7M 1,000
U.S. Spain 3.1M
2.5M Italy
25.1M China 800
2.5M
Mexico India 99K
1.8M 10.7M 600
Peru 400
1.0M Brazil
8.8M South
Africa 200
1.4M
0
Mar Apr May Jun Jul Aug Sep Oct Nov Dec Jan
As of Jan. 25, 2021
Sources: EDC Economics; Johns Hopkins Coronavirus Resource Center.
6COVID-19 VACCINE DISTRIBUTION
Several vaccines were approved in record time and distribution began across several countries in December 2020.
Despite these successes, significant production and logistics challenges remain to effectively inoculate populations.
Vaccine doses administered
Per 100 people, as of Jan. 25, 2021
39.4
23.7
9.3
5.8
3.4 2.5 2.2 2.1 2.0 1.4 0.8 0.5
Israel UAE United United Denmark Spain Italy Canada Germany France World Mexico
Kingdom States
Sources: Haver Analytics, EDC Economics; Oxford University
7FINANCIAL MARKETS
Aided by unprecedented policy support, equity markets have been especially buoyant, surpassing pre-COVID-19
levels—although with large variation across sectors; while corporate borrowing costs and emerging market bond
spreads have fallen back from distressed levels early in the pandemic.
Global stock markets Global debt markets
% change since Jan. 1 2020 %
40% 14 7
30% 12 6
20%
10 5
10%
8 4
0%
-10% 6 3
-20% 4 2
-30% 2 1
-40%
0 0
Jan Feb Mar Apr May Jun Jul Aug Sep Oct Nov Dec Jan
Jan Feb Mar Apr May Jun Jul Aug Sep Oct Nov Dec Jan
S&P 500 Emerging Markets TSX U.S. Corp. Yield: B Rated (%, lhs) EM Bond Spread (bps, rhs)
8 Sources: Haver Analytics, EDC Economics; EDC Global Financial Markets.COMMODITY PRICES
Commodity prices have rebounded from early pandemic lows. Metal prices have led the way, supported by supply
disruptions and global uncertainty. Agriculture demand remained resilient despite the turbulence, while energy
prices have been the most volatile, and remain down the most, given subdued demand.
EDC commodity indices
2017 = 100
140
120
100
80
60
40
20
0
2017 2018 2019 2020 2021
EDC Commodity Index Energy Metals Agriculture
9 Sources: Haver Analytics, EDC Economics; The Commodity TrackerOIL PRICES
Oil prices have continued to strengthen over recent months given recovering demand,
although the ability of key producers to restrain supply to support prices remains uncertain.
January 2020: China
confirms COVID-19 cases
80 January 2021: OPEC+ meeting
Mar. 7: OPEC+ agreement falls where Saudi Arabia cut
apart and Saudi Arabia increases production to stabilize market
60 production and cuts prices with Russia opposing.
Apr. 12: OPEC+ agrees
to cut production
40
20
0
Apr. 20: Settlement date for May oil
futures contracts. Lack of demand and
-20 limited storage capacity causes prices
to temporarily go negative.
-40
01-Aug-19 13-Sep-19 28-Oct-19 10-Dec-19 22-Jan-20 05-Mar-20 17-Apr-20 01-Jun-20 14-Jul-20 26-Aug-20 08-Oct-20 20-Nov-20 04-Jan-21
Western Canada Select (WCS), US$/bbl West Texas Intermediate (WTI), US$/bbl
10 Sources: Haver Analytics, EDC EconomicsINTERNATIONAL AIR TRAVEL
Travel restrictions grounded most international air travel, which has stabilized since summer to remain roughly
40% below pre-COVID-19 levels, notwithstanding a brief bump during the December holiday season.
Daily active commercial flights
Weekly global average
120,000
100,000
Holiday break
39%
decline
80,000
60,000
40,000
20,000
0
10-Jan-20 19-Feb-20 30-Mar-20 9-May-20 18-Jun-20 28-Jul-20 6-Sep-20 16-Oct-20 25-Nov-20 4-Jan-21
11 Source: Flightradar24GLOBAL TRADE
Goods trade was hit hard during shutdowns in March through May 2020, but rebounded quickly
after the initial reopening phase. Services trade has been hit harder and more persistently
due to border closings and social distancing requirements.
Global merchandise trade volumes
annual % change
8% Latest WTO forecast for goods
6% trade is a 9% drop in 2020,
4% followed by a 7% rise in 2021.
2%
0%
-2%
-4%
-6%
-8%
-10%
-12%
-14%
-16%
-18%
2017 2018 2019 2020
12 Sources: CPB Netherlands Bureau for Economic Policy Analysis, WTO October 2020 Trade ForecastCANADIAN TRADE
Much like global trade patterns, Canadian goods trade rebounded quickly with a V-shape
driven by restarting auto plants, while travel and transportation services have suffered an L-shaped setback.
Merchandise trade Services trade
Billions of dollars Billions of dollars
55 15
14
50
13
45 12
11
40 10
9
35
8
30 7
2015 2016 2017 2018 2019 2020 2015 2016 2017 2018 2019 2020
Exports Imports Exports Imports
13 Source: Statistics CanadaCONFIDENCE
Canadian confidence has improved notably from the depths of the initial shutdown,
with confidence for businesses rebounding faster than for consumers.
Business and consumer confidence indices, monthly
70
Business
60
50
Consumer
40 Canadian jobs in
“high-COVID-risk”
sectors
30
20
2014 2015 2016 2017 2018 2019 2020
Sources: Nanos Canadian consumer sentiment index, CFIB business barometer
14LABOUR MARKET
The stronger-than-expected rebound in mid-2020 has slowed in recent months─reversing progress
in December─as rising COVID-19 cases led to further restrictions in hard-hit service sectors.
Total weekly hours worked
Millions, monthly
4,500 650
4,400 630
4,300 610
4,200 590
Canada (RHS)
4,100 570
4,000 550
3,900 530
3,800 510
U.S. (LHS)
3,700 490
3,600 470
3,500 450
2007 2008 2009 2010 2011 2012 2013 2014 2015 2016 2017 2018 2019 2020
Sources: Haver Analytics, EDC Economics.
15LABOUR MARKETS CONTINUED
In-person services jobs have been hit hardest in areas such as restaurants, recreation and construction.
Alternatively, jobs have increased in some sectors where work can be done online, such as professional
and educational services.
Goods and services employment Canadian employment changes, by sector
year-over-year % change December 2020, thousands of jobs year-over-year change
5 Accommodation and food services
Services Information, culture and recreation
Construction
0 Other services
Business, building and other support…
Transport and warehousing
-5 Goods Health care and social assistance
Retail and wholesale trade
Agriculture
-10 Forestry, fishing, mining, oil and gas
Utilities
Public administration
-15 Finance, insurance, and real estate
Manufacturing
Educational services
In GDP
-20 at risk Professional, scientific and technical
2008 2010 2012 2014 2016 2018 2020 -350 -300 -250 -200 -150 -100 -50 0 50 100
16 Sources: Haver Analytics, EDC EconomicsPURCHASING MANAGERS’ INDICES
Manufacturing orders fell first in China, but bounced back once the virus came under control in China. The rebound
in Asia was followed by the U.S. and Europe, but unfortunately the latter has stalled out in recent months.
Purchasing managers’ indices
50+ = expansion
60
50
40
30
Canadian jobs in
“high-COVID-risk”
20 sectors
10
2016 2017 2018 2019 2020
U.S. Euro Area China
17 Sources: Haver Analytics, EDC EconomicsUNPRECEDENTED GLOBAL POLICY RESPONSE
To address COVID-19, rapid central bank interest rate cuts and various large-scale asset purchase programs were
followed by massive expansions in direct support for households and businesses in order to maintain liquidity.
Monetary policy G7 Direct Fiscal Measures to COVID-19
As of Jan. 12, 2021, % of GDP
U.S. Federal Reserve
150 bps rate cuts to effective lower bound (ELB) of 0.0-0.25%
Bank of Canada
150 bps rate cuts to ELB of 0.25%
European Central Bank
Operating at ELB of -0.5%
Bank of England
65 bps rate cuts to ELB at 0.1% 16.3% 16.1%
Bank of Japan 12.9%
11.8%
Already operating at ELB at -0.1%
8.3%
People’s Bank of China
5.3% 5.2%
Various term lending rates cut to ease financial conditions
Central bank asset purchases have grown rapidly, United Canada Japan United Germany Italy France
and in G7 countries has been more than three times larger States Kingdom
than the 2008-2009 global financial crisis.
18 Sources: EDC Economics; IMF COVID-19 policy tracker.GLOBAL
ECONOMIC
OUTLOOK
192021 GROWTH OUTLOOK
5.7%
Real GDP growth, %
World
4.4 4.6
4.1
6.9
9.1 3.1 4.2%
12.5 Developed
5.6
4.8
6.5%
Emerging
20 Source: EDC Global Economic Outlook, January 20212022 GROWTH OUTLOOK
5.2%
Real GDP growth, %
World
4.0 3.6
3.9
3.2
5.9 2.3 3.9%
11.9 Developed
4.4
2.2
6%
Emerging
21 Source: EDC Global Economic Outlook, January 2021REAL GDP GROWTH
Global Economic Outlook 2020 2021* 2022*
(Annual % change)
Developed countries -5.2 4.2 5.2
Canada -5.6 4.4 4.0
United States -3.4 4.1 3.9
Eurozone -7.0 4.9 3.9
Germany -5.2 4.6 3.6
France -8.3 6.9 3.2
Japan -5.3 3.1 2.3
Emerging countries -3.4 6.5 6.0
China 1.7 9.1 5.9
India -10.4 12.5 11.9
Brazil -4.2 4.8 2.2
Mexico -8.9 5.6 4.4
Total World -4.1 5.7 5.2
Note: * denotes the forecast period.
Source: EDC Global Economic Outlook, January 2021
22CHANGES FROM PREVIOUS FORECAST
Global Economic Outlook 2021* 2022*
Real GDP Growth (percentage point change)
Developed countries -1.5 0.6
Canada -1.3 0.6
United States -0.8 0.1
Eurozone -2.1 1.3
Germany -1.7 1.9
France -2.0 0.7
Japan -1.5 0.8
Emerging countries -0.5 0.2
China 0.1 0.1
India -3.6 2.7
Brazil 0.8 -0.2
Mexico -0.3 1.1
Total World -0.9 0.3
Note: * denotes the forecast period.
Source: EDC Global Economic Outlook, January 2021 relative to October 2020.
23CURRENCIES AND INTEREST RATES
Global Economic Outlook 2020 2021* 2022*
Currency Exchange Rate
U.S. dollar USD per CAD 0.75 0.76 0.77
Euro CAD per EUR 1.53 1.55 1.53
Euro USD per EUR 1.14 1.18 1.19
Interest Rates, annual average
Bank of Canada, Overnight Target Rate 0.56 0.25 0.24
U.S. Federal Reserve, Fed Funds Target Rate (Upper limit) 0.39 0.10 0.10
European Central Bank, Policy Interest Rate 0.00 0.00 0.00
Note: * denotes the forecast period.
Source: EDC Global Economic Outlook, January 2021
24COMMODITY PRICES
Global Economic Outlook 2020 2021* 2022*
Brent Crude Spot, USD / bbl 41.72 48.71 51.58
West Texas Intermediate, USD / bbl 39.36 44.82 47.69
Western Canada Select, USD / bbl 27.85 29.66 32.53
Natural Gas, USD / MMBtu 2.06 2.37 2.25
Gold, USD / troy ounce 1,770 1,819 1,737
Copper, USD / tonne 6,128 7,050 6,550
Note: * denotes the forecast period.
Source: EDC Global Economic Outlook, January 2021
25UNCERTAINTY AND RISKS
Economic Policy Uncertainty Index Measures of global economic uncertainty
Mean = 100 have started to decline after peaking in May 2020,
500 but remain elevated.
450 • There still remains an exceptionally high degree of uncertainty
around this forecast, due to the severity and spread of the
400 pandemic, its interdependence on containment efforts, as well as
350 the scale and efficacy of unprecedented policy responses.
• This report represents EDC’s base case economic forecast, as of
300
Nov. 30, 2020, and is based on assumptions described above.
250 There are significant risks to this base case, both to the upside
and the downside.
200
150
100
50
0
2009 2010 2011 2012 2013 2014 2015 2016 2017 2018 2019 2020
Source: PolicyUncertainty.com
26DISCLOSURE
Ce document est également disponible en français.
This document isn’t intended to provide specific advice and shouldn’t be relied on as such. It’s intended as an
overview only. No action or decision should be taken without detailed independent research and professional
advice concerning the specific subject matter of such action or decision. While Export Development Canada
(EDC) has made reasonable commercial efforts to ensure that the information contained in this document is
accurate, EDC doesn’t represent or warrant the accurateness, timeliness or completeness of the information
contained herein. This document or any part of it may become obsolete at any time. It’s the user’s responsibility
to verify any information contained herein before relying on such information. EDC isn’t liable in any manner
whatsoever for any loss or damage caused by or resulting from any inaccuracies, errors or omissions in the
information contained in this document. This document isn’t intended to and doesn’t constitute legal or tax
advice. For legal or tax advice, please consult a qualified professional. EDC is the owner of trademarks and
official marks. Any use of an EDC trademark or official mark without written permission is strictly prohibited.
All other trademarks appearing in this document are the property of their respective owners. The information
presented is subject to change without notice. EDC assumes no responsibility for inaccuracies contained herein.
Copyright © 2021 Export Development Canada. All rights reserved.
27You can also read